2102 Bradford St · Clarksville, IN
Flood risk No data
- FEMA flood zone
- —
- Chance of flooding over 30 yrs
- —
- Est. flood insurance / yr
- —
Fire risk No data
- Est. fire insurance / yr
- —
Heat risk No data
- Hot days now (above threshold)
- —
- Hot days in 30 yrs
- —
Wind risk No data
- Chance of severe wind over 30 yrs
- —
Air-quality risk No data
- Unhealthy air days now
- —
- Unhealthy air days in 30 yrs
- —
Risk factors via First Street. Map © Google.
Why this score? — see what drove the B- grade
The composite is a weighted blend of 9 inputs, each scored 0–100. Each bar is that input's sub-score; the figure is the points it added to the 100-point composite (weight × sub-score).
- Cash flow +30.0/30.0
- 1% rule +10.0/10.0
- DSCR +10.0/10.0
- ARV discount +7.5/15.0
- Livability +3.8/5.0
- Schools +2.7/10.0
- Rent growth +2.5/5.0
- Condition / age +2.2/5.0
- Appreciation +0.0/10.0
$50,775
🖨 Deal sheet (PDF) 📄 Offer letter ✓ Due diligence
Listing remarks
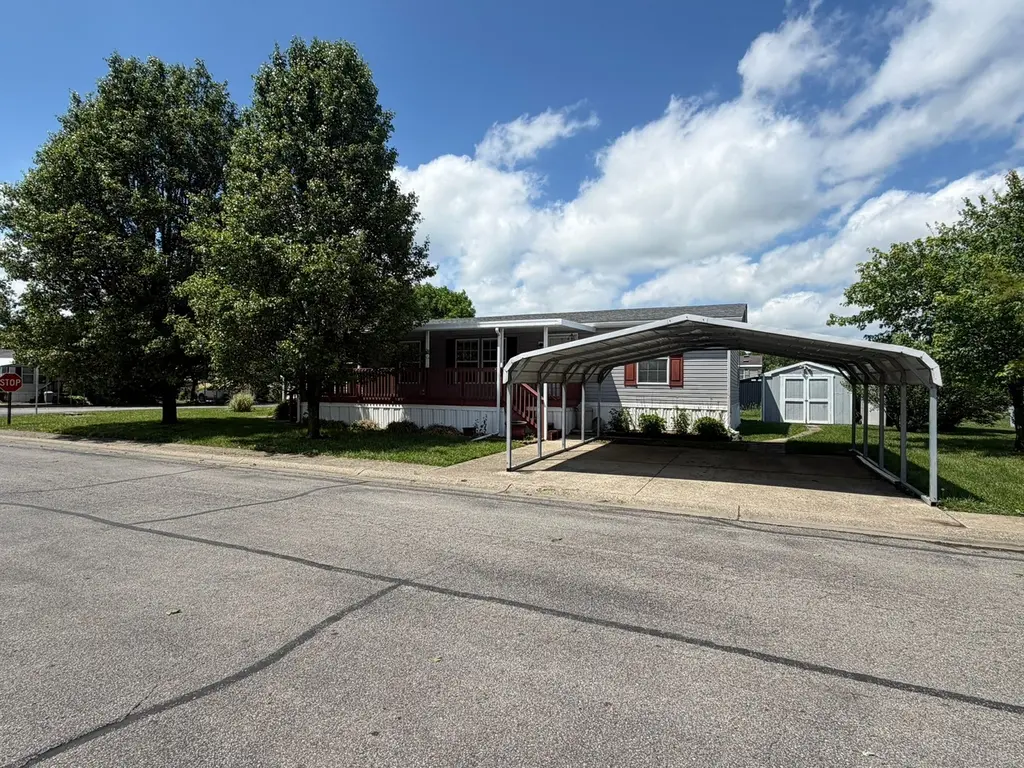
Step into a spacious double wide in the sought after Wellington Green community that checks all the boxes. From the moment you arrive the double carport and inviting curb appeal set the tone. Enjoy two large covered decks with awnings perfect for relaxing or entertaining plus a convenient storage shed for all your extras. Inside you will find three comfortable bedrooms and a beautiful kitchen loaded with cabinet space and all appliances included to make daily living easy. The separate dining room is filled with natural light creating a bright welcoming space for meals and gatherings. A dedicated laundry and mud room with washer and dryer adds even more function and convenience. Homes with t
Key facts
- Clubhouse
- Separate dining room
- Double carport
Tags
Property features AI
Finance
- Financial info: Listed for $50,900
Exterior
- Home design: Single-section home (3 bed, 2 bath); Spec-built new construction; Located at 2102 Bradford St, Clarksville IN 47129
- Exterior features: Living area approximately 1568
Interior
- Kitchen: Includes dishwasher, disposal, and refrigerator
- Bedrooms: 3 bedrooms
- Bathrooms: 2 bathrooms
- Interior features: Dishwasher; Disposal; Refrigerator
Neighborhood map
What this means for you Summary
Snapshot
- This is a 3-bed/2.0-bath manufactured listed at $51k. Condition is rated fair.
Deal economics
- At list price, monthly cash flow is $732 ($9k/yr) — positive.
- The deal already cash-flows at list — no discount required.
- Meets the 1% rule at list price ($1k rent vs $51k).
- Recommended offer: $50k (1.5% below list) — sets the bar for market timing.
- Cap rate 23.6% vs local median 3.3% in Clarksville — top-decile yield for the area; either an underpriced asset or a hidden risk that comps aren't pricing in. Stress-test before assuming the spread holds.
Location & tenants
- Location reads 76/100 on livability (#46 in IN, #3,300 nationally) — a middle-class / working-renter tenant base. Strengths: cost of living A+, housing A+, commute A-; Watch: crime D+, employment D+, amenities D.
- Greater Clark County Schools (suburban): math 26% / reading 37% proficiency, ranked #224 of 301 in IN (top 74%) — families likely to look elsewhere, expect single-tenant / working-renter base with shorter leases.
- Zoned schools: W E Wilson Elementary (math 31% / reading 32%, grade F, #678 of 994 statewide, top 68%, 481 students, 70% FRL); River Valley Middle School (math 21% / reading 35%, grade F, #226 of 330 statewide, top 69%, 850 students, 67% FRL); Jeffersonville High School (math 17% / reading 52%, grade F, #270 of 369 statewide, top 77%, 2,130 students, 58% FRL) — zoned schools average 65% FRL vs 48% district-wide (17 pts higher); higher-poverty schools than district average — tighter screening recommended.
- Market conditions: 29 active listings in the ZIP; 12 comparable units currently listed for rent nearby; rentals leasing fast (median 5d on market — plan ~1-2 weeks tenant-placement turnaround); 42% of comp listings sitting > 30 days — soft ceiling on asking rent; 911 units permitted in Clark County in 2024 (133 in 5+ unit buildings).
Forward outlook
- Local home prices are declining (-3.0%/yr); year-one equity from $351 of loan paydown is wiped out by about $2k of value loss. Plan a longer hold.
- Clark County population projected at +17% by 2050 — long-run rental-demand tailwind backs the buy-and-hold thesis.
- At projected returns (-3.0% appreciation + 3.0% rent growth), your $14k cash investment doubles in ~2 years — after that, you're playing with house money.
Negotiation context
- It's been on market 22 days — a 2% lower offer ($50k) is reasonable based on typical stale-listing flexibility.
Questions for the listing agent
- Have any recent inspections been done? Can we get a copy of the seller's disclosures and any deferred-maintenance estimates?
- Is there a deadline driving the sale (1031 exchange, divorce, estate, relocation)? That informs how much negotiation room exists.
- Schools are D-rated, which usually means shorter tenancies and higher turnover. Who's the typical renter profile here, and what's been the actual vacancy rate?
- Crime grade is D in this area — have there been break-ins, vandalism, or insurance claims at this property in the last 3 years? What carrier currently insures it and at what premium?
- What's the average days-on-market for RENTAL listings here right now (not sales)? A rising rental-DOM trend means longer vacancies and softer asking-rent achievability than the comps imply.
- What's the recent tenant-quality profile in this submarket — average credit score on applications, eviction rate, late-payment / NSF rate, and stable-employment percentage? A property-management company in the area should have these aggregated.
- How much new for-sale + rental construction is in the pipeline within 1–3 miles? Heavy new supply typically softens prices + rents 12–24 months out; constrained supply supports both.
Investment metrics
- 1% rule
- 2.70% ✓
- Cap rate
- 23.58%
- Cash-on-cash
- 61.74%
- DSCR
- 3.75
- GRM
- 3.1
CMA / ARV
No comps found within radius.
Projected returns pro-forma
-3.0% appreciation · 3.0% rent growth · sell at horizon
- IRR
- 60.6%
- Equity multiple
- 3.70×
- Total profit
- $38,383
- Equity at exit
- $7,571
- IRR
- 65.3%
- Equity multiple
- 7.58×
- Total profit
- $93,498
- Equity at exit
- $4,390
Cash invested: $14,217 (down + closing). Projections, not guarantees.
Landlord ↔ Tenant lean methodology
- Overall (STATE)
- 90 Strongly Landlord-Friendly
- State Indiana
- 90 Strongly Landlord-Friendly · R+11
- County
- — inherits STATE
- City
- — inherits STATE
ZIP-level market 47129
- Home prices YoY
- -30.9%
- Active inventory
- 29
- Price-to-rent
- 3.1×
Monthly cashflow live
- Estimated rent
- $1,370 high interval (Pro) →
- Mortgage (P&I)
- −$266
- Tax est. 1.5%
- −$63 /mo · $762/yr
- Insurance
- −$21
- HOA
- −$0
- Vacancy / Maint / Mgmt
- −$288
- Net cashflow
- $732
Break-even live
Sensitivity live
| Price | -10% $767 | -5% $749 | +0% $732 | +5% $714 | +10% $696 |
|---|---|---|---|---|---|
| Rent | -10% $623 | -5% $677 | +0% $732 | +5% $786 | +10% $840 |
| Rate | -1.0pp $757 | -0.5pp $744 | base $732 | +0.5pp $718 | +1.0pp $705 |
UW: 25.0% down · 7.5% · 30yr · 1.5% tax · 5.0% vac · 8.0% maint · 8.0% mgmt
Financing live
Cash to close
- Down payment
- $12,694
- Closing costs
- $1,523
- Reserves months
- —
- Total cash needed
- —
Loan-product check · same deal, 3 products live
Conventional
25% down · 7.5% · 30yr
- Down + closing
- —
- Monthly P&I
- —
- Monthly cashflow
- —
- DSCR
- —
- Eligible?
- —
Personal DTI + credit; lowest rate.
DSCR
20% down · 8.5% · 30yr
- Down + closing
- —
- Monthly P&I
- —
- Monthly cashflow
- —
- DSCR
- —
- Eligible?
- —
No personal income docs; deal must DSCR.
Hard money
10% down · 12.0% · 12mo
- Down + closing
- —
- Monthly P&I
- —
- Monthly cashflow
- —
- DSCR
- —
- Eligible?
- —
Short-term bridge; refi at stabilization.
Rent comps 12 comps
| Address | Beds | Baths | Sqft | Rent | $/sqft | DOM | Units | Dist |
|---|---|---|---|---|---|---|---|---|
| 2102 Bradford St Unit 94B Clarksville, IN | 3.0 | 2.0 | 1568 | $1,259 | $0.80 | 5d | 1 | 0.03mi |
| 2132 Pacific Dr Unit 16B Clarksville, IN | 3.0 | 2.0 | 1056 | $1,299 | $1.23 | 45d | 1 | 0.05mi |
| 2331 Wellington Green Dr Unit 66 Clarksville, IN | 3.0 | 2.0 | 1088 | $1,059 | $0.97 | 45d | 1 | 0.14mi |
| 2304 Wellington Green Dr Unit 170 Clarksville, IN | 3.0 | 2.0 | 1088 | $1,169 | $1.07 | 45d | 1 | 0.20mi |
| 2424 Addmore Ln Clarksville, IN | 3.0 | 2.0 | 1080 | $1,250 | $1.16 | 5d | 1 | 0.39mi |
| 2022 Greentree N Unit 1 Clarksville, IN | 3.0 | 2.5 | 1635 | $2,110 | $1.29 | 45d | 1 | 0.57mi |
| 4501 Town Center Blvd Jeffersonville, IN | 1.0–3.0 | 1.0–2.0 | 1172 | $1,930 | $1.65 | 3d | 62 | 0.67mi |
| 4903 Hamburg Pike Jeffersonville, IN | 1.0–3.0 | 1.0–2.0 | 1172 | $1,820 | $1.55 | 3d | 21 | 0.80mi |
| 1909 Greentree Blvd Clarksville, IN | 1.0–3.0 | 1.0–2.0 | 980 | $2,010 | $2.05 | 3d | 11 | 1.12mi |
| 1815 Greentree Blvd Unit 1813-170 Clarksville, IN | 3.0 | 2.0 | 1260 | $1,307 | $1.04 | 45d | 1 | 1.19mi |
| 1418 Marlowe Dr Clarksville, IN | 1.0–3.0 | 1.0–2.0 | 954 | $1,338 | $1.40 | 3d | 13 | 1.31mi |
| 1201 Marlowe Dr Clarksville, IN | 1.0–3.0 | 1.0–1.5 | 1127 | $1,409 | $1.25 | 3d | 1 | 1.50mi |
Listing history 17 events
-
2026-06-21days on market $50,775 Active 22 DOM
-
2026-06-18days on market $50,775 Active 19 DOM
-
2026-06-17days on market $50,775 Active 18 DOM
-
2026-06-16days on market $50,775 Active 17 DOM
-
2026-06-15days on market $50,775 Active 16 DOM
-
2026-06-13days on market $50,775 Active 14 DOM
-
2026-06-13days on market $50,775 Active 13 DOM
-
2026-06-10days on market $50,775 Active 11 DOM
-
2026-06-09days on market $50,775 Active 10 DOM
-
2026-06-08days on market $50,775 Active 9 DOM
-
2026-06-08price $50,775 Active 8 DOM
-
2026-06-07days on market $50,900 Active 8 DOM
-
2026-06-03days on market $50,900 Active 4 DOM
-
2026-06-02days on market $50,900 Active 3 DOM
-
2026-06-01days on market $50,900 Active 2 DOM
-
2026-05-31remarks 699-char remark
-
2026-05-31$50,900 Active 1 DOM
ⓘ Source: listings_history table (triggers on properties + properties_extension) + one-shot
backfill from property_details.listing_events for pre-trigger history.
Nearby sold comps map
Loading sold comps map…
Walkable amenities ~0.75 mi
Loading nearby amenities…
Taxation est. · year 1
- Rental income
- $16,441
- − Mortgage interest
- −$2,844
- − Property taxes
- −$762
- − Insurance
- −$254
- − Repairs & maintenance
- −$1,315
- − Management
- −$1,315
- − Depreciation
- −$1,477
- Taxable income
- $8,474
- Est. tax owed @ 24.0%
- −$2,034
- After-tax cash flow
- $6,744/yr
For passive investors: Depreciation is non-cash, so a rental often shows a tax loss while cash-flowing — sheltering income. Rental losses are passive: they offset passive income freely, and up to $25,000/yr can offset ordinary (W-2) income if you actively participate and your MAGI is under $100k (phasing out to $0 by $150k); unused losses carry forward. On sale, claimed depreciation is recaptured at up to 25%, and gains may owe capital-gains tax (a 1031 exchange can defer both). Figures are a year-1 estimate at your 24.0% rate — not tax advice; consult a CPA.
Condition & rehab AI · 12 photos
This double-wide manufactured home requires moderate repairs and maintenance to improve its condition and value. Key updates include painting interior walls, replacing kitchen countertops, and repairing bathroom fixtures.
Repairs flagged
- Minor kitchen cabinets — slight wear
- Minor bathroom wallpaper — slight wear
- Minor exterior siding — slight wear
Value-add opportunities
- Resale paint interior walls — enhances curb appeal
- Resale replace kitchen countertops — modernizes kitchen
- Resale repair/replace bathroom fixtures — improves bathroom functionality
Renovation cost estimate screening
| Repair item | Severity | Est. cost |
|---|---|---|
| kitchen cabinets · slight wear | Minor | $500–3,000 |
| bathroom wallpaper · slight wear | Minor | $500–3,000 |
| exterior siding · slight wear | Minor | $500–3,000 |
| Total estimated repair cost · 3 items | $1,500–9,000 |
Value-add ROI direction
- Resale paint interior walls — enhances curb appeal ↑
- Resale replace kitchen countertops — modernizes kitchen ↑
- Resale repair/replace bathroom fixtures — improves bathroom functionality ↑
ⓘ Cost ranges are severity-bucket heuristics (US national rule-of-thumb). Get contractor quotes + a written scope before underwriting a rehab budget.
Schools (NCES district)
- District
- Greater Clark County Schools
- NCES district ID
- 1803940
- Math proficiency
- 26% ▼ -15.00%
- Reading proficiency
- 37% ▼ -13.00%
- Median HH income
- $47,838
- Composite
- 27.2/100
- National rank
- #7020
- State rank
- #224 of 301 in IN
Livability — Clarksville
- Score
- 76/100
- State rank
- #46
- US rank
- #3300
Category grades
Schools grade is shown separately in the Schools card above.
Census & demographics
- Census place
- Clarksville, IN
- County
- Clark County · 108,879 people
- City population
- 19,582
- Metro
- Louisville/Jefferson County, KY-IN
- Population (ZIP)
- 19,582
- Household income
- $56,185
- Rent vs Own
- Severe rent burden
- 774.0
Population outlook (Clark County) Hauer SSP2
- Today (2025)
- 126,401 people
- By 2030
- 131,455 · +4.0%
- By 2040
- 140,471 · +11.1%
- By 2050
- 147,677 · +16.8%
- By 2075
- 161,702 · +27.9%
- By 2100
- 164,078 · +29.8%
Race, ethnicity, and origin ACS 2023
- Neighborhood character
- Predominantly White (70%)
- Race & ethnicity
- White 70% Hispanic / Latino 18% Black 8% Two or more races 7% Native American 2%
- Hispanic origin (detail)
- Mexican 15% Puerto Rican 2%
- Common ancestry
- Lithuanian 2% Slovak 2% Romanian 1%
- Foreign-born
- 10% · Canada
- Languages at home
- 84% English-only · Spanish 15%
Political lean MEDSL · Clark
- 2024 margin
- Strong R (+20.4) · D 38.9% · R 59.3% · Other 1.8%
- 2008→2024 swing
- -13.3pp toward R · 2008: -7.1pp · 2024: -20.4pp
- All cycles
- 2024: R+20.4 2020: R+18.3 2016: R+22.0 2012: R+9.9 2008: R+7.1
Not yet ingested
- Civics
- —
Market trends
- HPI YoY
- ▼ -104.33%
- Current HPI
- 233.0094
- Rent YoY
- —
- Metro
- Louisville/Jefferson County, KY-IN
- State GDP YoY
- ▲ 2.90%
- F500 in state
- 18
Industry mix (Fortune 500 HQ in IN)
| Industry | F500 HQs | Revenue |
|---|---|---|
| Industrial Machinery | 2 | $37B |
|
||
| Healthcare | 1 | $177B |
|
||
| Pharmaceuticals | 1 | $45B |
|
||
| Metals / Steel | 1 | $18B |
|
||
| Agriculture | 1 | $17B |
|
||
| Packaging | 1 | $12B |
|
||
Cash-flow waterfall
monthlySold comps — $/sqft
last 12 mo · ≤1 miLoading sold comps…