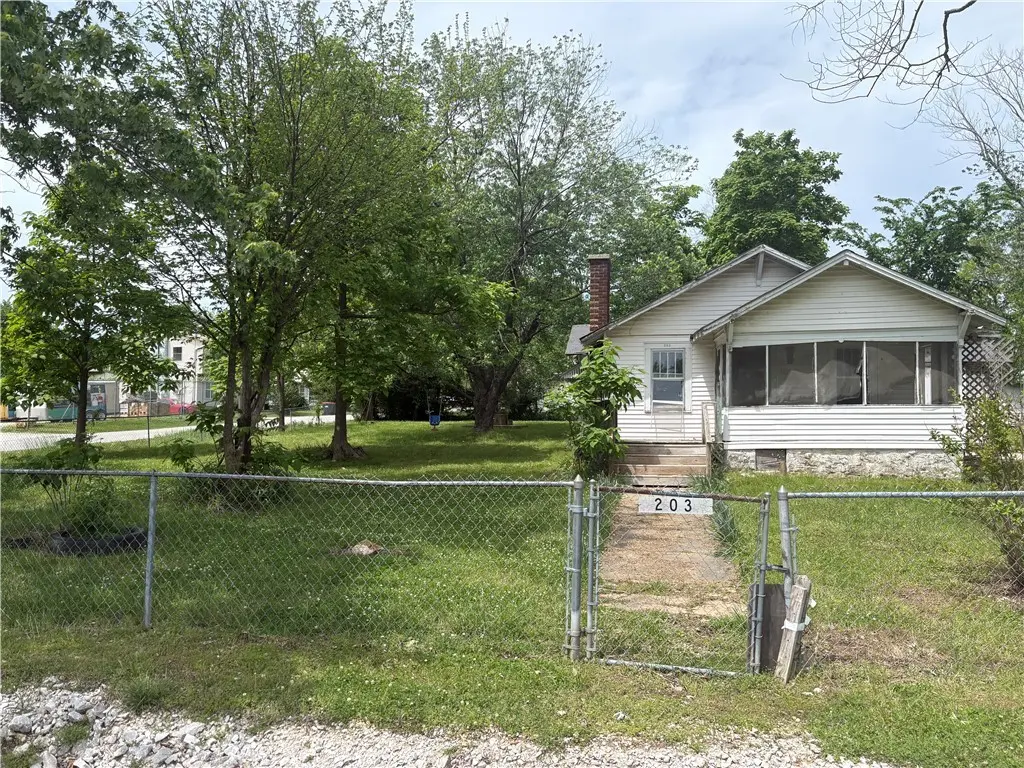
203 Bean St · Lincoln, AR
Flood risk 1/10 · Minimal
- FEMA flood zone
- X (unshaded)
- Chance of flooding over 30 yrs
- 0.0%
- Est. flood insurance / yr
- $507 – $1,088
Fire risk 6/10 · Moderate
- Est. fire insurance / yr
- $1,499 – $2,785
Heat risk 5/10 · Moderate
- Hot days now (above 104°F)
- 7 days/yr
- Hot days in 30 yrs
- 20 days/yr
Wind risk 2/10 · Minimal
- Chance of severe wind over 30 yrs
- 3.0%
Air-quality risk 2/10 · Minimal
- Unhealthy air days now
- 0 days/yr
- Unhealthy air days in 30 yrs
- 1 days/yr
Risk factors via First Street. Map © Google.
Why this score? — see what drove the D grade
The composite is a weighted blend of 9 inputs, each scored 0–100. Each bar is that input's sub-score; the figure is the points it added to the 100-point composite (weight × sub-score).
- ARV discount +15.0/15.0
- Appreciation +10.0/10.0
- Cash flow +6.6/30.0
- Livability +3.0/5.0
- Schools +2.7/10.0
- Rent growth +2.5/5.0
- Condition / age +2.5/5.0
- 1% rule +1.0/10.0
- DSCR +0.8/10.0
$150,000
🖨 Deal sheet (PDF) 📄 Offer letter ✓ Due diligence
Listing remarks
Large lot and as is home. Home is almost gutted and needs full repair. Lot has road frontage on 2 sides as city streets and 1 other side is alley way. This lot is large and has so much potential
Key facts
- Large lot
- Road frontage
- 0.53 acre lot
Tags
Property features AI
Finance
- HOA & community: Monthly association fee; Near fire station
Exterior
- Parking: No driveway
- Utilities: Electricity available; Sewer available; Public water available
- Home design: Single-story residence; Vinyl siding; Architectural and shingle roof; Crawlspace foundation
- Construction: Built with vinyl siding; Architectural and shingle roof; Crawlspace foundation
- Exterior features: Porch; Outbuilding; Fenced front and back yard; Level, corner lot in the central business district; Public paved road frontage
Interior
- Bathrooms: 1 full bathroom
- Interior features: Crawl space basement; Wood burning stove in family room; No additional interior features listed
Neighborhood map
What this means for you Summary
Snapshot
- This is a 3-bed/1.0-bath single-family listed at $150k.
Deal economics
- At list price, monthly cash flow is $-249 ($-3k/yr) — negative.
- To cash-flow at today's rent, offer at most $106k (29.3% below list).
- To meet the 1% rule (rent ≥ 1% of price), the offer needs to be $90k (40.0% below list).
- Recommended offer: $90k (40.0% below list) — sets the bar for 1% rule.
- Cap rate 4.3% vs local median 2.3% in Lincoln — top-decile yield for the area; either an underpriced asset or a hidden risk that comps aren't pricing in. Stress-test before assuming the spread holds.
Location & tenants
- Location reads 60/100 on livability (#273 in AR) — a middle-class / working-renter tenant base. Strengths: cost of living A+, housing A+, health & safety A+; Watch: crime D, amenities F, commute F.
- Lincoln School District (rural): math 34% / reading 31% proficiency, ranked #139 of 238 in AR (top 58%) — families likely to look elsewhere, expect single-tenant / working-renter base with shorter leases.
- Zoned schools: Lincoln Elementary School (math 42% / reading 17%, grade F, #305 of 454 statewide, top 71%, 373 students, 70% FRL); Lincoln Middle School (math 38% / reading 32%, grade F, #122 of 201 statewide, top 61%, 400 students, 72% FRL); Lincoln New Tech High School (math 22% / reading 32%, grade F, #164 of 292 statewide, top 61%, 349 students, 65% FRL, charter).
- Market conditions: 102 active listings in the ZIP; 1 comparable units currently listed for rent nearby; 3,494 units permitted in Washington County in 2024 (1,497 in 5+ unit buildings).
Forward outlook
- In year one you build about $16k of equity ($1k loan paydown + $15k appreciation (10.0% local appreciation)).
- Washington County population projected at +47% by 2050 — long-run rental-demand tailwind backs the buy-and-hold thesis.
- By year 3, paydown + projected appreciation supports a ~$41k cash-out refi (75% LTV) — recoverable capital for the next deal without selling this one.
Negotiation context
- It's been on market 51 days — a 3% lower offer ($146k) is reasonable based on typical stale-listing flexibility.
- Current owner paid $22k; list at $150k implies a 582% gain — meaningful room to come down on a strong offer.
Risks & watch-outs
- Watch-outs: built in 1935 — expect roof / HVAC / electrical / plumbing capex.
- Climate carrying-cost: major wildfire risk; extreme-heat days projected 7→20/yr by 2055 (HVAC capex compounding) — expect insurance premiums to compound above CPI over the hold.
Questions for the listing agent
- What do current leases actually rent for vs. the listed asking? Can we see a recent rent roll and the last 12 months of T-12 income?
- It's been on market 51 days. Have you received any prior offers? Is the seller open to a 40% concession, seller financing, or rate buy-down credit?
- Built in 1935 — when were the roof, HVAC, electrical panel, plumbing, and water heater last replaced?
- Is there a deadline driving the sale (1031 exchange, divorce, estate, relocation)? That informs how much negotiation room exists.
- Schools are F-rated, which usually means shorter tenancies and higher turnover. Who's the typical renter profile here, and what's been the actual vacancy rate?
- Crime grade is D in this area — have there been break-ins, vandalism, or insurance claims at this property in the last 3 years? What carrier currently insures it and at what premium?
- The area grade is low — what's the realistic commute time and amenity access for the typical tenant pool here? Any planned neighborhood developments (good or bad) we should know about?
- What's the average days-on-market for RENTAL listings here right now (not sales)? A rising rental-DOM trend means longer vacancies and softer asking-rent achievability than the comps imply.
- What's the recent tenant-quality profile in this submarket — average credit score on applications, eviction rate, late-payment / NSF rate, and stable-employment percentage? A property-management company in the area should have these aggregated.
- How much new for-sale + rental construction is in the pipeline within 1–3 miles? Heavy new supply typically softens prices + rents 12–24 months out; constrained supply supports both.
Investment metrics
- 1% rule
- 0.60% ✗
- Cap rate
- 4.30%
- Cash-on-cash
- -7.10%
- DSCR
- 0.68
- GRM
- 13.9
CMA / ARV
- ARV (median comp)
- $200,356
- List price
- $150,000
- Delta
- -25.13%
- Verdict
- UNDERPRICED
- Comps
- 20 within 1.0 mi
Show comp detail 12 sales within ~0.75 mi
| Address | Dist | Beds/Ba | Sqft | Sold | Price | $/sf | Match |
|---|---|---|---|---|---|---|---|
| 180 Quincy Ave | 0.23mi | 3/2.0 | 1,222 (-0%) | 2mo | $220,000 | $180 | 83 |
| 107 North West Ave | 0.23mi | 3/1.0 | 1,182 (-4%) | 12mo | $211,000 | $179 | 73 |
| 303 N Main Ave | 0.22mi | 3/1.0 | 1,344 (+10%) | 3mo | $168,500 | $125 | 71 |
| 733 Applegate Ln | 0.42mi | 3/2.0 | 1,259 (+3%) | 6mo | $210,000 | $167 | 67 |
| 213 N West Ave | 0.29mi | 2/2.0 (-1) | 1,198 (-2%) | 9mo | $219,900 | $184 | 66 |
| 315 Half St | 0.46mi | 2/1.5 (-1) | 1,248 (+2%) | 5mo | $155,000 | $124 | 65 |
| 512 E Bean St | 0.25mi | 3/2.0 | 1,084 (-12%) | 1mo | $260,000 | $240 | 64 |
| 304 Shady St | 0.34mi | 3/2.0 | 1,141 (-7%) | 6mo | $230,000 | $202 | 63 |
| 711 Applegate Ln | 0.35mi | 3/2.0 | 1,344 (+10%) | 6mo | $215,000 | $160 | 58 |
| 595 Pleasant Tree Pl | 0.55mi | 3/2.0 | 1,112 (-9%) | 1mo | $190,000 | $171 | 54 |
| 420 Hope Ln | 0.60mi | 3/2.0 | 1,325 (+8%) | 2mo | $265,000 | $200 | 53 |
| 1012 E North St | 0.61mi | 2/1.0 (-1) | 1,190 (-3%) | 14mo | $225,000 | $189 | 50 |
Match score weights: distance 35% · size 25% · config 20% · recency 20%. Top-matched comps best support the ARV.
Projected returns pro-forma
10.0% appreciation · 3.0% rent growth · sell at horizon
- IRR
- 19.3%
- Equity multiple
- 2.57×
- Total profit
- $65,829
- Equity at exit
- $135,132
- IRR
- 17.7%
- Equity multiple
- 5.91×
- Total profit
- $206,238
- Equity at exit
- $291,417
Cash invested: $42,000 (down + closing). Projections, not guarantees.
Landlord ↔ Tenant lean methodology
- Overall (STATE)
- 92 Strongly Landlord-Friendly
- State Arkansas
- 92 Strongly Landlord-Friendly · R+14
- County
- — inherits STATE
- City
- — inherits STATE
ZIP-level market 72744
- Home prices YoY
- 13.0%
- Active inventory
- 102
- Price-to-rent
- 13.9×
Monthly cashflow live
- Estimated rent
- $900 medium interval (Pro) →
- Mortgage (P&I)
- −$787
- Tax from tax record
- −$110 /mo · $1,325/yr
- Insurance
- −$62
- HOA
- −$0
- Vacancy / Maint / Mgmt
- −$189
- Net cashflow
- $-249
Break-even live
Sensitivity live
| Price | -10% $-164 | -5% $-206 | +0% $-249 | +5% $-291 | +10% $-333 |
|---|---|---|---|---|---|
| Rent | -10% $-320 | -5% $-284 | +0% $-249 | +5% $-213 | +10% $-177 |
| Rate | -1.0pp $-173 | -0.5pp $-210 | base $-249 | +0.5pp $-287 | +1.0pp $-327 |
UW: 25.0% down · 7.5% · 30yr · 1.5% tax · 5.0% vac · 8.0% maint · 8.0% mgmt
Financing live
Cash to close
- Down payment
- $37,500
- Closing costs
- $4,500
- Reserves months
- —
- Total cash needed
- —
Loan-product check · same deal, 3 products live
Conventional
25% down · 7.5% · 30yr
- Down + closing
- —
- Monthly P&I
- —
- Monthly cashflow
- —
- DSCR
- —
- Eligible?
- —
Personal DTI + credit; lowest rate.
DSCR
20% down · 8.5% · 30yr
- Down + closing
- —
- Monthly P&I
- —
- Monthly cashflow
- —
- DSCR
- —
- Eligible?
- —
No personal income docs; deal must DSCR.
Hard money
10% down · 12.0% · 12mo
- Down + closing
- —
- Monthly P&I
- —
- Monthly cashflow
- —
- DSCR
- —
- Eligible?
- —
Short-term bridge; refi at stabilization.
Rent comps 1 comps
| Address | Beds | Baths | Sqft | Rent | $/sqft | DOM | Units | Dist |
|---|---|---|---|---|---|---|---|---|
| 381 N Main Ave Unit 383 Lincoln, AR | 3.0 | 2.0 | 1100 | $900 | $0.82 | 45d | 1 | 0.29mi |
Listing history 19 events
-
2026-06-21days on market $150,000 Active 51 DOM
-
2026-06-18days on market $150,000 Active 48 DOM
-
2026-06-17days on market $150,000 Active 47 DOM
-
2026-06-16days on market $150,000 Active 46 DOM
-
2026-06-15days on market $150,000 Active 45 DOM
-
2026-06-14days on market $150,000 Active 43 DOM
-
2026-06-13days on market $150,000 Active 42 DOM
-
2026-06-10days on market $150,000 Active 40 DOM
-
2026-06-09days on market $150,000 Active 39 DOM
-
2026-06-08days on market $150,000 Active 38 DOM
-
2026-06-07days on market $150,000 Active 37 DOM
-
2026-06-05days on market $150,000 Active 34 DOM
-
2026-06-03days on market $150,000 Active 33 DOM
-
2026-06-02days on market $150,000 Active 32 DOM
-
2026-06-01days on market $150,000 Active 31 DOM
-
2026-05-31days on market $150,000 Active 30 DOM
-
2026-05-31days on market $150,000 Active 29 DOM
-
2026-05-01$150,000 Active 195-char remark
-
1987-06-08soldstatus $22,000
ⓘ Source: listings_history table (triggers on properties + properties_extension) + one-shot
backfill from property_details.listing_events for pre-trigger history.
Tax reassessment forecast AR · Resets to sale price
- Current annual tax
- $1,325 · $110/mo
- Projected year-2 tax
- $1,325 · $110/mo
- Expected delta
- $0/yr ($0/mo · 0.0%)
ⓘ Screening estimate from a state-policy table — verify with the county assessor before closing.
Climate risk First Street
- Flood 1/10 Low FEMA zone X (unshaded) · 0% chance over 30 yrs
- Wildfire 6/10 Major
- Heat 5/10 Major 7 d/yr ≥104°F today · 20 d/yr by 30 yrs out
- Wind 2/10 Low 3% chance of damaging wind over 30 yrs
- Air quality 2/10 Low 0 unhealthy d/yr today · 1 by 30 yrs out
Nearby sold comps map
Loading sold comps map…
Walkable amenities ~0.75 mi
Loading nearby amenities…
Taxation est. · year 1
- Rental income
- $10,800
- − Mortgage interest
- −$8,402
- − Property taxes
- −$1,325
- − Insurance
- −$750
- − Repairs & maintenance
- −$864
- − Management
- −$864
- − Depreciation
- −$4,364
- Taxable loss
- −$5,769
- Est. tax savings @ 24.0%
- +$1,385
- After-tax cash flow
- $-1,598/yr
For passive investors: Depreciation is non-cash, so a rental often shows a tax loss while cash-flowing — sheltering income. Rental losses are passive: they offset passive income freely, and up to $25,000/yr can offset ordinary (W-2) income if you actively participate and your MAGI is under $100k (phasing out to $0 by $150k); unused losses carry forward. On sale, claimed depreciation is recaptured at up to 25%, and gains may owe capital-gains tax (a 1031 exchange can defer both). Figures are a year-1 estimate at your 24.0% rate — not tax advice; consult a CPA.
Schools (NCES district)
- District
- Lincoln School District
- NCES district ID
- 0508940
- Math proficiency
- 34% ▼ -8.00%
- Reading proficiency
- 31% ▼ -9.00%
- Median HH income
- $36,258
- Composite
- 26.98/100
- National rank
- #7070
- State rank
- #139 of 238 in AR
Livability — Lincoln
- Score
- 60/100
- State rank
- #273
- US rank
- #19376
Category grades
Schools grade is shown separately in the Schools card above.
Census & demographics
- Census place
- Lincoln, AR
- Population (ZIP)
- 5,314
Population outlook (Washington County) Hauer SSP2
- Today (2025)
- 271,748 people
- By 2030
- 296,414 · +9.1%
- By 2040
- 346,874 · +27.6%
- By 2050
- 398,552 · +46.7%
- By 2075
- 523,309 · +92.6%
- By 2100
- 615,280 · +126.4%
Race, ethnicity, and origin ACS 2023
- Neighborhood character
- Diverse neighborhood (Simpson 0.55)
- Race & ethnicity
- White 67% Two or more races 23% Hispanic / Latino 8% Asian 2%
- Hispanic origin (detail)
- Mexican 5%
- Common ancestry
- Romanian 3% Lithuanian 3% Iranian 3%
- Foreign-born
- 5% · Canada
- Languages at home
- 92% English-only · Spanish 6% Other Asian/Pacific 2%
Political lean MEDSL · Washington
- 2024 margin
- Lean R (+6.7) · D 45.1% · R 51.7% · Other 3.2%
- 2008→2024 swing
- +6.4pp toward D · 2008: -13.1pp · 2024: -6.7pp
- All cycles
- 2024: R+6.7 2020: R+3.9 2016: R+10.4 2012: R+16.3 2008: R+13.1
Not yet ingested
- Civics
- —
Market trends
- HPI YoY
- ▲ 36.10%
- Current HPI
- 314.677
- Rent YoY
- —
- Metro
- —
- State GDP YoY
- ▲ 3.80%
- F500 in state
- 10
Industry mix (Fortune 500 HQ in AR)
| Industry | F500 HQs | Revenue |
|---|---|---|
| Retail | 1 | $681B |
|
||
| Food / Agriculture | 1 | $53B |
|
||
| Retail / Energy | 1 | $22B |
|
||
| Transportation / Logistics | 1 | $12B |
|
||
| Energy | 1 | $4B |
|
||
Price history
+581.8% since first listed2 events — show timeline
- 2026-05-01 Listed $150,000 NWARMLS
- 1987-06-08 Sold (Public Records) $22,000 Public Records
Property tax history
+5.2%/yrLatest (2025): $1,325 · +0.0% YoY. Source: county tax records.
Cash-flow waterfall
monthlySold comps — $/sqft
last 12 mo · ≤1 miLoading sold comps…