905 Tupuna Dr · Tool, TX
Flood risk No data
- FEMA flood zone
- —
- Chance of flooding over 30 yrs
- —
- Est. flood insurance / yr
- —
Fire risk No data
- Est. fire insurance / yr
- —
Heat risk No data
- Hot days now (above threshold)
- —
- Hot days in 30 yrs
- —
Wind risk No data
- Chance of severe wind over 30 yrs
- —
Air-quality risk No data
- Unhealthy air days now
- —
- Unhealthy air days in 30 yrs
- —
Risk factors via First Street. Map © Google.
Why this score? — see what drove the B+ grade
The composite is a weighted blend of 9 inputs, each scored 0–100. Each bar is that input's sub-score; the figure is the points it added to the 100-point composite (weight × sub-score).
- Cash flow +30.0/30.0
- ARV discount +15.0/15.0
- 1% rule +10.0/10.0
- DSCR +10.0/10.0
- Schools +4.3/10.0
- Livability +3.3/5.0
- Rent growth +2.5/5.0
- Condition / age +2.5/5.0
- Appreciation +0.0/10.0
$92,000
🖨 Deal sheet 📄 Offer letter ✓ Due diligence
Listing remarks MLS
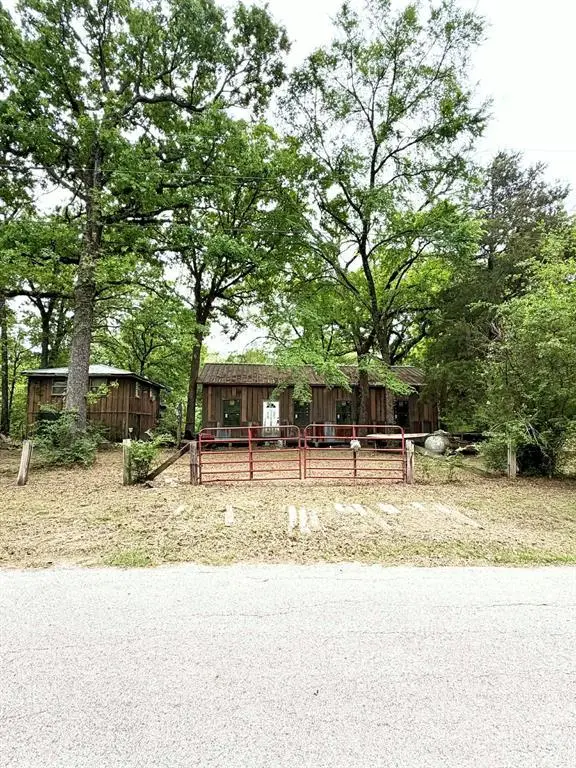
Located in Tool, Texas on 0.69 acres nestled in a forest, this home offers a rare opportunity to create something truly your own! The home is currently framed for a 2 bedroom layout, giving you a head start while leaving the interior unfinished and ready for your vision. The kitchen is a blank slate with no cabinetry in place, allowing complete customization to fit your design and functionality goals. Whether you’re looking to build a private retreat, investment property, or weekend getaway near Cedar Creek Lake, this property delivers flexibility and potential in a peaceful, wooded environment. Located about an hour drive from Dallas, enjoy a quiet setting with convenient access to Cedar Creek Lake and surrounding areas. Cedar Creek Lake is one of the largest lakes in Texas, celebrated for its recreational lifestyle, boating, and bass fishing. Property is being sold as is. Please enter the garage at your own risk. Bring your vision! Claim Your Piece of Texas!
Key facts
- Investment property
- 0.69 acres
- Private retreat
Tags
Neighborhood map
What this means for you Summary
Snapshot
- This is a 2-bed/1.0-bath single-family listed at $92k.
Deal economics
- At list price, monthly cash flow is $890 ($11k/yr) — positive.
- The deal already cash-flows at list — no discount required.
- Meets the 1% rule at list price ($2k rent vs $92k).
- Recommended offer: $86k (6.0% below list) — sets the bar for market timing.
- Cap rate 17.9% vs local median 2.8% in Tool — top-decile yield for the area; either an underpriced asset or a hidden risk that comps aren't pricing in. Stress-test before assuming the spread holds.
Location & tenants
- Location reads 66/100 on livability (#651 in TX) — a middle-class / working-renter tenant base. Strengths: crime A+, cost of living A+, housing A+; Watch: employment D, amenities F, commute F.
- Malakoff ISD (town): math 48% / reading 54% proficiency, ranked #187 of 826 in TX (top 23%) — acceptable for families but not a draw, mixed tenant base, ~2y average lease; 61% free/reduced lunch — lower-income household profile, screen leases tightly.
- Market conditions: 440 active listings in the ZIP; 1 comparable units currently listed for rent nearby; 263 units permitted in Henderson County in 2024 (0 in 5+ unit buildings).
Forward outlook
- Local home prices are declining (-3.0%/yr); year-one equity from $636 of loan paydown is wiped out by about $3k of value loss. Plan a longer hold.
- At projected returns (-3.0% appreciation + 3.0% rent growth), your $26k cash investment doubles in ~3 years — after that, you're playing with house money.
Negotiation context
- It's been on market 71 days — a 6% lower offer ($86k) is reasonable based on typical stale-listing flexibility.
Questions for the listing agent
- It's been on market 71 days. Have you received any prior offers? Is the seller open to a 6% concession, seller financing, or rate buy-down credit?
- What does the HOA fee cover, when was the last increase, and are there any pending special assessments or reserve-fund shortfalls?
- Why hasn't it sold? Are there any deal-killer items the seller is aware of (foundation, flood, title, zoning, code violations)?
- Is there a deadline driving the sale (1031 exchange, divorce, estate, relocation)? That informs how much negotiation room exists.
- What's the average days-on-market for RENTAL listings here right now (not sales)? A rising rental-DOM trend means longer vacancies and softer asking-rent achievability than the comps imply.
- What's the recent tenant-quality profile in this submarket — average credit score on applications, eviction rate, late-payment / NSF rate, and stable-employment percentage? A property-management company in the area should have these aggregated.
- How much new for-sale + rental construction is in the pipeline within 1–3 miles? Heavy new supply typically softens prices + rents 12–24 months out; constrained supply supports both.
Investment metrics
- 1% rule
- 2.15% ✓
- Cap rate
- 17.90%
- Cash-on-cash
- 41.44%
- DSCR
- 2.84
- GRM
- 3.9
CMA / ARV
- ARV (median comp)
- $168,381
- List price
- $92,000
- Delta
- -45.36%
- Verdict
- UNDERPRICED
- Comps
- 14 within 1.0 mi
Show comp detail 10 sales within ~0.75 mi
| Address | Dist | Beds/Ba | Sqft | Sold | Price | $/sf | Match |
|---|---|---|---|---|---|---|---|
| 1313 Aloha Rd | 0.44mi | 2/2.0 | 1,280 (+2%) | 11mo | $275,000 | $215 | 63 |
| 708 Kontiki Dr | 0.27mi | 3/2.0 (+1) | 1,232 (-2%) | 20mo | $269,000 | $218 | 59 |
| 900 Lohaina Ct | 0.30mi | 3/2.0 (+1) | 1,200 (-4%) | 22mo | $450,000 | $375 | 52 |
| 1525 Oak Shore Dr | 0.52mi | 2/2.0 | 1,204 (-4%) | 22mo | $599,000 | $498 | 47 |
| 219 Midway Rd | 0.46mi | 3/2.0 (+1) | 1,380 (+10%) | 10mo | $259,900 | $188 | 44 |
| 1805 Scenic Dr | 0.71mi | 3/2.0 (+1) | 1,298 (+4%) | 12mo | $425,000 | $327 | 42 |
| 713 Luzon Ct | 0.22mi | 3/2.0 (+1) | 1,424 (+14%) | 23mo | $150,000 | $105 | 39 |
| 207 Tanglewood Dr | 0.42mi | 3/2.0 (+1) | 1,404 (+12%) | 16mo | $314,500 | $224 | 38 |
| 1801 Scenic Dr | 0.72mi | 3/2.0 (+1) | 1,144 (-9%) | 13mo | $129,999 | $114 | 32 |
| 309 Kapuna Dr | 0.56mi | 3/2.0 (+1) | 1,392 (+11%) | 23mo | $89,900 | $65 | 27 |
Match score weights: distance 35% · size 25% · config 20% · recency 20%. Top-matched comps best support the ARV.
Projected returns pro-forma
-3.0% appreciation · 3.0% rent growth · sell at horizon
- IRR
- 38.0%
- Equity multiple
- 2.62×
- Total profit
- $41,802
- Equity at exit
- $13,717
- IRR
- 44.6%
- Equity multiple
- 5.25×
- Total profit
- $109,566
- Equity at exit
- $7,954
Cash invested: $25,760 (down + closing). Projections, not guarantees.
Landlord ↔ Tenant lean methodology
- Overall (STATE)
- 87 Strongly Landlord-Friendly
- State Texas
- 87 Strongly Landlord-Friendly · R+5
- County
- — inherits STATE
- City
- — inherits STATE
ZIP-level market 75143
- Home prices YoY
- -11.4%
- Active inventory
- 440
- Price-to-rent
- 3.9×
Monthly cashflow live
- Estimated rent
- $1,975 medium interval (Pro) →
- Mortgage (P&I)
- −$482
- Tax from tax record
- −$145 /mo · $1,738/yr
- Insurance
- −$38
- HOA
- −$5
- Vacancy / Maint / Mgmt
- −$415
- Net cashflow
- $890
Break-even live
UW: 25.0% down · 7.5% · 30yr · 1.5% tax · 5.0% vac · 8.0% maint · 8.0% mgmt
Financing live
Cash to close
- Down payment
- $23,000
- Closing costs
- $2,760
- Reserves months
- —
- Total cash needed
- —
Loan-product check · same deal, 3 products live
Conventional
25% down · 7.5% · 30yr
- Down + closing
- —
- Monthly P&I
- —
- Monthly cashflow
- —
- DSCR
- —
- Eligible?
- —
Personal DTI + credit; lowest rate.
DSCR
20% down · 8.5% · 30yr
- Down + closing
- —
- Monthly P&I
- —
- Monthly cashflow
- —
- DSCR
- —
- Eligible?
- —
No personal income docs; deal must DSCR.
Hard money
10% down · 12.0% · 12mo
- Down + closing
- —
- Monthly P&I
- —
- Monthly cashflow
- —
- DSCR
- —
- Eligible?
- —
Short-term bridge; refi at stabilization.
Rent comps 1 comps
| Address | Beds | Baths | Sqft | Rent | $/sqft | DOM | Units | Dist |
|---|---|---|---|---|---|---|---|---|
| 1813 Oak Shore Dr Tool, TX | 2.0 | 1.0 | 905 | $1,975 | $2.18 | 43d | 1 | 0.68mi |
HOA detail
- Monthly dues
- $5 · $60/yr
Listing history 19 events
-
2026-06-19days on market $92,000 Active 71 DOM
-
2026-06-18days on market $92,000 Active 70 DOM
-
2026-06-17days on market $92,000 Active 69 DOM
-
2026-06-16days on market $92,000 Active 68 DOM
-
2026-06-15days on market $92,000 Active 67 DOM
-
2026-06-14days on market $92,000 Active 65 DOM
-
2026-06-12days on market $92,000 Active 64 DOM
-
2026-06-09days on market $92,000 Active 61 DOM
-
2026-06-08days on market $92,000 Active 60 DOM
-
2026-06-07days on market $92,000 Active 59 DOM
-
2026-06-02days on market $92,000 Active 54 DOM
-
2026-06-01days on market $92,000 Active 53 DOM
-
2026-05-31days on market $92,000 Active 52 DOM
-
2026-05-30days on market $92,000 Active 51 DOM
-
2026-05-07price $92,000 980-char remark
Show marketing remark (980 chars)
Located in Tool, Texas on 0.69 acres nestled in a forest, this home offers a rare opportunity to create something truly your own! The home is currently framed for a 2 bedroom layout, giving you a head start while leaving the interior unfinished and ready for your vision. The kitchen is a blank slate with no cabinetry in place, allowing complete customization to fit your design and functionality goals. Whether you’re looking to build a private retreat, investment property, or weekend getaway near Cedar Creek Lake, this property delivers flexibility and potential in a peaceful, wooded environment. Located about an hour drive from Dallas, enjoy a quiet setting with convenient access to Cedar Creek Lake and surrounding areas. Cedar Creek Lake is one of the largest lakes in Texas, celebrated for its recreational lifestyle, boating, and bass fishing. Property is being sold as is. Please enter the garage at your own risk. Bring your vision! Claim Your Piece of Texas!
-
2026-04-06$100,000 Active 980-char remark
Show marketing remark (980 chars)
Located in Tool, Texas on 0.69 acres nestled in a forest, this home offers a rare opportunity to create something truly your own! The home is currently framed for a 2 bedroom layout, giving you a head start while leaving the interior unfinished and ready for your vision. The kitchen is a blank slate with no cabinetry in place, allowing complete customization to fit your design and functionality goals. Whether you’re looking to build a private retreat, investment property, or weekend getaway near Cedar Creek Lake, this property delivers flexibility and potential in a peaceful, wooded environment. Located about an hour drive from Dallas, enjoy a quiet setting with convenient access to Cedar Creek Lake and surrounding areas. Cedar Creek Lake is one of the largest lakes in Texas, celebrated for its recreational lifestyle, boating, and bass fishing. Property is being sold as is. Please enter the garage at your own risk. Bring your vision! Claim Your Piece of Texas!
-
2011-01-25soldstatus
-
2006-10-11soldstatus
-
1989-02-01soldstatus
ⓘ Source: listings_history table (triggers on properties + properties_extension) + one-shot
backfill from property_details.listing_events for pre-trigger history.
Tax reassessment forecast TX · Resets to sale price
- Current annual tax
- $1,738 · $145/mo
- Projected year-2 tax
- $1,738 · $145/mo
- Expected delta
- $0/yr ($0/mo · -0.0%)
ⓘ Screening estimate from a state-policy table — verify with the county assessor before closing.
Nearby sold comps map
Loading sold comps map…
Walkable amenities ~0.75 mi
Loading nearby amenities…
Taxation est. · year 1
- Rental income
- $23,700
- − Mortgage interest
- −$5,153
- − Property taxes
- −$1,738
- − Insurance
- −$460
- − Repairs & maintenance
- −$1,896
- − Management
- −$1,896
- − HOA
- −$60
- − Depreciation
- −$2,676
- Taxable income
- $9,820
- Est. tax owed @ 24.0%
- −$2,357
- After-tax cash flow
- $8,318/yr
For passive investors: Depreciation is non-cash, so a rental often shows a tax loss while cash-flowing — sheltering income. Rental losses are passive: they offset passive income freely, and up to $25,000/yr can offset ordinary (W-2) income if you actively participate and your MAGI is under $100k (phasing out to $0 by $150k); unused losses carry forward. On sale, claimed depreciation is recaptured at up to 25%, and gains may owe capital-gains tax (a 1031 exchange can defer both). Figures are a year-1 estimate at your 24.0% rate — not tax advice; consult a CPA.
Schools (NCES district)
- District
- Malakoff ISD
- NCES district ID
- 4828780
- Math proficiency
- 48% ▼ -14.00%
- Reading proficiency
- 54% ▼ -5.00%
- Median HH income
- $38,970
- Composite
- 42.54/100
- National rank
- #3200
- State rank
- #187 of 826 in TX
Livability — Tool
- Score
- 66/100
- State rank
- #651
- US rank
- #12292
Category grades
Schools grade is shown separately in the Schools card above.
Census & demographics
- Census place
- Tool, TX
- Population (ZIP)
- 14,676
Population outlook (Henderson County) Hauer SSP2
- Today (2025)
- 80,471 people
- By 2030
- 80,608 · +0.2%
- By 2040
- 80,087 · -0.5%
- By 2050
- 78,208 · -2.8%
- By 2075
- 72,423 · -10.0%
- By 2100
- 61,012 · -24.2%
Race, ethnicity, and origin ACS 2023
- Neighborhood character
- Predominantly White (80%)
- Race & ethnicity
- White 80% Hispanic / Latino 13% Two or more races 8% Black 2%
- Hispanic origin (detail)
- Mexican 13%
- Common ancestry
- Italian 2% Iranian 2% Lithuanian 1%
- Foreign-born
- 4% · Canada, China
- Languages at home
- 90% English-only · Spanish 9%
Political lean MEDSL · Henderson
- 2024 margin
- Solid R (+63.5) · D 18.0% · R 81.4%
- 2008→2024 swing
- -18.8pp toward R · 2008: -44.6pp · 2024: -63.5pp
- All cycles
- 2024: R+63.5 2020: R+60.2 2016: R+60.0 2012: R+54.8 2008: R+44.6
Not yet ingested
- Civics
- —
Market trends
- HPI YoY
- ▼ -42.99%
- Current HPI
- 332.57
- Rent YoY
- —
- Metro
- —
- State GDP YoY
- ▲ 3.95%
- F500 in state
- 110
Industry mix (Fortune 500 HQ in TX)
| Industry | F500 HQs | Revenue |
|---|---|---|
| Energy | 16 | $1,198B |
|
||
| Technology | 5 | $198B |
|
||
| Engineering / Construction | 4 | $72B |
|
||
| Energy Services | 3 | $60B |
|
||
| Utilities | 3 | $41B |
|
||
| Healthcare | 2 | $330B |
|
||
Price history
-8.0% since first listed5 events — show timeline
- 2026-05-07 Price Changed $92,000 NTREIS
- 2026-04-06 Listed $100,000 NTREIS
- 2011-01-25 Sold (Public Records) — Public Records
- 2006-10-11 Sold (Public Records) — Public Records
- 1989-02-01 Sold (Public Records) — Public Records
Property tax history
+2.7%/yrLatest (2025): $1,738 · +13.3% YoY. Source: county tax records.
Cash-flow waterfall
monthlySold comps — $/sqft
last 12 mo · ≤1 miLoading sold comps…