 🏷️ Likely Rental
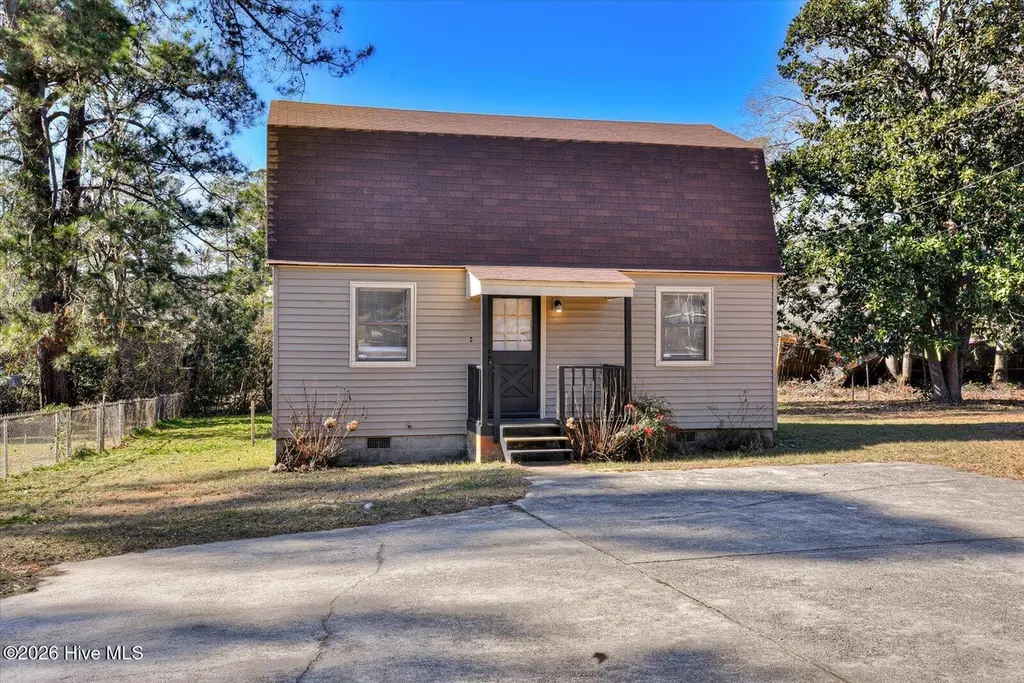
1813 Sibley Road A · Augusta-Richmond County consolidated government (balance), GA
Flood risk 1/10 · Minimal
- FEMA flood zone
- X (unshaded)
- Chance of flooding over 30 yrs
- 0.0%
- Est. flood insurance / yr
- $507 – $1,088
Fire risk 2/10 · Minimal
- Est. fire insurance / yr
- $963 – $1,789
Heat risk 7/10 · Major
- Hot days now (above 105°F)
- 7 days/yr
- Hot days in 30 yrs
- 17 days/yr
Wind risk 6/10 · Moderate
- Chance of severe wind over 30 yrs
- 64.0%
Air-quality risk 3/10 · Minor
- Unhealthy air days now
- 3 days/yr
- Unhealthy air days in 30 yrs
- 3 days/yr
Risk factors via First Street. Map © Google.
Why this score? — see what drove the D grade
The composite is a weighted blend of 9 inputs, each scored 0–100. Each bar is that input's sub-score; the figure is the points it added to the 100-point composite (weight × sub-score).
- ARV discount +15.0/15.0
- Cash flow +13.1/30.0
- DSCR +3.9/10.0
- 1% rule +3.5/10.0
- Rent growth +2.6/5.0
- Livability +2.5/5.0
- Condition / age +2.5/5.0
- Schools +1.3/10.0
- Appreciation +0.0/10.0
$109,998
🖨 Deal sheet (PDF) 📄 Offer letter ✓ Due diligence
Listing remarks
Welcome to 1813A Sibley Road, a charming and move-in-ready home located in the heart of Augusta's convenient West Augusta area. This 3-bedroom, 1 bath residence offers comfortable living with easy access to major highways, shopping, dining, and some of the areas largest employers. The home's practical layout and central location make it an excellent opportunity for first-time home buyers, military personnel, medical professionals, investors or anyone seeking affordable living close to everything Augusta has to offer. According to the owner, the property was previously rented for $1,250 per month, offering insight into its potential as an investment property. Buyers should independently veri
Key facts
- 0.28 acre lot
- Built 1981
- Listed 16 days
Property features AI
Finance
- Other: Pets allowed: dogs and cats; Zoning: R3; Lot roughly 0.28 acres (dimensions: 203.11 x 83.25 x 78.24 x 73.00); Subdivision: Wildwood
Exterior
- Parking: Concrete parking
- Utilities: Public water; Sewer connected; Water available; Electric service (implied by electric heating and appliances)
- Home design: Single-family residence; Two levels (2 stories); Entry level: 1; Vinyl siding
- Construction: Vinyl siding construction
- Exterior features: Shingle roof; Partial chain-link fencing; No patio or porch listed; Paved road access; Has a view
Interior
- Kitchen: Refrigerator; Electric range
- Bedrooms: Total of 5 rooms (bedrooms and living areas included)
- Bathrooms: 1 full bathroom
- Heating & cooling: Central air conditioning; Electric forced-air heating
- Interior features: Ceiling fan(s); Crawl space basement
- Laundry & utility: Washer hookup; Electric water heater
Neighborhood map
What this means for you Summary
Snapshot
- This is a 1-bed/1.0-bath single-family listed at $110k.
Deal economics
- At list price, monthly cash flow is $-5 ($-55/yr) — negative.
- To cash-flow at today's rent, offer at most $109k (0.7% below list).
- To meet the 1% rule (rent ≥ 1% of price), the offer needs to be $94k (14.7% below list).
- Recommended offer: $94k (14.7% below list) — sets the bar for 1% rule.
Location & tenants
- Location reads: area grade D — affects rentability + tenant quality, not the cash-flow math above.
- Richmond County (urban): math 12% / reading 20% proficiency, ranked #154 of 174 in GA (top 88%) — low school quality limits family demand, transient renter base, plan for 1-2y turnover; 72% free/reduced lunch — lower-income household profile, screen leases tightly.
- Zoned schools: Sue Reynolds Elementary School (math 8% / reading 22%, grade F, #988 of 1,228 statewide, top 81%, 655 students, 98% FRL); Langford Middle School (math 2% / reading 14%, grade F, #445 of 470 statewide, top 95%, 731 students, 98% FRL); Academy of Richmond County High School (math 2% / reading 17%, grade F, #365 of 424 statewide, top 88%, 1,141 students, 98% FRL) — zoned schools average 98% FRL vs 72% district-wide (26 pts higher); higher-poverty schools than district average — tighter screening recommended.
- Market conditions: Rents flat; 306 active listings in the ZIP; 17 comparable units currently listed for rent nearby; rentals at typical pace (median 25d on market — plan ~3-4 weeks tenant-placement turnaround); 561 units permitted in Richmond County in 2024 (0 in 5+ unit buildings).
- This rent is only 16% of the median local income ($71k/yr) — well below the 30% rent-burden line; pricing power to push rent on renewal without tenant pushback.
Forward outlook
- Local home prices are declining (-3.0%/yr); year-one equity from $760 of loan paydown is wiped out by about $3k of value loss. Plan a longer hold.
- Richmond County population projected to shrink 5% by 2050 — rents likely to lag national; underwrite the cash flow, not the appreciation.
Negotiation context
- It's been on market 16 days — a 2% lower offer ($108k) is reasonable based on typical stale-listing flexibility.
- 7 sale attempts since 2y ago with the ask held roughly flat each time — persistent listings suggest the price (not the market) is what's stuck; bring a comps-based counter.
Risks & watch-outs
- Climate carrying-cost: major wind risk, 64% chance of damaging wind over 30y; extreme-heat days projected 7→17/yr by 2055 (HVAC capex compounding) — expect insurance premiums to compound above CPI over the hold.
Questions for the listing agent
- What do current leases actually rent for vs. the listed asking? Can we see a recent rent roll and the last 12 months of T-12 income?
- Is there a deadline driving the sale (1031 exchange, divorce, estate, relocation)? That informs how much negotiation room exists.
- The area grade is low — what's the realistic commute time and amenity access for the typical tenant pool here? Any planned neighborhood developments (good or bad) we should know about?
- What's the average days-on-market for RENTAL listings here right now (not sales)? A rising rental-DOM trend means longer vacancies and softer asking-rent achievability than the comps imply.
- What's the recent tenant-quality profile in this submarket — average credit score on applications, eviction rate, late-payment / NSF rate, and stable-employment percentage? A property-management company in the area should have these aggregated.
- How much new for-sale + rental construction is in the pipeline within 1–3 miles? Heavy new supply typically softens prices + rents 12–24 months out; constrained supply supports both.
Investment metrics
- 1% rule
- 0.85% ✗
- Cap rate
- 6.24%
- Cash-on-cash
- -0.18%
- DSCR
- 0.99
- GRM
- 9.8
CMA / ARV
- ARV (on-the-fly)
- $143,080
- Comps found
- 2
Show comp detail 2 sales within ~0.75 mi
| Address | Dist | Beds/Ba | Sqft | Sold | Price | $/sf | Match |
|---|---|---|---|---|---|---|---|
| 1813 Sibley Rd | 0.00mi | 2/1.0 (+1) | 960 (-2%) | 14mo | $140,000 | $146 | 80 |
| 2134 Bayvale Rd | 0.68mi | 2/1.0 (+1) | 925 (-6%) | 24mo | $60,000 | $65 | 34 |
Match score weights: distance 35% · size 25% · config 20% · recency 20%. Top-matched comps best support the ARV.
Projected returns pro-forma
-3.0% appreciation · 0.48% rent growth · sell at horizon
- IRR
- -19.4%
- Equity multiple
- 0.34×
- Total profit
- $-20,432
- Equity at exit
- $16,401
- IRR
- -18.4%
- Equity multiple
- 0.12×
- Total profit
- $-27,199
- Equity at exit
- $9,511
Cash invested: $30,799 (down + closing). Projections, not guarantees.
Landlord ↔ Tenant lean methodology
- Overall (STATE)
- 90 Strongly Landlord-Friendly
- State Georgia
- 90 Strongly Landlord-Friendly · R+3
- County
- — inherits STATE
- City
- — inherits STATE
ZIP-level market 30909
- Home prices YoY
- -32.2%
- Rents YoY
- 0.5%
- Active inventory
- 306
- Price-to-rent
- 9.8×
Monthly cashflow live
- Estimated rent
- $938 high interval (Pro) →
- Mortgage (P&I)
- −$577
- Tax from tax record
- −$123 /mo · $1,476/yr
- Insurance
- −$46
- HOA
- −$0
- Vacancy / Maint / Mgmt
- −$197
- Net cashflow
- $-5
Break-even live
Sensitivity live
| Price | -10% $58 | -5% $27 | +0% $-5 | +5% $-36 | +10% $-67 |
|---|---|---|---|---|---|
| Rent | -10% $-79 | -5% $-42 | +0% $-5 | +5% $32 | +10% $70 |
| Rate | -1.0pp $51 | -0.5pp $23 | base $-5 | +0.5pp $-33 | +1.0pp $-62 |
UW: 25.0% down · 7.5% · 30yr · 1.5% tax · 5.0% vac · 8.0% maint · 8.0% mgmt
Financing live
Cash to close
- Down payment
- $27,500
- Closing costs
- $3,300
- Reserves months
- —
- Total cash needed
- —
Loan-product check · same deal, 3 products live
Conventional
25% down · 7.5% · 30yr
- Down + closing
- —
- Monthly P&I
- —
- Monthly cashflow
- —
- DSCR
- —
- Eligible?
- —
Personal DTI + credit; lowest rate.
DSCR
20% down · 8.5% · 30yr
- Down + closing
- —
- Monthly P&I
- —
- Monthly cashflow
- —
- DSCR
- —
- Eligible?
- —
No personal income docs; deal must DSCR.
Hard money
10% down · 12.0% · 12mo
- Down + closing
- —
- Monthly P&I
- —
- Monthly cashflow
- —
- DSCR
- —
- Eligible?
- —
Short-term bridge; refi at stabilization.
Rent comps 17 comps
| Address | Beds | Baths | Sqft | Rent | $/sqft | DOM | Units | Dist |
|---|---|---|---|---|---|---|---|---|
| 1811 Sibley Rd Augusta, GA | 1.0–2.0 | 1.0–2.0 | 820 | $949 | $1.16 | 15d | 12 | 0.06mi |
| 1730 Sibley Rd Augusta, GA | 1.0–2.0 | 1.0 | 750 | $720 | $0.96 | 25d | 1 | 0.21mi |
| 3232 Heritage Cir Augusta, GA | 1.0–2.0 | 1.0–2.0 | 820 | $940 | $1.15 | 15d | 8 | 0.48mi |
| 3211 Wrightsboro Rd Augusta, GA | 1.0–3.0 | 1.0–2.0 | 972 | $700 | $0.72 | 45d | 1 | 0.48mi |
| 1700 Valley Park Ct Augusta, GA | 1.0–3.0 | 1.0–2.0 | 957 | $895 | $0.93 | 45d | 7 | 0.49mi |
| 1700 Valley Park Ct Augusta, GA | 1.0–3.0 | 1.0–2.0 | 957 | $895 | $0.93 | 25d | 1 | 0.49mi |
| 237 Fox Trce Augusta, GA | 1.0–2.0 | 1.0 | 750 | $575 | $0.77 | 22d | 6 | 0.53mi |
| 1924 N Leg Rd Augusta, GA | 1.0–2.0 | 1.0 | 939 | $960 | $1.02 | 25d | 3 | 0.57mi |
| 1508 Wylds Ct Augusta, GA | 2.0 | 1.0–2.0 | 900 | $854 | $0.95 | 45d | 1 | 0.58mi |
| 3122 Damascus Rd Augusta, GA | 1.0–3.0 | 1.0–2.0 | 915 | $970 | $1.06 | 15d | 16 | 0.77mi |
| 1500 Champions Pines Ln Augusta, GA | 1.0–2.0 | 1.0–2.0 | 825 | $930 | $1.13 | 25d | 14 | 0.81mi |
| 3234 W Wimbledon Dr Augusta, GA | 2.0 | 1.0 | 984 | $1,125 | $1.14 | 25d | 1 | 1.07mi |
| 2506 Otter Run Unit 1305 Augusta, GA | 2.0 | 2.0 | 991 | $1,320 | $1.33 | 45d | 1 | 1.18mi |
| 1315 Marks Church Rd Augusta, GA | 1.0–2.0 | 2.0 | 944 | $1,150 | $1.22 | 15d | 6 | 1.19mi |
| 1311 Marks Church Rd Augusta, GA | 1.0 | 1.0 | 525 | $908 | $1.73 | 15d | 6 | 1.24mi |
| 2595 Kelly St Unit 1E Augusta, GA | 2.0 | 1.5 | 1000 | $900 | $0.90 | 25d | 1 | 1.50mi |
| 2595 Kelly St Unit A1 Augusta, GA | 2.0 | 1.0 | 1000 | $900 | $0.90 | 25d | 1 | 1.50mi |
Listing history 12 events
-
2026-06-21days on market $109,998 Active 16 DOM
-
2026-06-18days on market $109,998 Active 13 DOM
-
2026-06-17days on market $109,998 Active 12 DOM
-
2026-06-16days on market $109,998 Active 11 DOM
-
2026-06-15days on market $109,998 Active 10 DOM
-
2026-06-14days on market $109,998 Active 8 DOM
-
2026-06-10days on market $109,998 Active 5 DOM
-
2026-06-09remarks 699-char remark
-
2026-06-09pricedays on market $109,998 Active 4 DOM
-
2026-06-08days on market $109,999 Active 3 DOM
-
2026-06-07remarks 523-char remark
-
2026-06-07$109,999 Active 2 DOM
ⓘ Source: listings_history table (triggers on properties + properties_extension) + one-shot
backfill from property_details.listing_events for pre-trigger history.
Tax reassessment forecast GA · Resets to sale price
- Current annual tax
- $1,476 · $123/mo
- Projected year-2 tax
- $1,476 · $123/mo
- Expected delta
- $0/yr ($0/mo · 0.0%)
ⓘ Screening estimate from a state-policy table — verify with the county assessor before closing.
Climate risk First Street
- Flood 1/10 Low FEMA zone X (unshaded) · 0% chance over 30 yrs
- Wildfire 2/10 Low
- Heat 7/10 Severe 7 d/yr ≥105°F today · 17 d/yr by 30 yrs out
- Wind 6/10 Major 64% chance of damaging wind over 30 yrs
- Air quality 3/10 Moderate 3 unhealthy d/yr today · 3 by 30 yrs out
Nearby sold comps map
Loading sold comps map…
Walkable amenities ~0.75 mi
Loading nearby amenities…
Taxation est. · year 1
- Rental income
- $11,257
- − Mortgage interest
- −$6,162
- − Property taxes
- −$1,476
- − Insurance
- −$550
- − Repairs & maintenance
- −$901
- − Management
- −$901
- − Depreciation
- −$3,200
- Taxable loss
- −$1,932
- Est. tax savings @ 24.0%
- +$464
- After-tax cash flow
- $408/yr
For passive investors: Depreciation is non-cash, so a rental often shows a tax loss while cash-flowing — sheltering income. Rental losses are passive: they offset passive income freely, and up to $25,000/yr can offset ordinary (W-2) income if you actively participate and your MAGI is under $100k (phasing out to $0 by $150k); unused losses carry forward. On sale, claimed depreciation is recaptured at up to 25%, and gains may owe capital-gains tax (a 1031 exchange can defer both). Figures are a year-1 estimate at your 24.0% rate — not tax advice; consult a CPA.
Schools (NCES district)
- District
- Richmond County
- NCES district ID
- 1304380
- Math proficiency
- 12% ▼ -9.00%
- Reading proficiency
- 20% ▼ -6.00%
- Median HH income
- $38,069
- Composite
- 13.43/100
- National rank
- #9524
- State rank
- #154 of 174 in GA
Livability — Augusta-Richmond County consolidated government (balance)
No livability data for this city. (Only ~50 U.S. cities are tracked.)
Census & demographics
- Census place
- Augusta-Richmond County consolidated government (balance), GA
- County
- Richmond County · 190,917 people
- City population
- 154,035
- Metro
- Augusta-Richmond County, GA-SC
- Population (ZIP)
- 46,501
- Household income
- $71,364
- Rent vs Own
- Severe rent burden
- 2113.0
Population outlook (Richmond County) Hauer SSP2
- Today (2025)
- 200,753 people
- By 2030
- 200,232 · -0.3%
- By 2040
- 196,813 · -2.0%
- By 2050
- 190,347 · -5.2%
- By 2075
- 172,496 · -14.1%
- By 2100
- 146,284 · -27.1%
Race, ethnicity, and origin ACS 2023
- Neighborhood character
- Diverse neighborhood (Simpson 0.65)
- Race & ethnicity
- Black 44% White 39% Two or more races 9% Hispanic / Latino 6% Asian 3%
- Hispanic origin (detail)
- Mexican 3% Puerto Rican 2%
- Common ancestry
- Slovak 2% Serbian 1% Lithuanian 1%
- Foreign-born
- 6% · Canada, China, South Korea
- Languages at home
- 92% English-only · Spanish 3% Other Indo-European 1% Chinese 1%
Political lean MEDSL · Richmond
- 2024 margin
- Solid D (+36.1) · D 67.8% · R 31.7%
- 2008→2024 swing
- +4.3pp toward D · 2008: 31.8pp · 2024: 36.1pp
- All cycles
- 2024: D+36.1 2020: D+37.2 2016: D+32.4 2012: D+33.8 2008: D+31.8
Not yet ingested
- Civics
- —
Market trends
- HPI YoY
- ▼ -133.14%
- Current HPI
- 280.4587
- Rent YoY
- ▲ 0.48%
- Metro
- Augusta-Richmond County, GA-SC
- State GDP YoY
- ▲ 2.66%
- F500 in state
- 28
Industry mix (Fortune 500 HQ in GA)
| Industry | F500 HQs | Revenue |
|---|---|---|
| Paper / Packaging | 2 | $29B |
|
||
| Retail | 1 | $160B |
|
||
| Transportation / Logistics | 1 | $91B |
|
||
| Airlines | 1 | $62B |
|
||
| Consumer Goods | 1 | $47B |
|
||
| Utilities | 1 | $25B |
|
||
Price history
+10.0% since first listed15 events — show timeline
- 2026-06-05 Listed $109,999 Hive MLS
- 2026-05-16 Rental Removed $1,199 NCRMLS
- 2026-05-12 Listed for Rent $1,199 NCRMLS
- 2026-05-11 Rental Removed $1,199 NCRMLS
- 2026-04-26 Price Changed $1,199 NCRMLS
- 2026-03-26 Listed for Rent $1,250 NCRMLS
- 2025-03-27 Rental Removed $1,200 AUGUSTAMLS
- 2025-03-08 Listed for Rent $1,200 AUGUSTAMLS
- 2025-03-07 Listing Removed — Hive MLS
- 2025-03-07 Listing Removed — Hive MLS
- 2025-01-07 Listed $124,900 Hive MLS
- 2025-01-07 Listed $124,900 Hive MLS
- 2024-03-24 Rental Removed $1,195 BUILDIUM
- 2024-02-28 Listed for Rent $1,195 BUILDIUM
- 1996-02-01 Sold (Public Records) $100,000 Public Records
Property tax history
+4.4%/yrLatest (2025): $1,476 · +38.7% YoY. Source: county tax records.
Cash-flow waterfall
monthlySold comps — $/sqft
last 12 mo · ≤1 miLoading sold comps…