770 Jones Ave NW Lot L · Carrollton, OH
Flood risk 1/10 · Minimal
- FEMA flood zone
- X (unshaded)
- Chance of flooding over 30 yrs
- 0.0%
- Est. flood insurance / yr
- $507 – $1,088
Fire risk 1/10 · Minimal
- Est. fire insurance / yr
- $713 – $1,323
Heat risk 3/10 · Minor
- Hot days now (above 96°F)
- 7 days/yr
- Hot days in 30 yrs
- 17 days/yr
Wind risk 1/10 · Minimal
- Chance of severe wind over 30 yrs
- —
Air-quality risk 2/10 · Minimal
- Unhealthy air days now
- 0 days/yr
- Unhealthy air days in 30 yrs
- 1 days/yr
Risk factors via First Street. Map © Google.
Why this score? — see what drove the B grade
The composite is a weighted blend of 9 inputs, each scored 0–100. Each bar is that input's sub-score; the figure is the points it added to the 100-point composite (weight × sub-score).
- Cash flow +30.0/30.0
- 1% rule +10.0/10.0
- DSCR +10.0/10.0
- ARV discount +7.5/15.0
- Schools +4.4/10.0
- Livability +4.0/5.0
- Condition / age +4.0/5.0
- Rent growth +2.5/5.0
- Appreciation +0.0/10.0
$55,000
🖨 Deal sheet 📄 Offer letter ✓ Due diligence
Listing remarks
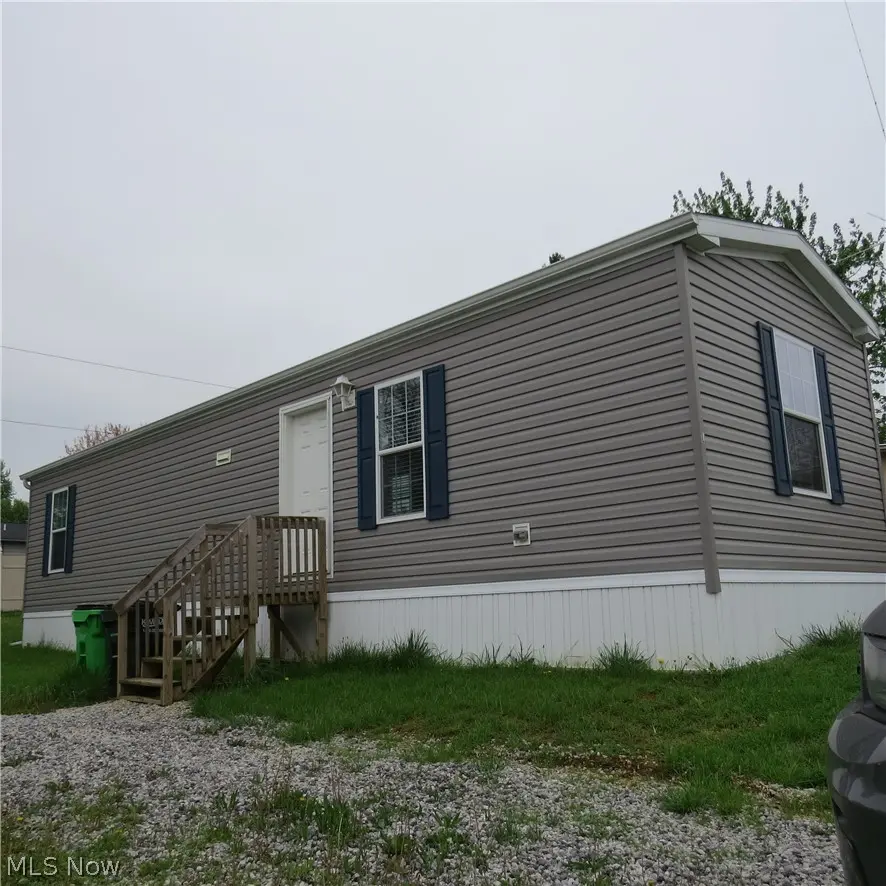
Don’t miss this stunning 2-bedroom, 1-bath mobile home, built in 2024 and in like-new condition! This cozy 14x48 residence features a modern drywall interior, giving it a clean, polished feel throughout. Enjoy the convenience of an all-electric setup, with the stove and refrigerator included, plus washer and dryer hookups for added ease. This home also offers dedicated off-street parking and includes an 8x10 shed for extra storage space. Whether you're looking for a low-maintenance home or a smart investment, this one is a must-see! Please note: this sale is for the mobile home only, and does not include real estate. Sale is subject to a one-year lease; the home must remain on its
Key facts
- 4,356 sq ft lot
- Built 2024
- Listed 50 days
Property features AI
Finance
- Financial info: Land lease: $300 (as listed)
Exterior
- Parking: Gravel parking
- Utilities: Public water; Public sewer
- Home design: Single-story home
- Construction: Shingle roof; Built per public records
- Exterior features: Vinyl siding; Shed(s)
Interior
- Kitchen: Range; Refrigerator
- Bedrooms: 2 main-level bedrooms
- Bathrooms: 1 full bathroom on the main level
- Interior features: Central air conditioning; Electric forced-air heating
Neighborhood map
What this means for you Summary
Snapshot
- This is a 2-bed/1.0-bath single-family listed at $55k. Condition is rated good.
Deal economics
- At list price, monthly cash flow is $822 ($10k/yr) — positive.
- The deal already cash-flows at list — no discount required.
- Meets the 1% rule at list price ($2k rent vs $55k).
- Recommended offer: $53k (3.0% below list) — sets the bar for market timing.
- Cap rate 24.2% vs local median 4.7% in Carrollton — top-decile yield for the area; either an underpriced asset or a hidden risk that comps aren't pricing in. Stress-test before assuming the spread holds.
Location & tenants
- Location reads 80/100 on livability (#131 in OH, #1,863 nationally) — a professional / high-income tenant draw. Strengths: crime A+, cost of living A+, housing A+; Watch: amenities F, commute F.
- Carrollton Exempted Village (town): math 46% / reading 58% proficiency, ranked #419 of 656 in OH (top 64%) — acceptable for families but not a draw, mixed tenant base, ~2y average lease.
- Market conditions: 43 active listings in the ZIP; 2 units permitted in Carroll County in 2024 (0 in 5+ unit buildings).
Forward outlook
- Local home prices are declining (-3.0%/yr); year-one equity from $380 of loan paydown is wiped out by about $2k of value loss. Plan a longer hold.
- Carroll County population projected at -25% by 2050 — secular population decline; favor cash flow + early exit over multi-decade hold.
- At projected returns (-3.0% appreciation + 3.0% rent growth), your $15k cash investment doubles in ~2 years — after that, you're playing with house money.
Negotiation context
- It's been on market 51 days — a 3% lower offer ($53k) is reasonable based on typical stale-listing flexibility.
Questions for the listing agent
- It's been on market 51 days. Have you received any prior offers? Is the seller open to a 3% concession, seller financing, or rate buy-down credit?
- Is there a deadline driving the sale (1031 exchange, divorce, estate, relocation)? That informs how much negotiation room exists.
- Schools are A-rated — typically a magnet for longer-tenancy family renters. What's the average tenant stay here, and is there a school-zone premium baked into asking?
- What's the average days-on-market for RENTAL listings here right now (not sales)? A rising rental-DOM trend means longer vacancies and softer asking-rent achievability than the comps imply.
- What's the recent tenant-quality profile in this submarket — average credit score on applications, eviction rate, late-payment / NSF rate, and stable-employment percentage? A property-management company in the area should have these aggregated.
- How much new for-sale + rental construction is in the pipeline within 1–3 miles? Heavy new supply typically softens prices + rents 12–24 months out; constrained supply supports both.
Investment metrics
- 1% rule
- 2.77% ✓
- Cap rate
- 24.22%
- Cash-on-cash
- 64.03%
- DSCR
- 3.85
- GRM
- 3.0
CMA / ARV
- ARV (median comp)
- $131,675
- List price
- $55,000
- Delta
- -58.23%
- Verdict
- UNDERPRICED
- Comps
- 5 within 1.0 mi
Show comp detail 1 sale within ~0.75 mi
| Address | Dist | Beds/Ba | Sqft | Sold | Price | $/sf | Match |
|---|---|---|---|---|---|---|---|
| 242 Mckinley Ave NW | 0.38mi | 2/1.0 | 592 (-12%) | 15mo | $77,000 | $130 | 50 |
Match score weights: distance 35% · size 25% · config 20% · recency 20%. Top-matched comps best support the ARV.
Projected returns pro-forma
-3.0% appreciation · 3.0% rent growth · sell at horizon
- IRR
- 63.1%
- Equity multiple
- 3.82×
- Total profit
- $43,449
- Equity at exit
- $8,201
- IRR
- 67.6%
- Equity multiple
- 7.84×
- Total profit
- $105,322
- Equity at exit
- $4,755
Cash invested: $15,400 (down + closing). Projections, not guarantees.
Landlord ↔ Tenant lean methodology
- Overall (STATE)
- 73 Landlord-Friendly
- State Ohio
- 73 Landlord-Friendly · R+6
- County
- — inherits STATE
- City
- — inherits STATE
ZIP-level market 44615
- Active inventory
- 43
- Price-to-rent
- 3.0×
Monthly cashflow live
- Estimated rent
- $1,521 medium interval (Pro) →
- Mortgage (P&I)
- −$288
- Tax est. 1.5%
- −$69 /mo · $825/yr
- Insurance
- −$23
- HOA
- −$0
- Vacancy / Maint / Mgmt
- −$319
- Net cashflow
- $822
Break-even live
UW: 25.0% down · 7.5% · 30yr · 1.5% tax · 5.0% vac · 8.0% maint · 8.0% mgmt
Financing live
Cash to close
- Down payment
- $13,750
- Closing costs
- $1,650
- Reserves months
- —
- Total cash needed
- —
Loan-product check · same deal, 3 products live
Conventional
25% down · 7.5% · 30yr
- Down + closing
- —
- Monthly P&I
- —
- Monthly cashflow
- —
- DSCR
- —
- Eligible?
- —
Personal DTI + credit; lowest rate.
DSCR
20% down · 8.5% · 30yr
- Down + closing
- —
- Monthly P&I
- —
- Monthly cashflow
- —
- DSCR
- —
- Eligible?
- —
No personal income docs; deal must DSCR.
Hard money
10% down · 12.0% · 12mo
- Down + closing
- —
- Monthly P&I
- —
- Monthly cashflow
- —
- DSCR
- —
- Eligible?
- —
Short-term bridge; refi at stabilization.
Listing history 15 events
-
2026-06-18days on market $55,000 Active 51 DOM
-
2026-06-17days on market $55,000 Active 50 DOM
-
2026-06-16days on market $55,000 Active 49 DOM
-
2026-06-15days on market $55,000 Active 48 DOM
-
2026-06-13days on market $55,000 Active 46 DOM
-
2026-06-12days on market $55,000 Active 45 DOM
-
2026-06-09days on market $55,000 Active 42 DOM
-
2026-06-08days on market $55,000 Active 41 DOM
-
2026-06-07days on market $55,000 Active 40 DOM
-
2026-06-07days on market $55,000 Active 39 DOM
-
2026-06-04days on market $55,000 Active 36 DOM
-
2026-06-02days on market $55,000 Active 35 DOM
-
2026-06-01days on market $55,000 Active 34 DOM
-
2026-05-31days on market $55,000 Active 33 DOM
-
2026-04-27$55,000 Active 761-char remark
ⓘ Source: listings_history table (triggers on properties + properties_extension) + one-shot
backfill from property_details.listing_events for pre-trigger history.
Climate risk First Street
- Flood 1/10 Low FEMA zone X (unshaded) · 0% chance over 30 yrs
- Wildfire 1/10 Low
- Heat 3/10 Moderate 7 d/yr ≥96°F today · 17 d/yr by 30 yrs out
- Wind 1/10 Low
- Air quality 2/10 Low 0 unhealthy d/yr today · 1 by 30 yrs out
Nearby sold comps map
Loading sold comps map…
Walkable amenities ~0.75 mi
Loading nearby amenities…
Taxation est. · year 1
- Rental income
- $18,256
- − Mortgage interest
- −$3,081
- − Property taxes
- −$825
- − Insurance
- −$275
- − Repairs & maintenance
- −$1,460
- − Management
- −$1,460
- − Depreciation
- −$1,600
- Taxable income
- $9,554
- Est. tax owed @ 24.0%
- −$2,293
- After-tax cash flow
- $7,568/yr
For passive investors: Depreciation is non-cash, so a rental often shows a tax loss while cash-flowing — sheltering income. Rental losses are passive: they offset passive income freely, and up to $25,000/yr can offset ordinary (W-2) income if you actively participate and your MAGI is under $100k (phasing out to $0 by $150k); unused losses carry forward. On sale, claimed depreciation is recaptured at up to 25%, and gains may owe capital-gains tax (a 1031 exchange can defer both). Figures are a year-1 estimate at your 24.0% rate — not tax advice; consult a CPA.
Condition & rehab AI · 13 photos
This mobile home is in good condition with a modern kitchen and a well-maintained exterior. It is a low-maintenance property with a good curb appeal.
Value-add opportunities
- Resale Painting the exterior siding — Fresh paint can enhance the curb appeal and make the home look more inviting to potential buyers.
- Rental Landscaping improvements — Well-maintained landscaping can attract tenants and make the home more appealing.
Renovation cost estimate screening
Value-add ROI direction
- Resale Painting the exterior siding — Fresh paint can enhance the curb appeal and make the home look more inviting to potential buyers. ↑
- Rental Landscaping improvements — Well-maintained landscaping can attract tenants and make the home more appealing. ↑
ⓘ Cost ranges are severity-bucket heuristics (US national rule-of-thumb). Get contractor quotes + a written scope before underwriting a rehab budget.
Schools (NCES district)
- District
- Carrollton Exempted Village
- NCES district ID
- 3904527
- Math proficiency
- 46% ▼ -21.00%
- Reading proficiency
- 58% ▼ -10.00%
- Median HH income
- $45,165
- Composite
- 43.94/100
- National rank
- #2903
- State rank
- #419 of 656 in OH
Livability — Carrollton
- Score
- 80/100
- State rank
- #131
- US rank
- #1863
Category grades
Schools grade is shown separately in the Schools card above.
Census & demographics
- Census place
- Carrollton, OH
- County
- Carroll · 27,595 people
- Metro
- Canton-Massillon, OH
- Population (ZIP)
- 9,830
- Household income
- $66,391
- Rent vs Own
- Severe rent burden
- 7.5
Population outlook (Carroll County) Hauer SSP2
- Today (2025)
- 25,766 people
- By 2030
- 24,481 · -5.0%
- By 2040
- 21,803 · -15.4%
- By 2050
- 19,323 · -25.0%
- By 2075
- 15,205 · -41.0%
- By 2100
- 12,287 · -52.3%
Race, ethnicity, and origin ACS 2023
- Neighborhood character
- Predominantly White (96%)
- Race & ethnicity
- White 96% Two or more races 3% Hispanic / Latino 2%
- Common ancestry
- Slovak 4% Iranian 3% Romanian 2%
- Foreign-born
- 0% · Canada
- Languages at home
- 92% English-only · German/W. Germanic 6% Spanish 1% Other Indo-European 1%
Political lean MEDSL · Carroll
- 2024 margin
- Solid R (+54.7) · D 22.2% · R 77.0%
- 2008→2024 swing
- -49.9pp toward R · 2008: -4.8pp · 2024: -54.7pp
- All cycles
- 2024: R+54.7 2020: R+52.7 2016: R+46.4 2012: R+13.7 2008: R+4.8
Not yet ingested
- Civics
- —
Market trends
- HPI YoY
- ▼ -129.95%
- Current HPI
- 222.0728
- Rent YoY
- —
- Metro
- —
- State GDP YoY
- ▲ 1.98%
- F500 in state
- 48
Industry mix (Fortune 500 HQ in OH)
| Industry | F500 HQs | Revenue |
|---|---|---|
| Insurance | 3 | $145B |
|
||
| Industrial Machinery | 3 | $49B |
|
||
| Financial Services | 3 | $24B |
|
||
| Consumer Goods | 2 | $93B |
|
||
| Aerospace / Defense | 2 | $47B |
|
||
| Utilities | 2 | $33B |
|
||
Price history
1 event — show timeline
- 2026-04-27 Listed $55,000 MLSNOW
Cash-flow waterfall
monthlySold comps — $/sqft
last 12 mo · ≤1 miLoading sold comps…