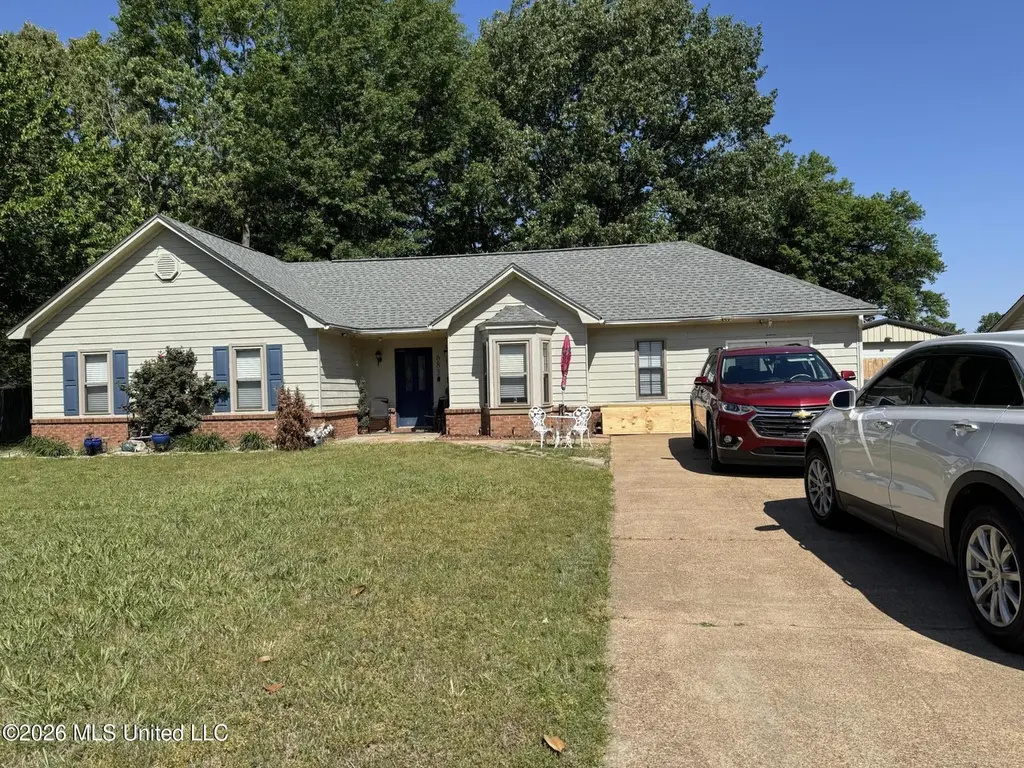
6830 Slash Pine Dr · Lynchburg, MS
Flood risk 1/10 · Minimal
- FEMA flood zone
- X (unshaded)
- Chance of flooding over 30 yrs
- 0.0%
- Est. flood insurance / yr
- $507 – $1,088
Fire risk 4/10 · Minor
- Est. fire insurance / yr
- $1,241 – $2,305
Heat risk 6/10 · Moderate
- Hot days now (above 109°F)
- 7 days/yr
- Hot days in 30 yrs
- 21 days/yr
Wind risk 4/10 · Minor
- Chance of severe wind over 30 yrs
- 20.0%
Air-quality risk 2/10 · Minimal
- Unhealthy air days now
- 2 days/yr
- Unhealthy air days in 30 yrs
- 2 days/yr
Risk factors via First Street. Map © Google.
Why this score? — see what drove the C grade
The composite is a weighted blend of 9 inputs, each scored 0–100. Each bar is that input's sub-score; the figure is the points it added to the 100-point composite (weight × sub-score).
- Cash flow +17.8/30.0
- Appreciation +10.0/10.0
- ARV discount +7.9/15.0
- DSCR +5.6/10.0
- Schools +4.0/10.0
- 1% rule +3.6/10.0
- Livability +3.2/5.0
- Rent growth +2.5/5.0
- Condition / age +2.5/5.0
$215,000
🖨 Deal sheet 📄 Offer letter ✓ Due diligence
Listing remarks MLS
priced to sell, very nice, well maintained home,large eat in kitchen, great family room with woodburning fireplace, freshly painted inside and out, new carpet and flooring, new windows, new garbage disposal, refrigerator to remain, new automatic garage door, ac only 2 years old, security system, large fenced yard with patio and dog run in back, well maintained landscaping, well estabilshed neighborhood, a must see for this price.
Key facts
- 0.34 acre lot
- Built 1989
Neighborhood map
What this means for you Summary
Snapshot
- This is a 3-bed/2.0-bath single-family listed at $215k.
Deal economics
- At list price, monthly cash flow is $176 ($2k/yr) — positive.
- The deal already cash-flows at list — no discount required.
- To meet the 1% rule (rent ≥ 1% of price), the offer needs to be $185k (14.0% below list).
- Recommended offer: $185k (14.0% below list) — sets the bar for 1% rule.
- Cap rate 7.3% vs local median 3.9% in Lynchburg — top-decile yield for the area; either an underpriced asset or a hidden risk that comps aren't pricing in. Stress-test before assuming the spread holds.
Location & tenants
- Location reads 63/100 on livability (#145 in MS) — a middle-class / working-renter tenant base. Strengths: crime A+, cost of living A+, housing A+; Watch: amenities F, commute F, health & safety F.
- Desoto County School District (suburban): math 48% / reading 42% proficiency, ranked #20 of 130 in MS (top 15%) — families likely to look elsewhere, expect single-tenant / working-renter base with shorter leases.
- Zoned schools: Lake Cormorant Elementary (math 48% / reading 55%, grade C-, #56 of 375 statewide, top 15%, 647 students, 100% FRL); Lake Cormorant Middle (math 51% / reading 30%, grade F, #60 of 179 statewide, top 37%, 764 students, 100% FRL); Lake Cormorant High (math 29% / reading 42%, grade F, #66 of 197 statewide, top 34%, 969 students, 100% FRL) — zoned schools average 100% FRL vs 43% district-wide (56 pts higher); higher-poverty schools than district average — tighter screening recommended.
- Market conditions: 51 active listings in the ZIP; 11 comparable units currently listed for rent nearby; rentals at typical pace (median 20d on market — plan ~3-4 weeks tenant-placement turnaround); 1,155 units permitted in DeSoto County in 2024 (0 in 5+ unit buildings).
- This rent runs 37% of the median local income ($60k/yr) — at the standard rent-burdened threshold; future hikes will face affordability resistance.
Forward outlook
- In year one you build about $23k of equity ($1k loan paydown + $22k appreciation (10.0% local appreciation)).
- DeSoto County population projected at +33% by 2050 — long-run rental-demand tailwind backs the buy-and-hold thesis.
- At projected returns (10.0% appreciation + 3.0% rent growth), your $60k cash investment doubles in ~3 years — after that, you're playing with house money.
- By year 2, paydown + projected appreciation supports a ~$37k cash-out refi (75% LTV) — recoverable capital for the next deal without selling this one.
Negotiation context
- Only 1 days on market — expect competitive offers; lowballing is unlikely to land.
- 3 sale attempts since 21y ago with the ask held roughly flat each time — persistent listings suggest the price (not the market) is what's stuck; bring a comps-based counter.
Risks & watch-outs
- Climate carrying-cost: extreme-heat days projected 7→21/yr by 2055 (HVAC capex compounding) — expect insurance premiums to compound above CPI over the hold.
Questions for the listing agent
- Is there a deadline driving the sale (1031 exchange, divorce, estate, relocation)? That informs how much negotiation room exists.
- Schools are F-rated, which usually means shorter tenancies and higher turnover. Who's the typical renter profile here, and what's been the actual vacancy rate?
- What's the average days-on-market for RENTAL listings here right now (not sales)? A rising rental-DOM trend means longer vacancies and softer asking-rent achievability than the comps imply.
- What's the recent tenant-quality profile in this submarket — average credit score on applications, eviction rate, late-payment / NSF rate, and stable-employment percentage? A property-management company in the area should have these aggregated.
- How much new for-sale + rental construction is in the pipeline within 1–3 miles? Heavy new supply typically softens prices + rents 12–24 months out; constrained supply supports both.
Investment metrics
- 1% rule
- 0.86% ✗
- Cap rate
- 7.27%
- Cash-on-cash
- 3.50%
- DSCR
- 1.16
- GRM
- 9.7
CMA / ARV
- ARV (on-the-fly)
- $216,975
- Comps found
- 8
Show comp detail 8 sales within ~0.75 mi
| Address | Dist | Beds/Ba | Sqft | Sold | Price | $/sf | Match |
|---|---|---|---|---|---|---|---|
| 6933 Fox Briar Cv | 0.14mi | 3/1.0 | 1,362 (+4%) | 11mo | $225,000 | $165 | 74 |
| 7350 Bramble Ln | 0.13mi | 3/2.0 | 1,335 (+2%) | 23mo | $215,000 | $161 | 72 |
| 7180 Black Oak Dr | 0.25mi | 3/2.0 | 1,340 (+2%) | 20mo | $235,000 | $175 | 69 |
| 6720 Black Thorn Dr | 0.09mi | 3/2.0 | 1,434 (+9%) | 15mo | $229,900 | $160 | 68 |
| 6949 Black Oak Dr | 0.26mi | 3/2.5 | 1,422 (+8%) | 10mo | $235,000 | $165 | 64 |
| 7051 Thornwood Cv | 0.16mi | 3/2.0 | 1,506 (+14%) | 14mo | $259,000 | $172 | 57 |
| 6915 Slash Pine Dr | 0.10mi | 3/2.0 | 1,509 (+15%) | 18mo | $259,000 | $172 | 56 |
| 7020 Hickory Estates Dr | 0.54mi | 3/2.0 | 1,472 (+12%) | 23mo | $239,900 | $163 | 36 |
Match score weights: distance 35% · size 25% · config 20% · recency 20%. Top-matched comps best support the ARV.
Projected returns pro-forma
10.0% appreciation · 3.0% rent growth · sell at horizon
- IRR
- 26.8%
- Equity multiple
- 3.13×
- Total profit
- $128,180
- Equity at exit
- $193,689
- IRR
- 23.4%
- Equity multiple
- 7.12×
- Total profit
- $368,488
- Equity at exit
- $417,698
Cash invested: $60,200 (down + closing). Projections, not guarantees.
Landlord ↔ Tenant lean methodology
- Overall (STATE)
- 90 Strongly Landlord-Friendly
- State Mississippi
- 90 Strongly Landlord-Friendly · R+11
- County
- — inherits STATE
- City
- — inherits STATE
ZIP-level market 38680
- Home prices YoY
- 4.6%
- Active inventory
- 51
- Price-to-rent
- 9.7×
Monthly cashflow live
- Estimated rent
- $1,849 high interval (Pro) →
- Mortgage (P&I)
- −$1,127
- Tax from tax record
- −$68 /mo · $815/yr
- Insurance
- −$90
- HOA
- −$0
- Vacancy / Maint / Mgmt
- −$388
- Net cashflow
- $176
Break-even live
UW: 25.0% down · 7.5% · 30yr · 1.5% tax · 5.0% vac · 8.0% maint · 8.0% mgmt
Financing live
Cash to close
- Down payment
- $53,750
- Closing costs
- $6,450
- Reserves months
- —
- Total cash needed
- —
Loan-product check · same deal, 3 products live
Conventional
25% down · 7.5% · 30yr
- Down + closing
- —
- Monthly P&I
- —
- Monthly cashflow
- —
- DSCR
- —
- Eligible?
- —
Personal DTI + credit; lowest rate.
DSCR
20% down · 8.5% · 30yr
- Down + closing
- —
- Monthly P&I
- —
- Monthly cashflow
- —
- DSCR
- —
- Eligible?
- —
No personal income docs; deal must DSCR.
Hard money
10% down · 12.0% · 12mo
- Down + closing
- —
- Monthly P&I
- —
- Monthly cashflow
- —
- DSCR
- —
- Eligible?
- —
Short-term bridge; refi at stabilization.
Rent comps 11 comps
| Address | Beds | Baths | Sqft | Rent | $/sqft | DOM | Units | Dist |
|---|---|---|---|---|---|---|---|---|
| 6915 Black Thorn Dr Walls, MS | 4.0 | 2.0 | 1382 | $1,655 | $1.20 | 4d | 1 | 0.08mi |
| 6757 River Birch Rd Walls, MS | 3.0 | 2.0 | 1331 | $1,720 | $1.29 | 11d | 1 | 0.12mi |
| 6916 Fox Briar Cv Walls, MS | 3.0 | 2.0 | 1350 | $1,600 | $1.19 | 4d | 1 | 0.12mi |
| 7051 Lake Forest Dr N Walls, MS | 3.0 | 2.0 | 1551 | $1,595 | $1.03 | 43d | 1 | 0.21mi |
| 7787 Bailee Ln Walls, MS | 4.0 | 2.0 | 1700 | $2,000 | $1.18 | 43d | 1 | 0.56mi |
| 6670 Tangleberry Cv Walls, MS | 3.0 | 2.0 | 1600 | $1,770 | $1.11 | 20d | 1 | 0.72mi |
| 6205 Liberty Estates Dr Walls, MS | 3.0 | 2.0 | 1357 | $1,555 | $1.15 | 4d | 1 | 0.79mi |
| 5968 Shannon Dr Horn Lake, MS | 3.0 | 2.0 | 1374 | $1,650 | $1.20 | 20d | 1 | 0.87mi |
| 5859 Shannon Dr Horn Lake, MS | 3.0 | 2.0 | 1139 | $1,523 | $1.34 | 43d | 1 | 0.98mi |
| 7782 Emeline Dr Horn Lake, MS | 4.0 | 2.5 | 1808 | $2,265 | $1.25 | 43d | 1 | 1.19mi |
| 5565 Chapel Hill Dr Horn Lake, MS | 3.0 | 2.0 | 1114 | $1,543 | $1.39 | 1d | 1 | 1.27mi |
Listing history 8 events
-
2026-04-20status Pending
-
2026-04-20$215,000 Active
-
2007-11-18historical
-
2007-05-22$126,985
-
2005-11-23soldstatus
-
2005-09-30soldstatus
-
2005-09-29soldstatus 433-char remark
Show marketing remark (433 chars)
priced to sell, very nice, well maintained home,large eat in kitchen, great family room with woodburning fireplace, freshly painted inside and out, new carpet and flooring, new windows, new garbage disposal, refrigerator to remain, new automatic garage door, ac only 2 years old, security system, large fenced yard with patio and dog run in back, well maintained landscaping, well estabilshed neighborhood, a must see for this price.
-
2005-08-10$115,000 433-char remark
Show marketing remark (433 chars)
priced to sell, very nice, well maintained home,large eat in kitchen, great family room with woodburning fireplace, freshly painted inside and out, new carpet and flooring, new windows, new garbage disposal, refrigerator to remain, new automatic garage door, ac only 2 years old, security system, large fenced yard with patio and dog run in back, well maintained landscaping, well estabilshed neighborhood, a must see for this price.
ⓘ Source: listings_history table (triggers on properties + properties_extension) + one-shot
backfill from property_details.listing_events for pre-trigger history.
Tax reassessment forecast MS · Resets to sale price
- Current annual tax
- $815 · $68/mo
- Projected year-2 tax
- $1,699 · $142/mo
- Expected delta
- +$883/yr (+$74/mo · 108.3%)
ⓘ Screening estimate from a state-policy table — verify with the county assessor before closing.
Climate risk First Street
- Flood 1/10 Low FEMA zone X (unshaded) · 0% chance over 30 yrs
- Wildfire 4/10 Moderate
- Heat 6/10 Major 7 d/yr ≥109°F today · 21 d/yr by 30 yrs out
- Wind 4/10 Moderate 20% chance of damaging wind over 30 yrs
- Air quality 2/10 Low 2 unhealthy d/yr today · 2 by 30 yrs out
Nearby sold comps map
Loading sold comps map…
Walkable amenities ~0.75 mi
Loading nearby amenities…
Taxation est. · year 1
- Rental income
- $22,186
- − Mortgage interest
- −$12,043
- − Property taxes
- −$815
- − Insurance
- −$1,075
- − Repairs & maintenance
- −$1,775
- − Management
- −$1,775
- − Depreciation
- −$6,255
- Taxable loss
- −$1,552
- Est. tax savings @ 24.0%
- +$373
- After-tax cash flow
- $2,479/yr
For passive investors: Depreciation is non-cash, so a rental often shows a tax loss while cash-flowing — sheltering income. Rental losses are passive: they offset passive income freely, and up to $25,000/yr can offset ordinary (W-2) income if you actively participate and your MAGI is under $100k (phasing out to $0 by $150k); unused losses carry forward. On sale, claimed depreciation is recaptured at up to 25%, and gains may owe capital-gains tax (a 1031 exchange can defer both). Figures are a year-1 estimate at your 24.0% rate — not tax advice; consult a CPA.
Schools (NCES district)
- District
- Desoto County School District
- NCES district ID
- 2801320
- Math proficiency
- 48% ▼ -13.00%
- Reading proficiency
- 42% ▼ -6.00%
- Median HH income
- $59,272
- Composite
- 39.56/100
- National rank
- #3933
- State rank
- #20 of 130 in MS
Livability — Lynchburg
- Score
- 63/100
- State rank
- #145
- US rank
- #14967
Category grades
Schools grade is shown separately in the Schools card above.
Census & demographics
- Census place
- Lynchburg, MS
- County
- DeSoto County · 176,513 people
- Metro
- Memphis, TN-MS-AR
- Population (ZIP)
- 6,839
- Household income
- $59,503
- Rent vs Own
- Severe rent burden
- 229.0
Population outlook (DeSoto County) Hauer SSP2
- Today (2025)
- 203,338 people
- By 2030
- 217,692 · +7.1%
- By 2040
- 245,320 · +20.6%
- By 2050
- 270,133 · +32.8%
- By 2075
- 323,341 · +59.0%
- By 2100
- 348,742 · +71.5%
Race, ethnicity, and origin ACS 2023
- Neighborhood character
- Diverse neighborhood (Simpson 0.60)
- Race & ethnicity
- Black 46% White 42% Hispanic / Latino 8% Two or more races 3% Native American 1% Asian 1%
- Hispanic origin (detail)
- Mexican 6%
- Common ancestry
- Romanian 1% Serbian 1% British 1%
- Foreign-born
- 4% · Canada
- Languages at home
- 93% English-only · Spanish 6%
Political lean MEDSL · DeSoto
- 2024 margin
- Strong R (+24.1) · D 36.7% · R 60.8% · Other 2.5%
- 2008→2024 swing
- +14.2pp toward D · 2008: -38.2pp · 2024: -24.1pp
- All cycles
- 2024: R+24.1 2020: R+23.9 2016: R+34.8 2012: R+33.5 2008: R+38.2
Not yet ingested
- Civics
- —
Market trends
- HPI YoY
- ▲ 10.29%
- Current HPI
- 232.28
- Rent YoY
- —
- Metro
- Memphis, TN-MS-AR
- State GDP YoY
- —
- F500 in state
- 0
Price history
+87.0% since first listed8 events — show timeline
- 2026-04-20 Pending — MLSU
- 2026-04-20 Listed $215,000 MLSU
- 2007-11-18 Listing Removed — MLSU
- 2007-05-22 Listed $126,985 MLSU
- 2005-11-23 Sold (Public Records) — Public Records
- 2005-09-30 Sold (Public Records) — Public Records
- 2005-09-29 Sold (MLS) — MLSU
- 2005-08-10 Listed $115,000 MLSU
Property tax history
+2.3%/yrLatest (2025): $815 · +18.0% YoY. Source: county tax records.
Cash-flow waterfall
monthlySold comps — $/sqft
last 12 mo · ≤1 miLoading sold comps…