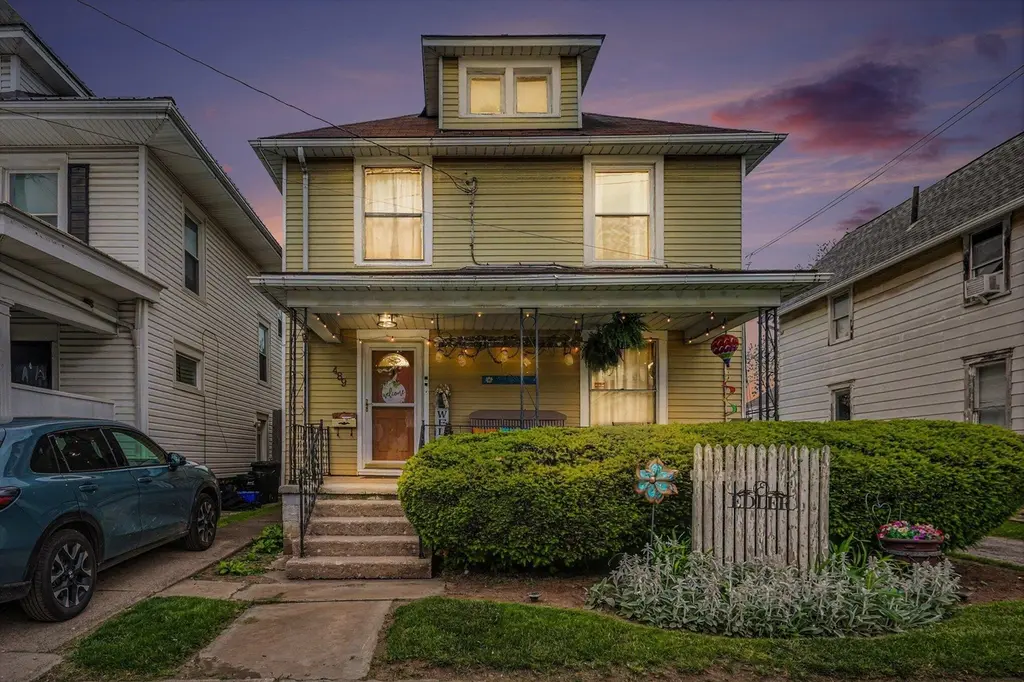
489 S Prospect St · Marion, OH
Flood risk 1/10 · Minimal
- FEMA flood zone
- X (unshaded)
- Chance of flooding over 30 yrs
- 0.0%
- Est. flood insurance / yr
- $473 – $860
Fire risk 1/10 · Minimal
- Est. fire insurance / yr
- $713 – $1,323
Heat risk 3/10 · Minor
- Hot days now (above 100°F)
- 7 days/yr
- Hot days in 30 yrs
- 18 days/yr
Wind risk 2/10 · Minimal
- Chance of severe wind over 30 yrs
- —
Air-quality risk 2/10 · Minimal
- Unhealthy air days now
- 1 days/yr
- Unhealthy air days in 30 yrs
- 1 days/yr
Risk factors via First Street. Map © Google.
Why this score? — see what drove the D- grade
The composite is a weighted blend of 9 inputs, each scored 0–100. Each bar is that input's sub-score; the figure is the points it added to the 100-point composite (weight × sub-score).
- Cash flow +16.8/30.0
- DSCR +5.2/10.0
- 1% rule +3.7/10.0
- Livability +3.2/5.0
- Rent growth +2.5/5.0
- Condition / age +2.5/5.0
- ARV discount +2.4/15.0
- Schools +2.2/10.0
- Appreciation +0.0/10.0
$189,900
🖨 Deal sheet (PDF) 📄 Offer letter ✓ Due diligence
Listing remarks
This charming 1920s residence offers the perfect blend of historical character and long-term pride of ownership. Meticulously maintained by the same family for over 40 years, this spacious two-story home is ready for its next chapter. Situated just minutes from the dining, shopping, and entertainment of downtown Marion, it combines classic architecture with an unbeatable location. Step inside to find a functional layout featuring four bedrooms and a full bathroom. The interior highlights the solid craftsmanship of its era, providing a warm and inviting atmosphere. The property offers incredible versatility with a massive unfinished attic and a full basement for storage or a workshop. Outdoo
Key facts
- 6,534 sq ft lot
- 2 garage spots
- Built 1920
Property features AI
Exterior
- Parking: Detached garage with garage door opener; 2 garage spaces
- Utilities: Public water; Public sewer
- Home design: Single family residence; Two levels; Built in 1920; No common walls
- Construction: Block foundation
- Exterior features: Deck
Interior
- Flooring: Wood flooring; Laminate flooring; Carpet
- Bathrooms: 1 full bathroom
- Heating & cooling: Forced air heating; Central air conditioning
- Interior features: Full basement; Living area approximately 1536
Neighborhood map
What this means for you Summary
Snapshot
- This is a 4-bed/1.0-bath single-family listed at $190k.
Deal economics
- At list price, monthly cash flow is $121 ($1k/yr) — positive.
- The deal already cash-flows at list — no discount required.
- To meet the 1% rule (rent ≥ 1% of price), the offer needs to be $165k (13.3% below list).
- Recommended offer: $165k (13.3% below list) — sets the bar for 1% rule.
Location & tenants
- Location reads 65/100 on livability (#704 in OH) — a middle-class / working-renter tenant base. Strengths: cost of living A+, housing A+; Watch: crime D+, amenities F, commute F.
- Marion City (town): math 22% / reading 31% proficiency, ranked #600 of 656 in OH (top 92%) — low school quality limits family demand, transient renter base, plan for 1-2y turnover; 67% free/reduced lunch — lower-income household profile, screen leases tightly.
- Zoned schools: William Mckinley Elementary School (math 12% / reading 27%, grade F, #1,293 of 1,584 statewide, top 83%, 348 students, 0% FRL); Ulysses S. Grant Middle School (math 22% / reading 25%, grade F, #597 of 654 statewide, top 92%, 998 students, 0% FRL); Harding High School (math 16% / reading 36%, grade F, #636 of 781 statewide, top 82%, 1,050 students, 0% FRL) — zoned schools average 0% FRL vs 67% district-wide (67 pts lower); this property's tenant base skews higher-income than the district average.
- Market conditions: 208 active listings in the ZIP; 1 comparable units currently listed for rent nearby; 53 units permitted in Marion County in 2024 (0 in 5+ unit buildings).
- This rent runs 36% of the median local income ($55k/yr) — at the standard rent-burdened threshold; future hikes will face affordability resistance.
Forward outlook
- Local home prices are declining (-3.0%/yr); year-one equity from $1k of loan paydown is wiped out by about $6k of value loss. Plan a longer hold.
- Marion County population projected at -18% by 2050 — secular population decline; favor cash flow + early exit over multi-decade hold.
Negotiation context
- It's been on market 24 days — a 2% lower offer ($187k) is reasonable based on typical stale-listing flexibility.
- 2 sale attempts since 21y ago; this cycle's ask is 118% above the opening price — seller raised mid-cycle; expect resistance to lowballs.
- Current owner paid $70k; list at $190k implies a 171% gain — meaningful room to come down on a strong offer.
Risks & watch-outs
- Watch-outs: built in 1920 — expect roof / HVAC / electrical / plumbing capex.
Questions for the listing agent
- Built in 1920 — when were the roof, HVAC, electrical panel, plumbing, and water heater last replaced?
- Is there a deadline driving the sale (1031 exchange, divorce, estate, relocation)? That informs how much negotiation room exists.
- Schools are D-rated, which usually means shorter tenancies and higher turnover. Who's the typical renter profile here, and what's been the actual vacancy rate?
- Crime grade is D in this area — have there been break-ins, vandalism, or insurance claims at this property in the last 3 years? What carrier currently insures it and at what premium?
- The area grade is low — what's the realistic commute time and amenity access for the typical tenant pool here? Any planned neighborhood developments (good or bad) we should know about?
- What's the average days-on-market for RENTAL listings here right now (not sales)? A rising rental-DOM trend means longer vacancies and softer asking-rent achievability than the comps imply.
- What's the recent tenant-quality profile in this submarket — average credit score on applications, eviction rate, late-payment / NSF rate, and stable-employment percentage? A property-management company in the area should have these aggregated.
- How much new for-sale + rental construction is in the pipeline within 1–3 miles? Heavy new supply typically softens prices + rents 12–24 months out; constrained supply supports both.
Investment metrics
- 1% rule
- 0.87% ✗
- Cap rate
- 7.06%
- Cash-on-cash
- 2.74%
- DSCR
- 1.12
- GRM
- 9.6
CMA / ARV
- ARV (on-the-fly)
- $170,496
- Comps found
- 12
Show comp detail 12 sales within ~0.75 mi
| Address | Dist | Beds/Ba | Sqft | Sold | Price | $/sf | Match |
|---|---|---|---|---|---|---|---|
| 538 Cherry St | 0.20mi | 4/2.0 | 1,596 (+4%) | 1mo | $150,000 | $94 | 80 |
| 618 Irey Ave | 0.20mi | 3/1.0 (-1) | 1,426 (-7%) | 0mo | $125,000 | $88 | 74 |
| 328 Thew Ave | 0.55mi | 4/2.0 | 1,530 (-0%) | 1mo | $226,000 | $148 | 69 |
| 340 Marion Ave | 0.40mi | 3/1.0 (-1) | 1,609 (+5%) | 2mo | $178,350 | $111 | 66 |
| 657 Cleveland Ave | 0.26mi | 3/1.5 (-1) | 1,384 (-10%) | 2mo | $225,000 | $163 | 63 |
| 576 Girard Ave | 0.18mi | 4/2.5 | 1,733 (+13%) | 2mo | $227,500 | $131 | 62 |
| 620 Herman St | 0.66mi | 4/1.0 | 1,484 (-3%) | 2mo | $25,000 | $17 | 62 |
| 283 E Walnut St | 0.38mi | 4/2.0 | 1,716 (+12%) | 2mo | $245,000 | $143 | 57 |
| 201 Orchard St | 0.44mi | 4/2.0 | 1,700 (+11%) | 1mo | $224,900 | $132 | 57 |
| 226 Malo Dr | 0.57mi | 3/1.0 (-1) | 1,432 (-7%) | 1mo | $130,000 | $91 | 56 |
| 322 Belmont St | 0.42mi | 3/1.0 (-1) | 1,756 (+14%) | 2mo | $194,000 | $110 | 50 |
| 373 W Church St | 0.53mi | 3/1.5 (-1) | 1,354 (-12%) | 1mo | $84,000 | $62 | 48 |
Match score weights: distance 35% · size 25% · config 20% · recency 20%. Top-matched comps best support the ARV.
Projected returns pro-forma
-3.0% appreciation · 3.0% rent growth · sell at horizon
- IRR
- -12.0%
- Equity multiple
- 0.57×
- Total profit
- $-23,099
- Equity at exit
- $28,315
- IRR
- -2.9%
- Equity multiple
- 0.80×
- Total profit
- $-10,393
- Equity at exit
- $16,419
Cash invested: $53,172 (down + closing). Projections, not guarantees.
Landlord ↔ Tenant lean methodology
- Overall (STATE)
- 73 Landlord-Friendly
- State Ohio
- 73 Landlord-Friendly · R+6
- County
- — inherits STATE
- City
- — inherits STATE
ZIP-level market 43302
- Home prices YoY
- -33.9%
- Active inventory
- 208
- Price-to-rent
- 9.6×
Monthly cashflow live
- Estimated rent
- $1,646 medium interval (Pro) →
- Mortgage (P&I)
- −$996
- Tax from tax record
- −$104 /mo · $1,247/yr
- Insurance
- −$79
- HOA
- −$0
- Vacancy / Maint / Mgmt
- −$346
- Net cashflow
- $121
Break-even live
Sensitivity live
| Price | -10% $229 | -5% $175 | +0% $121 | +5% $68 | +10% $14 |
|---|---|---|---|---|---|
| Rent | -10% $-9 | -5% $56 | +0% $121 | +5% $186 | +10% $251 |
| Rate | -1.0pp $217 | -0.5pp $170 | base $121 | +0.5pp $72 | +1.0pp $22 |
UW: 25.0% down · 7.5% · 30yr · 1.5% tax · 5.0% vac · 8.0% maint · 8.0% mgmt
Financing live
Cash to close
- Down payment
- $47,475
- Closing costs
- $5,697
- Reserves months
- —
- Total cash needed
- —
Loan-product check · same deal, 3 products live
Conventional
25% down · 7.5% · 30yr
- Down + closing
- —
- Monthly P&I
- —
- Monthly cashflow
- —
- DSCR
- —
- Eligible?
- —
Personal DTI + credit; lowest rate.
DSCR
20% down · 8.5% · 30yr
- Down + closing
- —
- Monthly P&I
- —
- Monthly cashflow
- —
- DSCR
- —
- Eligible?
- —
No personal income docs; deal must DSCR.
Hard money
10% down · 12.0% · 12mo
- Down + closing
- —
- Monthly P&I
- —
- Monthly cashflow
- —
- DSCR
- —
- Eligible?
- —
Short-term bridge; refi at stabilization.
Rent comps 1 comps
| Address | Beds | Baths | Sqft | Rent | $/sqft | DOM | Units | Dist |
|---|---|---|---|---|---|---|---|---|
| 1250 Crescent Heights Rd Marion, OH | 1.0–3.0 | 1.0 | 827 | $1,200 | $1.45 | 45d | 1 | 1.20mi |
Listing history 23 events
-
2026-06-21days on market $189,900 Active 24 DOM
-
2026-06-19pricedays on market $189,900 Active 22 DOM
-
2026-06-18days on market $199,000 Active 21 DOM
-
2026-06-17days on market $199,000 Active 20 DOM
-
2026-06-16days on market $199,000 Active 19 DOM
-
2026-06-15days on market $199,000 Active 18 DOM
-
2026-06-14days on market $199,000 Active 16 DOM
-
2026-06-12days on market $199,000 Active 15 DOM
-
2026-06-09days on market $199,000 Active 12 DOM
-
2026-06-08days on market $199,000 Active 11 DOM
-
2026-06-07days on market $199,000 Active 10 DOM
-
2026-06-05days on market $199,000 Active 7 DOM
-
2026-06-03days on market $199,000 Active 6 DOM
-
2026-06-02days on market $199,000 Active 5 DOM
-
2026-06-01days on market $199,000 Active 4 DOM
-
2026-05-31days on market $199,000 Active 3 DOM
-
2026-05-30days on market $199,000 Active 2 DOM
-
2026-05-22historical $199,000
-
2021-06-02historical
-
2006-03-27historical
-
2005-09-26$93,000
-
2005-09-26$87,000
-
1999-03-02soldstatus $70,000
ⓘ Source: listings_history table (triggers on properties + properties_extension) + one-shot
backfill from property_details.listing_events for pre-trigger history.
Tax reassessment forecast OH · Partial reset (capped growth)
- Current annual tax
- $1,247 · $104/mo
- Projected year-2 tax
- $2,105 · $175/mo
- Expected delta
- +$858/yr (+$71/mo · 68.8%)
ⓘ Screening estimate from a state-policy table — verify with the county assessor before closing.
Climate risk First Street
- Flood 1/10 Low FEMA zone X (unshaded) · 0% chance over 30 yrs
- Wildfire 1/10 Low
- Heat 3/10 Moderate 7 d/yr ≥100°F today · 18 d/yr by 30 yrs out
- Wind 2/10 Low
- Air quality 2/10 Low 1 unhealthy d/yr today · 1 by 30 yrs out
Nearby sold comps map
Loading sold comps map…
Walkable amenities ~0.75 mi
Loading nearby amenities…
Taxation est. · year 1
- Rental income
- $19,751
- − Mortgage interest
- −$10,637
- − Property taxes
- −$1,247
- − Insurance
- −$950
- − Repairs & maintenance
- −$1,580
- − Management
- −$1,580
- − Depreciation
- −$5,524
- Taxable loss
- −$1,767
- Est. tax savings @ 24.0%
- +$424
- After-tax cash flow
- $1,881/yr
For passive investors: Depreciation is non-cash, so a rental often shows a tax loss while cash-flowing — sheltering income. Rental losses are passive: they offset passive income freely, and up to $25,000/yr can offset ordinary (W-2) income if you actively participate and your MAGI is under $100k (phasing out to $0 by $150k); unused losses carry forward. On sale, claimed depreciation is recaptured at up to 25%, and gains may owe capital-gains tax (a 1031 exchange can defer both). Figures are a year-1 estimate at your 24.0% rate — not tax advice; consult a CPA.
Schools (NCES district)
- District
- Marion City
- NCES district ID
- 3904433
- Math proficiency
- 22% ▼ -17.00%
- Reading proficiency
- 31% ▼ -8.00%
- Median HH income
- $32,327
- Composite
- 21.58/100
- National rank
- #8306
- State rank
- #600 of 656 in OH
Livability — Marion
- Score
- 65/100
- State rank
- #704
- US rank
- #12605
Category grades
Schools grade is shown separately in the Schools card above.
Census & demographics
- Census place
- Marion, OH
- County
- Marion County · 53,702 people
- City population
- 53,702
- Metro
- Marion, OH
- Population (ZIP)
- 53,702
- Household income
- $55,057
- Rent vs Own
- Severe rent burden
- 1554.0
Population outlook (Marion County) Hauer SSP2
- Today (2025)
- 62,078 people
- By 2030
- 60,049 · -3.3%
- By 2040
- 55,413 · -10.7%
- By 2050
- 50,604 · -18.5%
- By 2075
- 40,162 · -35.3%
- By 2100
- 29,105 · -53.1%
Race, ethnicity, and origin ACS 2023
- Neighborhood character
- Predominantly White (85%)
- Race & ethnicity
- White 85% Black 6% Two or more races 6% Hispanic / Latino 3%
- Common ancestry
- Slovak 2% Romanian 2% Lithuanian 2%
- Foreign-born
- 2% · Canada
- Languages at home
- 96% English-only · Spanish 2% Arabic 1%
Political lean MEDSL · Marion
- 2024 margin
- Solid R (+41.4) · D 28.9% · R 70.3%
- 2008→2024 swing
- -32.5pp toward R · 2008: -8.9pp · 2024: -41.4pp
- All cycles
- 2024: R+41.4 2020: R+38.6 2016: R+34.4 2012: R+7.6 2008: R+8.9
Not yet ingested
- Civics
- —
Market trends
- HPI YoY
- ▼ -114.52%
- Current HPI
- 223.5344
- Rent YoY
- —
- Metro
- Marion, OH
- State GDP YoY
- ▲ 1.98%
- F500 in state
- 48
Industry mix (Fortune 500 HQ in OH)
| Industry | F500 HQs | Revenue |
|---|---|---|
| Insurance | 3 | $145B |
|
||
| Industrial Machinery | 3 | $49B |
|
||
| Financial Services | 3 | $24B |
|
||
| Consumer Goods | 2 | $93B |
|
||
| Aerospace / Defense | 2 | $47B |
|
||
| Utilities | 2 | $33B |
|
||
Price history
+184.3% since first listed6 events — show timeline
- 2026-05-22 Coming Soon $199,000 CBRMLS
- 2021-06-02 Listing Removed — CBRMLS
- 2006-03-27 Listing Removed — CBRMLS
- 2005-09-26 Listed $87,000 CBRMLS
- 2005-09-26 Listed $93,000 CBRMLS
- 1999-03-02 Sold (Public Records) $70,000 Public Records
Property tax history
+2.0%/yrLatest (2025): $1,247 · +0.0% YoY. Source: county tax records.
Cash-flow waterfall
monthlySold comps — $/sqft
last 12 mo · ≤1 miLoading sold comps…