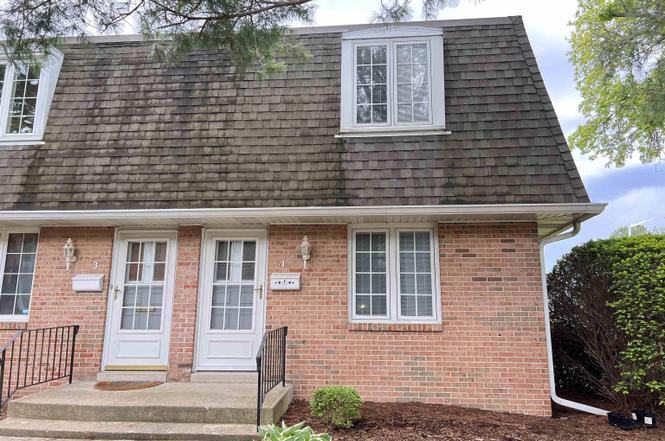
900 S Durkin Dr · Springfield, IL
Flood risk 1/10 · Minimal
- FEMA flood zone
- X (unshaded)
- Chance of flooding over 30 yrs
- 0.0%
- Est. flood insurance / yr
- $473 – $860
Fire risk 1/10 · Minimal
- Est. fire insurance / yr
- $804 – $1,492
Heat risk 4/10 · Minor
- Hot days now (above 105°F)
- 7 days/yr
- Hot days in 30 yrs
- 21 days/yr
Wind risk 2/10 · Minimal
- Chance of severe wind over 30 yrs
- 1.0%
Air-quality risk 2/10 · Minimal
- Unhealthy air days now
- 1 days/yr
- Unhealthy air days in 30 yrs
- 2 days/yr
Risk factors via First Street. Map © Google.
Why this score? — see what drove the C grade
The composite is a weighted blend of 9 inputs, each scored 0–100. Each bar is that input's sub-score; the figure is the points it added to the 100-point composite (weight × sub-score).
- Cash flow +24.7/30.0
- DSCR +8.0/10.0
- ARV discount +7.5/15.0
- 1% rule +6.4/10.0
- Rent growth +4.1/5.0
- Livability +4.0/5.0
- Condition / age +2.5/5.0
- Schools +1.7/10.0
- Appreciation +0.0/10.0
$110,000
🖨 Deal sheet (PDF) 📄 Offer letter ✓ Due diligence
Key facts
- Built 1973
Neighborhood map
What this means for you Summary
Snapshot
- This is a 2-bed/1.5-bath townhouse listed at $110k.
Deal economics
- At list price, monthly cash flow is $230 ($3k/yr) — positive.
- The deal already cash-flows at list — no discount required.
- Meets the 1% rule at list price ($1k rent vs $110k).
- Cap rate 8.8% vs local median 4.9% in Springfield — top-decile yield for the area; either an underpriced asset or a hidden risk that comps aren't pricing in. Stress-test before assuming the spread holds.
Location & tenants
- Location reads 79/100 on livability (#122 in IL, #2,138 nationally) — a middle-class / working-renter tenant base. Strengths: amenities A+, commute A+, cost of living A+; Watch: crime F.
- Springfield SD 186 (urban): math 17% / reading 22% proficiency, ranked #438 of 620 in IL (top 71%) — low school quality limits family demand, transient renter base, plan for 1-2y turnover; 64% free/reduced lunch — lower-income household profile, screen leases tightly.
- Zoned schools: Dubois Elem School (math 2% / reading 2%, grade F, #1,927 of 2,056 statewide, top 100%, 443 students, 0% FRL); U S Grant Middle School (math 6% / reading 15%, grade F, #580 of 665 statewide, top 88%, 529 students, 0% FRL); Springfield High School (math 44% / reading 53%, grade D, #49 of 693 statewide, top 7%, 1,461 students, 0% FRL) — zoned schools average 0% FRL vs 64% district-wide (64 pts lower); this property's tenant base skews higher-income than the district average.
- Market conditions: Rents rising fast (+6.3%/yr); 183 active listings in the ZIP; 1 comparable units currently listed for rent nearby; 225 units permitted in Sangamon County in 2024 (48 in 5+ unit buildings).
Forward outlook
- Local home prices are declining (-3.0%/yr); year-one equity from $761 of loan paydown is wiped out by about $3k of value loss. Plan a longer hold.
- Sangamon County population projected to shrink 9% by 2050 — rents likely to lag national; underwrite the cash flow, not the appreciation.
- At projected returns (-3.0% appreciation + 6.3% rent growth), your $31k cash investment doubles in ~9 years — after that, you're playing with house money.
Negotiation context
- Only 1 days on market — expect competitive offers; lowballing is unlikely to land.
- 46 sale attempts since 29y ago; this cycle's ask is 61% above the opening price — seller raised mid-cycle; expect resistance to lowballs.
- Current owner paid $70k; list at $110k implies a 58% gain — meaningful room to come down on a strong offer.
Questions for the listing agent
- Built in 1973 — when were the roof, HVAC, electrical panel, plumbing, and water heater last replaced?
- Is there a deadline driving the sale (1031 exchange, divorce, estate, relocation)? That informs how much negotiation room exists.
- Schools are D-rated, which usually means shorter tenancies and higher turnover. Who's the typical renter profile here, and what's been the actual vacancy rate?
- Crime grade is F in this area — have there been break-ins, vandalism, or insurance claims at this property in the last 3 years? What carrier currently insures it and at what premium?
- What's the average days-on-market for RENTAL listings here right now (not sales)? A rising rental-DOM trend means longer vacancies and softer asking-rent achievability than the comps imply.
- What's the recent tenant-quality profile in this submarket — average credit score on applications, eviction rate, late-payment / NSF rate, and stable-employment percentage? A property-management company in the area should have these aggregated.
- How much new for-sale + rental construction is in the pipeline within 1–3 miles? Heavy new supply typically softens prices + rents 12–24 months out; constrained supply supports both.
Investment metrics
- 1% rule
- 1.14% ✓
- Cap rate
- 8.81%
- Cash-on-cash
- 8.98%
- DSCR
- 1.40
- GRM
- 7.3
CMA / ARV
- ARV (on-the-fly)
- $284,798
- Comps found
- 2
Show comp detail 2 sales within ~0.75 mi
| Address | Dist | Beds/Ba | Sqft | Sold | Price | $/sf | Match |
|---|---|---|---|---|---|---|---|
| 900 S Durkin Dr #25 | 0.03mi | 2/1.5 | 1,814 (0%) | 22mo | $80,000 | $44 | 80 |
| 3208 Mackinaw Ln | 0.74mi | 3/2.0 (+1) | 1,704 (-6%) | 21mo | $267,000 | $157 | 31 |
Match score weights: distance 35% · size 25% · config 20% · recency 20%. Top-matched comps best support the ARV.
Projected returns pro-forma
-3.0% appreciation · 6.32% rent growth · sell at horizon
- IRR
- 1.0%
- Equity multiple
- 1.04×
- Total profit
- $1,196
- Equity at exit
- $16,401
- IRR
- 13.7%
- Equity multiple
- 2.27×
- Total profit
- $39,028
- Equity at exit
- $9,511
Cash invested: $30,800 (down + closing). Projections, not guarantees.
Landlord ↔ Tenant lean methodology
- Overall (STATE)
- 43 Moderately Tenant-Leaning
- State Illinois
- 43 Moderately Tenant-Leaning · D+7
- County
- — inherits STATE
- City
- — inherits STATE
ZIP-level market 62704
- Home prices YoY
- -31.1%
- Rents YoY
- 6.3%
- Active inventory
- 183
- Price-to-rent
- 7.3×
Monthly cashflow live
- Estimated rent
- $1,254 medium interval (Pro) →
- Mortgage (P&I)
- −$577
- Tax est. 1.5%
- −$138 /mo · $1,650/yr
- Insurance
- −$46
- HOA
- −$0
- Vacancy / Maint / Mgmt
- −$263
- Net cashflow
- $230
Break-even live
Sensitivity live
| Price | -10% $306 | -5% $268 | +0% $230 | +5% $192 | +10% $154 |
|---|---|---|---|---|---|
| Rent | -10% $131 | -5% $181 | +0% $230 | +5% $280 | +10% $329 |
| Rate | -1.0pp $286 | -0.5pp $258 | base $230 | +0.5pp $202 | +1.0pp $173 |
UW: 25.0% down · 7.5% · 30yr · 1.5% tax · 5.0% vac · 8.0% maint · 8.0% mgmt
Financing live
Cash to close
- Down payment
- $27,500
- Closing costs
- $3,300
- Reserves months
- —
- Total cash needed
- —
Loan-product check · same deal, 3 products live
Conventional
25% down · 7.5% · 30yr
- Down + closing
- —
- Monthly P&I
- —
- Monthly cashflow
- —
- DSCR
- —
- Eligible?
- —
Personal DTI + credit; lowest rate.
DSCR
20% down · 8.5% · 30yr
- Down + closing
- —
- Monthly P&I
- —
- Monthly cashflow
- —
- DSCR
- —
- Eligible?
- —
No personal income docs; deal must DSCR.
Hard money
10% down · 12.0% · 12mo
- Down + closing
- —
- Monthly P&I
- —
- Monthly cashflow
- —
- DSCR
- —
- Eligible?
- —
Short-term bridge; refi at stabilization.
Rent comps 1 comps
| Address | Beds | Baths | Sqft | Rent | $/sqft | DOM | Units | Dist |
|---|---|---|---|---|---|---|---|---|
| 4044 Oakbrook Ct Springfield, IL | 2.0 | 2.0 | 1300 | $1,500 | $1.15 | 22d | 1 | 1.48mi |
Listing history 1 events
-
2026-06-19$110,000 Active 1 DOM
ⓘ Source: listings_history table (triggers on properties + properties_extension) + one-shot
backfill from property_details.listing_events for pre-trigger history.
Climate risk First Street
- Flood 1/10 Low FEMA zone X (unshaded) · 0% chance over 30 yrs
- Wildfire 1/10 Low
- Heat 4/10 Moderate 7 d/yr ≥105°F today · 21 d/yr by 30 yrs out
- Wind 2/10 Low 100% chance of damaging wind over 30 yrs
- Air quality 2/10 Low 1 unhealthy d/yr today · 2 by 30 yrs out
Nearby sold comps map
Loading sold comps map…
Walkable amenities ~0.75 mi
Loading nearby amenities…
Taxation est. · year 1
- Rental income
- $15,047
- − Mortgage interest
- −$6,162
- − Property taxes
- −$1,650
- − Insurance
- −$550
- − Repairs & maintenance
- −$1,204
- − Management
- −$1,204
- − Depreciation
- −$3,200
- Taxable income
- $1,078
- Est. tax owed @ 24.0%
- −$259
- After-tax cash flow
- $2,506/yr
For passive investors: Depreciation is non-cash, so a rental often shows a tax loss while cash-flowing — sheltering income. Rental losses are passive: they offset passive income freely, and up to $25,000/yr can offset ordinary (W-2) income if you actively participate and your MAGI is under $100k (phasing out to $0 by $150k); unused losses carry forward. On sale, claimed depreciation is recaptured at up to 25%, and gains may owe capital-gains tax (a 1031 exchange can defer both). Figures are a year-1 estimate at your 24.0% rate — not tax advice; consult a CPA.
Schools (NCES district)
- District
- Springfield SD 186
- NCES district ID
- 1737080
- Math proficiency
- 17% ▼ -7.00%
- Reading proficiency
- 22% ▼ -5.00%
- Median HH income
- $43,744
- Composite
- 16.89/100
- National rank
- #9142
- State rank
- #438 of 620 in IL
Livability — Springfield
- Score
- 79/100
- State rank
- #122
- US rank
- #2138
Category grades
Schools grade is shown separately in the Schools card above.
Census & demographics
- Census place
- Springfield, IL
- County
- Sangamon County · 115,414 people
- City population
- 59,955
- Metro
- Springfield, IL
- Population (ZIP)
- 40,046
- Household income
- $69,976
- Rent vs Own
- Severe rent burden
- 1529.0
Population outlook (Sangamon County) Hauer SSP2
- Today (2025)
- 198,317 people
- By 2030
- 196,127 · -1.1%
- By 2040
- 188,664 · -4.9%
- By 2050
- 179,624 · -9.4%
- By 2075
- 155,027 · -21.8%
- By 2100
- 122,588 · -38.2%
Race, ethnicity, and origin ACS 2023
- Neighborhood character
- Predominantly White (74%)
- Race & ethnicity
- White 74% Black 15% Two or more races 5% Hispanic / Latino 4% Asian 4%
- Common ancestry
- Lithuanian 2% Romanian 2% Slovak 2%
- Foreign-born
- 6% · Canada, China, Vietnam
- Languages at home
- 92% English-only · Spanish 2% Other Indo-European 1% Tagalog/Filipino 1%
Political lean MEDSL · Sangamon
- 2024 margin
- Toss-up / Even · D 46.6% · R 51.6% · Other 1.8%
- 2008→2024 swing
- -9.3pp toward R · 2008: 4.4pp · 2024: -5.0pp
- All cycles
- 2024: R+5.0 2020: R+4.4 2016: R+9.4 2012: R+8.7 2008: D+4.4
Not yet ingested
- Civics
- —
Market trends
- HPI YoY
- ▼ -70.79%
- Current HPI
- 156.7086
- Rent YoY
- ▲ 6.32%
- Metro
- Springfield, IL
- State GDP YoY
- ▲ 1.59%
- F500 in state
- 60
Industry mix (Fortune 500 HQ in IL)
| Industry | F500 HQs | Revenue |
|---|---|---|
| Insurance | 4 | $201B |
|
||
| Consumer Goods | 4 | $87B |
|
||
| Industrial Machinery | 3 | $64B |
|
||
| Healthcare | 2 | $55B |
|
||
| Retail / Pharmacy | 1 | $148B |
|
||
| Agriculture / Food | 1 | $86B |
|
||
Price history
+33.9% since first listed96 events — show timeline
- 2021-08-06 Listing Removed — RMLSA as Distributed by MLS Grid
- 2021-08-06 Listing Removed — RMLSA as Distributed by MLS Grid
- 2021-08-06 Listing Removed — RMLSA as Distributed by MLS Grid
- 2021-08-06 Listing Removed — RMLSA as Distributed by MLS Grid
- 2010-07-15 Sold (MLS) $69,500 RMLSA as Distributed by MLS Grid
- 2010-06-08 Sold (MLS) $66,625 RMLSA as Distributed by MLS Grid
- 2010-05-26 Sold (MLS) $58,000 RMLSA as Distributed by MLS Grid
- 2010-02-18 Listed $68,500 RMLSA as Distributed by MLS Grid
- 2010-02-03 Listed $69,900 RMLSA as Distributed by MLS Grid
- 2009-11-06 Sold (MLS) $68,500 RMLSA as Distributed by MLS Grid
- 2009-10-14 Listed $64,900 RMLSA as Distributed by MLS Grid
- 2009-09-05 Listed $69,000 RMLSA as Distributed by MLS Grid
- 2009-08-21 Sold (MLS) $62,750 RMLSA as Distributed by MLS Grid
- 2009-08-07 Sold (MLS) $41,495 RMLSA as Distributed by MLS Grid
- 2009-08-04 Sold (MLS) $66,000 RMLSA as Distributed by MLS Grid
- 2009-05-13 Listed $68,000 RMLSA as Distributed by MLS Grid
- 2009-05-01 Listed $44,900 RMLSA as Distributed by MLS Grid
- 2009-02-07 Listed $67,000 RMLSA as Distributed by MLS Grid
- 2008-08-29 Sold (MLS) $66,000 RMLSA as Distributed by MLS Grid
- 2008-06-30 Sold (MLS) $57,000 RMLSA as Distributed by MLS Grid
- 2008-06-27 Sold (MLS) $54,000 RMLSA as Distributed by MLS Grid
- 2008-06-14 Listed $68,500 RMLSA as Distributed by MLS Grid
- 2008-05-03 Listed $59,900 RMLSA as Distributed by MLS Grid
- 2008-03-25 Listed $59,500 RMLSA as Distributed by MLS Grid
- 2008-02-19 Sold (MLS) $66,000 RMLSA as Distributed by MLS Grid
- 2008-01-18 Sold (MLS) $44,000 RMLSA as Distributed by MLS Grid
- 2007-10-24 Listed $47,000 RMLSA as Distributed by MLS Grid
- 2007-09-28 Sold (MLS) $67,500 RMLSA as Distributed by MLS Grid
- 2007-09-04 Sold (MLS) $68,000 RMLSA as Distributed by MLS Grid
- 2007-08-15 Listed $67,900 RMLSA as Distributed by MLS Grid
- 2007-06-28 Sold (MLS) $67,000 RMLSA as Distributed by MLS Grid
- 2007-04-07 Listed $71,500 RMLSA as Distributed by MLS Grid
- 2007-03-23 Sold (MLS) $65,000 RMLSA as Distributed by MLS Grid
- 2007-03-22 Listed $67,900 RMLSA as Distributed by MLS Grid
- 2007-02-13 Listed $68,500 RMLSA as Distributed by MLS Grid
- 2006-06-28 Listed $68,900 RMLSA as Distributed by MLS Grid
- 2006-05-25 Sold (MLS) $67,900 RMLSA as Distributed by MLS Grid
- 2006-05-01 Listed $67,900 RMLSA as Distributed by MLS Grid
- 2006-01-31 Sold (MLS) $62,500 RMLSA as Distributed by MLS Grid
- 2005-12-30 Sold (MLS) $59,000 RMLSA as Distributed by MLS Grid
- 2005-11-23 Sold (MLS) $65,900 RMLSA as Distributed by MLS Grid
- 2005-11-16 Listed $65,900 RMLSA as Distributed by MLS Grid
- 2005-10-16 Listed $68,900 RMLSA as Distributed by MLS Grid
- 2005-07-18 Listed $59,000 RMLSA as Distributed by MLS Grid
- 2005-07-13 Sold (MLS) $62,800 RMLSA as Distributed by MLS Grid
- 2005-05-20 Listed $63,900 RMLSA as Distributed by MLS Grid
- 2005-05-20 Sold (MLS) $54,000 RMLSA as Distributed by MLS Grid
- 2005-05-09 Sold (MLS) $62,000 RMLSA as Distributed by MLS Grid
- 2005-04-29 Sold (MLS) $61,000 RMLSA as Distributed by MLS Grid
- 2005-04-07 Listed $62,500 RMLSA as Distributed by MLS Grid
- 2005-03-14 Listed $62,900 RMLSA as Distributed by MLS Grid
- 2005-03-01 Listed $57,400 RMLSA as Distributed by MLS Grid
- 2004-01-30 Sold (MLS) $63,500 RMLSA as Distributed by MLS Grid
- 2003-12-08 Listed $63,900 RMLSA as Distributed by MLS Grid
- 2003-10-24 Sold (MLS) $57,000 RMLSA as Distributed by MLS Grid
- 2003-09-03 Listed $59,500 RMLSA as Distributed by MLS Grid
- 2003-06-27 Sold (MLS) $57,000 RMLSA as Distributed by MLS Grid
- 2003-04-05 Listed $59,900 RMLSA as Distributed by MLS Grid
- 2003-02-28 Sold (MLS) $55,500 RMLSA as Distributed by MLS Grid
- 2003-01-27 Listed $57,900 RMLSA as Distributed by MLS Grid
- 2002-10-24 Sold (MLS) $56,000 RMLSA as Distributed by MLS Grid
- 2002-09-04 Sold (MLS) $54,500 RMLSA as Distributed by MLS Grid
- 2002-07-03 Listed $56,500 RMLSA as Distributed by MLS Grid
- 2002-06-03 Listed $56,000 RMLSA as Distributed by MLS Grid
- 2002-04-30 Listed $57,900 RMLSA as Distributed by MLS Grid
- 2002-04-30 Sold (MLS) $57,000 RMLSA as Distributed by MLS Grid
- 2002-04-11 Sold (MLS) $57,500 RMLSA as Distributed by MLS Grid
- 2002-03-05 Listed $57,500 RMLSA as Distributed by MLS Grid
- 2002-03-04 Sold (MLS) $53,500 RMLSA as Distributed by MLS Grid
- 2002-02-28 Sold (MLS) $57,500 RMLSA as Distributed by MLS Grid
- 2002-01-18 Listed $56,000 RMLSA as Distributed by MLS Grid
- 2001-10-24 Sold (MLS) $59,500 RMLSA as Distributed by MLS Grid
- 2001-10-04 Listed $59,500 RMLSA as Distributed by MLS Grid
- 2001-09-13 Listed $59,500 RMLSA as Distributed by MLS Grid
- 2001-08-31 Sold (MLS) $57,000 RMLSA as Distributed by MLS Grid
- 2001-07-13 Listed $57,000 RMLSA as Distributed by MLS Grid
- 2001-07-13 Sold (MLS) $49,000 RMLSA as Distributed by MLS Grid
- 2001-06-25 Sold (MLS) $53,500 RMLSA as Distributed by MLS Grid
- 2001-05-10 Listed $56,300 RMLSA as Distributed by MLS Grid
- 2001-04-11 Listed $53,900 RMLSA as Distributed by MLS Grid
- 2000-06-27 Sold (MLS) $51,500 RMLSA as Distributed by MLS Grid
- 2000-06-19 Sold (MLS) $53,500 RMLSA as Distributed by MLS Grid
- 2000-03-24 Sold (MLS) $52,000 RMLSA as Distributed by MLS Grid
- 2000-03-17 Listed $54,500 RMLSA as Distributed by MLS Grid
- 2000-03-02 Listed $56,000 RMLSA as Distributed by MLS Grid
- 2000-01-05 Listed $56,500 RMLSA as Distributed by MLS Grid
- 1998-09-14 Sold (MLS) $51,000 RMLSA as Distributed by MLS Grid
- 1998-08-26 Sold (MLS) $58,900 RMLSA as Distributed by MLS Grid
- 1998-08-26 Sold (MLS) $54,500 RMLSA as Distributed by MLS Grid
- 1998-08-24 Listed $57,500 RMLSA as Distributed by MLS Grid
- 1998-07-15 Sold (MLS) $53,000 RMLSA as Distributed by MLS Grid
- 1998-07-11 Listed $56,500 RMLSA as Distributed by MLS Grid
- 1998-06-28 Listed $51,000 RMLSA as Distributed by MLS Grid
- 1998-05-11 Listed $54,900 RMLSA as Distributed by MLS Grid
- 1998-04-24 Sold (MLS) $50,000 RMLSA as Distributed by MLS Grid
- 1997-12-11 Listed $51,900 RMLSA as Distributed by MLS Grid
Cash-flow waterfall
monthlySold comps — $/sqft
last 12 mo · ≤1 miLoading sold comps…