901 6530 Rd #1212 · Montrose, CO
Flood risk 1/10 · Minimal
- FEMA flood zone
- X (unshaded)
- Chance of flooding over 30 yrs
- 0.0%
- Est. flood insurance / yr
- $507 – $1,088
Fire risk 3/10 · Minor
- Est. fire insurance / yr
- $939 – $1,743
Heat risk 4/10 · Minor
- Hot days now (above 91°F)
- 7 days/yr
- Hot days in 30 yrs
- 18 days/yr
Wind risk 1/10 · Minimal
- Chance of severe wind over 30 yrs
- —
Air-quality risk 1/10 · Minimal
- Unhealthy air days now
- 0 days/yr
- Unhealthy air days in 30 yrs
- 0 days/yr
Risk factors via First Street. Map © Google.
Why this score? — see what drove the B grade
The composite is a weighted blend of 9 inputs, each scored 0–100. Each bar is that input's sub-score; the figure is the points it added to the 100-point composite (weight × sub-score).
- Cash flow +30.0/30.0
- ARV discount +13.9/15.0
- 1% rule +10.0/10.0
- DSCR +10.0/10.0
- Livability +3.4/5.0
- Rent growth +2.5/5.0
- Schools +2.5/10.0
- Condition / age +2.5/5.0
- Appreciation +0.0/10.0
$120,000
🖨 Deal sheet 📄 Offer letter ✓ Due diligence
Listing remarks
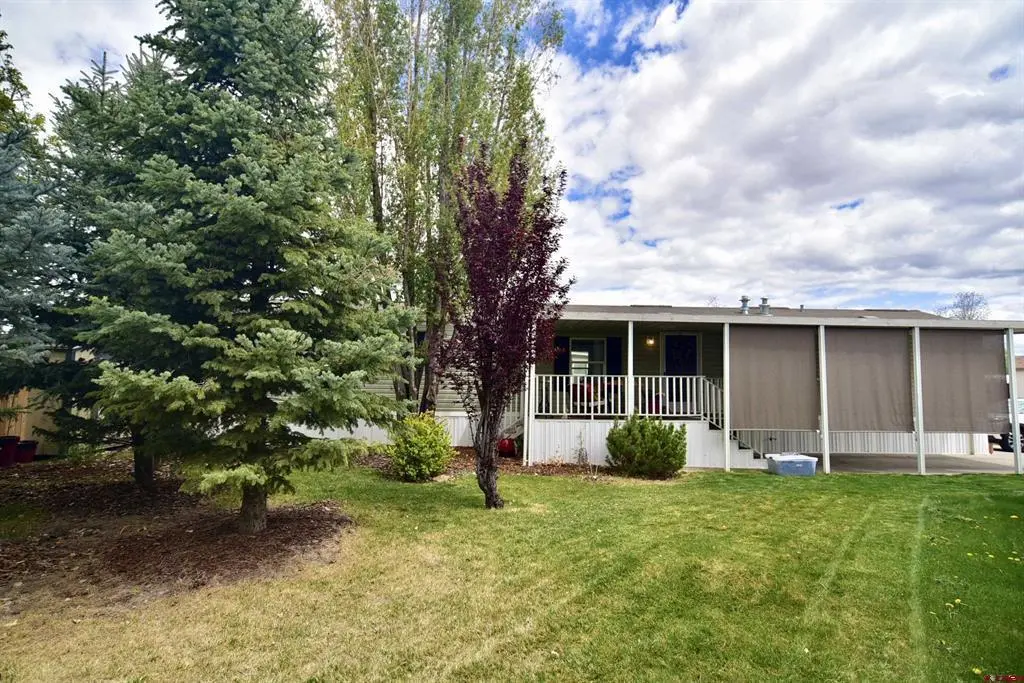
Discover this hidden gem tucked away at the end of a quiet cul-de-sac, offering a large yard with mature trees and fragrant lilac bushes. The property provides ample parking with three designated spaces, including a covered carport for added convenience. Inside, the open-concept kitchen and living area are filled with natural light, creating a bright and welcoming atmosphere. The spacious primary suite features a large walk-in closet and a relaxing soaking tub, perfect for unwinding. A second full bathroom ensures comfort and convenience for family members and guests. Residents of this community enjoy a variety of amenities, including a community center, walking paths, dog park, playground,
Key facts
- Covered carport
- Open-concept kitchen
- Large yard
Tags
Property features AI
Finance
- HOA & community: Part of the Cimarron Creek homeowners association
Exterior
- Parking: Carport with 1 space
- Home design: Single-family residential
- Exterior features: Covered porch
Interior
- Bathrooms: Two full bathrooms
- Interior features: Unfurnished
Neighborhood map
What this means for you Summary
Snapshot
- This is a 3-bed/2.0-bath manufactured listed at $120k.
Deal economics
- At list price, monthly cash flow is $775 ($9k/yr) — positive.
- The deal already cash-flows at list — no discount required.
- Meets the 1% rule at list price ($2k rent vs $120k).
- Recommended offer: $116k (3.0% below list) — sets the bar for market timing.
- Cap rate 14.0% vs local median 2.0% in Montrose — top-decile yield for the area; either an underpriced asset or a hidden risk that comps aren't pricing in. Stress-test before assuming the spread holds.
Location & tenants
- Location reads 68/100 on livability (#109 in CO) — a middle-class / working-renter tenant base. Strengths: housing A+; Watch: amenities C-, schools D+, employment D+.
- Montrose County School District Re-1J (town): math 22% / reading 36% proficiency, ranked #55 of 86 in CO (top 64%) — low school quality limits family demand, transient renter base, plan for 1-2y turnover.
- Market conditions: 371 active listings in the ZIP; 271 units permitted in Montrose County in 2024 (22 in 5+ unit buildings).
- This rent runs 32% of the median local income ($71k/yr) — at the standard rent-burdened threshold; future hikes will face affordability resistance.
Forward outlook
- Local home prices are declining (-3.0%/yr); year-one equity from $830 of loan paydown is wiped out by about $4k of value loss. Plan a longer hold.
- Montrose County population projected at -25% by 2050 — secular population decline; favor cash flow + early exit over multi-decade hold.
- At projected returns (-3.0% appreciation + 3.0% rent growth), your $34k cash investment doubles in ~5 years — after that, you're playing with house money.
Negotiation context
- It's been on market 49 days — a 3% lower offer ($116k) is reasonable based on typical stale-listing flexibility.
- 2 sale attempts since 2y ago with the ask held roughly flat each time — persistent listings suggest the price (not the market) is what's stuck; bring a comps-based counter.
Questions for the listing agent
- It's been on market 49 days. Have you received any prior offers? Is the seller open to a 3% concession, seller financing, or rate buy-down credit?
- Is there a deadline driving the sale (1031 exchange, divorce, estate, relocation)? That informs how much negotiation room exists.
- Schools are D-rated, which usually means shorter tenancies and higher turnover. Who's the typical renter profile here, and what's been the actual vacancy rate?
- What's the average days-on-market for RENTAL listings here right now (not sales)? A rising rental-DOM trend means longer vacancies and softer asking-rent achievability than the comps imply.
- What's the recent tenant-quality profile in this submarket — average credit score on applications, eviction rate, late-payment / NSF rate, and stable-employment percentage? A property-management company in the area should have these aggregated.
- How much new for-sale + rental construction is in the pipeline within 1–3 miles? Heavy new supply typically softens prices + rents 12–24 months out; constrained supply supports both.
Investment metrics
- 1% rule
- 1.58% ✓
- Cap rate
- 14.04%
- Cash-on-cash
- 27.68%
- DSCR
- 2.23
- GRM
- 5.3
CMA / ARV
- ARV (on-the-fly)
- $139,840
- Comps found
- 12
Show comp detail 12 sales within ~0.75 mi
| Address | Dist | Beds/Ba | Sqft | Sold | Price | $/sf | Match |
|---|---|---|---|---|---|---|---|
| 901 6530 Rd #4101 | 0.00mi | 3/2.0 | 1,216 (0%) | 5mo | $80,000 | $66 | 96 |
| 901 6530 Rd #1404 | 0.00mi | 3/2.0 | 1,216 (0%) | 7mo | $123,000 | $101 | 94 |
| 901 6530 Rd #1312 | 0.00mi | 2/2.0 (-1) | 1,188 (-2%) | 4mo | $161,000 | $136 | 88 |
| 901 6530 Rd #2813 | 0.00mi | 2/2.0 (-1) | 1,190 (-2%) | 4mo | $137,500 | $116 | 88 |
| 901 6530 Rd #1603 | 0.00mi | 3/2.0 | 1,178 (-3%) | 9mo | $159,000 | $135 | 87 |
| 901 6530 Rd #2802 | 0.00mi | 3/2.0 | 1,140 (-6%) | 5mo | $119,900 | $105 | 86 |
| 901 6530 Rd #1206 | 0.00mi | 3/2.0 | 1,296 (+7%) | 8mo | $90,000 | $69 | 82 |
| 901 6530 Rd #1106 | 0.00mi | 2/2.0 (-1) | 1,149 (-6%) | 6mo | $85,000 | $74 | 81 |
| 901 6530 Rd #1405 | 0.13mi | 3/2.0 | 1,344 (+10%) | 2mo | $155,000 | $115 | 75 |
| 901 6530 Rd #4115 | 0.00mi | 3/2.0 | 1,344 (+10%) | 9mo | $120,000 | $89 | 75 |
| 1367 Corral Dr | 0.47mi | 3/2.0 | 1,269 (+4%) | 8mo | $340,000 | $268 | 65 |
| 1315 Pitchfork Rd | 0.37mi | 3/2.0 | 1,386 (+14%) | 4mo | $385,000 | $278 | 56 |
Match score weights: distance 35% · size 25% · config 20% · recency 20%. Top-matched comps best support the ARV.
Projected returns pro-forma
-3.0% appreciation · 3.0% rent growth · sell at horizon
- IRR
- 21.7%
- Equity multiple
- 1.89×
- Total profit
- $29,891
- Equity at exit
- $17,892
- IRR
- 29.8%
- Equity multiple
- 3.66×
- Total profit
- $89,460
- Equity at exit
- $10,375
Cash invested: $33,600 (down + closing). Projections, not guarantees.
Landlord ↔ Tenant lean methodology
- Overall (STATE)
- 38 Tenant-Leaning
- State Colorado
- 38 Tenant-Leaning · D+4
- County
- — inherits STATE
- City
- — inherits STATE
ZIP-level market 81401
- Active inventory
- 371
- Price-to-rent
- 5.3×
Monthly cashflow live
- Estimated rent
- $1,900 medium interval (Pro) →
- Mortgage (P&I)
- −$629
- Tax from tax record
- −$47 /mo · $563/yr
- Insurance
- −$50
- HOA
- −$0
- Vacancy / Maint / Mgmt
- −$399
- Net cashflow
- $775
Break-even live
UW: 25.0% down · 7.5% · 30yr · 1.5% tax · 5.0% vac · 8.0% maint · 8.0% mgmt
Financing live
Cash to close
- Down payment
- $30,000
- Closing costs
- $3,600
- Reserves months
- —
- Total cash needed
- —
Loan-product check · same deal, 3 products live
Conventional
25% down · 7.5% · 30yr
- Down + closing
- —
- Monthly P&I
- —
- Monthly cashflow
- —
- DSCR
- —
- Eligible?
- —
Personal DTI + credit; lowest rate.
DSCR
20% down · 8.5% · 30yr
- Down + closing
- —
- Monthly P&I
- —
- Monthly cashflow
- —
- DSCR
- —
- Eligible?
- —
No personal income docs; deal must DSCR.
Hard money
10% down · 12.0% · 12mo
- Down + closing
- —
- Monthly P&I
- —
- Monthly cashflow
- —
- DSCR
- —
- Eligible?
- —
Short-term bridge; refi at stabilization.
Listing history 19 events
-
2026-06-19days on market $120,000 Active 49 DOM
-
2026-06-18days on market $120,000 Active 48 DOM
-
2026-06-17days on market $120,000 Active 47 DOM
-
2026-06-16days on market $120,000 Active 46 DOM
-
2026-06-15days on market $120,000 Active 45 DOM
-
2026-06-14days on market $120,000 Active 43 DOM
-
2026-06-12days on market $120,000 Active 42 DOM
-
2026-06-09days on market $120,000 Active 39 DOM
-
2026-06-08days on market $120,000 Active 38 DOM
-
2026-06-07days on market $120,000 Active 37 DOM
-
2026-06-02days on market $120,000 Active 32 DOM
-
2026-06-01days on market $120,000 Active 31 DOM
-
2026-05-31days on market $120,000 Active 30 DOM
-
2026-05-30days on market $120,000 Active 29 DOM
-
2026-05-01$120,000 Active
-
2025-02-06historical
-
2024-11-27price $141,000
-
2024-11-21price $135,000
-
2024-10-29$141,000 Active
ⓘ Source: listings_history table (triggers on properties + properties_extension) + one-shot
backfill from property_details.listing_events for pre-trigger history.
Tax reassessment forecast CO · Resets to sale price
- Current annual tax
- $563 · $47/mo
- Projected year-2 tax
- $660 · $55/mo
- Expected delta
- +$97/yr (+$8/mo · 17.2%)
ⓘ Screening estimate from a state-policy table — verify with the county assessor before closing.
Climate risk First Street
- Flood 1/10 Low FEMA zone X (unshaded) · 0% chance over 30 yrs
- Wildfire 3/10 Moderate
- Heat 4/10 Moderate 7 d/yr ≥91°F today · 18 d/yr by 30 yrs out
- Wind 1/10 Low
- Air quality 1/10 Low 0 unhealthy d/yr today · 0 by 30 yrs out
Nearby sold comps map
Loading sold comps map…
Walkable amenities ~0.75 mi
Loading nearby amenities…
Taxation est. · year 1
- Rental income
- $22,806
- − Mortgage interest
- −$6,722
- − Property taxes
- −$563
- − Insurance
- −$600
- − Repairs & maintenance
- −$1,824
- − Management
- −$1,824
- − Depreciation
- −$3,491
- Taxable income
- $7,781
- Est. tax owed @ 24.0%
- −$1,867
- After-tax cash flow
- $7,435/yr
For passive investors: Depreciation is non-cash, so a rental often shows a tax loss while cash-flowing — sheltering income. Rental losses are passive: they offset passive income freely, and up to $25,000/yr can offset ordinary (W-2) income if you actively participate and your MAGI is under $100k (phasing out to $0 by $150k); unused losses carry forward. On sale, claimed depreciation is recaptured at up to 25%, and gains may owe capital-gains tax (a 1031 exchange can defer both). Figures are a year-1 estimate at your 24.0% rate — not tax advice; consult a CPA.
Schools (NCES district)
- District
- Montrose County School District Re-1J
- NCES district ID
- 0805790
- Math proficiency
- 22% ▼ -5.00%
- Reading proficiency
- 36% ▼ -7.00%
- Median HH income
- $45,650
- Composite
- 24.9/100
- National rank
- #7577
- State rank
- #55 of 86 in CO
Livability — Montrose
- Score
- 68/100
- State rank
- #109
- US rank
- #9310
Category grades
Schools grade is shown separately in the Schools card above.
Census & demographics
- Census place
- Montrose, CO
- County
- Montrose County · 24,228 people
- City population
- 24,228
- Metro
- Montrose, CO
- Population (ZIP)
- 24,228
- Household income
- $71,286
- Rent vs Own
- Severe rent burden
- 682.0
Population outlook (Montrose County) Hauer SSP2
- Today (2025)
- 39,229 people
- By 2030
- 37,791 · -3.7%
- By 2040
- 33,829 · -13.8%
- By 2050
- 29,530 · -24.7%
- By 2075
- 20,559 · -47.6%
- By 2100
- 12,144 · -69.0%
Race, ethnicity, and origin ACS 2023
- Neighborhood character
- Predominantly White (74%)
- Race & ethnicity
- White 74% Hispanic / Latino 20% Two or more races 13% Native American 1%
- Hispanic origin (detail)
- Mexican 16%
- Common ancestry
- Slovak 4% Romanian 3% Lithuanian 2%
- Foreign-born
- 6% · Canada
- Languages at home
- 86% English-only · Spanish 11% Other Indo-European 1%
Political lean MEDSL · Montrose
- 2024 margin
- Solid R (+32.6) · D 32.6% · R 65.2% · Other 2.2%
- 2008→2024 swing
- -2.8pp toward R · 2008: -29.8pp · 2024: -32.6pp
- All cycles
- 2024: R+32.6 2020: R+36.5 2016: R+42.1 2012: R+36.4 2008: R+29.8
Not yet ingested
- Civics
- —
Market trends
- HPI YoY
- ▼ -210.94%
- Current HPI
- 373.4909
- Rent YoY
- —
- Metro
- Montrose, CO
- State GDP YoY
- ▲ 1.95%
- F500 in state
- 14
Industry mix (Fortune 500 HQ in CO)
| Industry | F500 HQs | Revenue |
|---|---|---|
| Technology Distribution | 1 | $31B |
|
||
| Food / Agriculture | 1 | $18B |
|
||
| Packaging | 1 | $14B |
|
||
| Healthcare | 1 | $13B |
|
||
| Energy | 1 | $10B |
|
||
| Technology | 1 | $4B |
|
||
Price history
-14.9% since first listed5 events — show timeline
- 2026-05-01 Listed $120,000 cren
- 2025-02-06 Listing Removed — cren
- 2024-11-27 Price Changed $141,000 cren
- 2024-11-21 Price Changed $135,000 cren
- 2024-10-29 Listed $141,000 cren
Property tax history
+10.6%/yrLatest (2025): $563 · +275.7% YoY. Source: county tax records.
Cash-flow waterfall
monthlySold comps — $/sqft
last 12 mo · ≤1 miLoading sold comps…