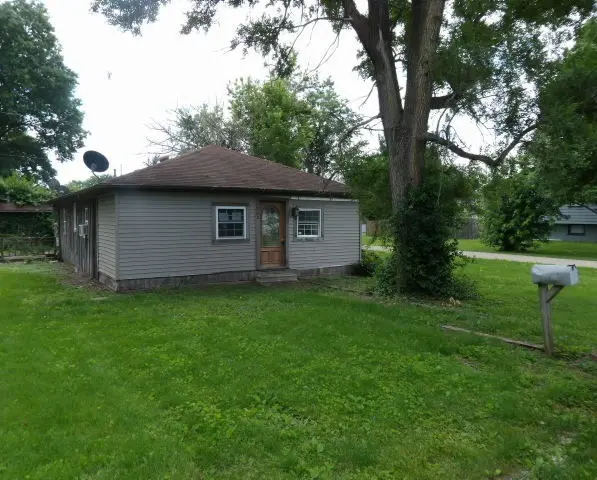
500 E 12th St · Georgetown, IL
Flood risk 1/10 · Minimal
- FEMA flood zone
- X (unshaded)
- Chance of flooding over 30 yrs
- 0.0%
- Est. flood insurance / yr
- $507 – $1,088
Fire risk 1/10 · Minimal
- Est. fire insurance / yr
- $804 – $1,492
Heat risk 3/10 · Minor
- Hot days now (above 103°F)
- 7 days/yr
- Hot days in 30 yrs
- 18 days/yr
Wind risk 2/10 · Minimal
- Chance of severe wind over 30 yrs
- 1.0%
Air-quality risk 2/10 · Minimal
- Unhealthy air days now
- 1 days/yr
- Unhealthy air days in 30 yrs
- 1 days/yr
Risk factors via First Street. Map © Google.
Why this score? — see what drove the C grade
The composite is a weighted blend of 9 inputs, each scored 0–100. Each bar is that input's sub-score; the figure is the points it added to the 100-point composite (weight × sub-score).
- Cash flow +15.0/30.0
- Appreciation +10.0/10.0
- ARV discount +7.5/15.0
- 1% rule +5.0/10.0
- DSCR +5.0/10.0
- Schools +5.0/10.0
- Livability +3.2/5.0
- Rent growth +2.5/5.0
- Condition / age +2.5/5.0
$16,050
🖨 Deal sheet 📄 Offer letter ✓ Due diligence
Listing remarks
Are you looking for a summer project? Check out this 2 bedroom bungalow in Georgetown, that is being sold with the lot next door and a barn! This property is being sold AS-IS. All listing information is taken from public record and is not guaranteed.
Key facts
- Barn
- Lot next door
- Bungalow
Tags
Property features AI
Finance
- Other: Residential zoning (RES)
Exterior
- Utilities: Public water; Public sewer
- Home design: Single-family residence; One story
- Construction: Vinyl siding; Wood siding; Shingle roof; Other foundation; Built as single-level structure
- Exterior features: Deck; Private maintained road access; Private road frontage
Interior
- Kitchen: Oven; Range; Refrigerator
- Bedrooms: Total of 7 rooms (bedroom breakdown not specified)
- Bathrooms: 1 full bathroom
- Heating & cooling: Natural gas heating; Central air conditioning
- Interior features: Gas water heater; Oven; Range; Refrigerator
- Laundry & utility: Laundry on the main level
Neighborhood map
What this means for you Summary
Snapshot
- This is a 2-bed/1.0-bath single-family listed at $16k.
Deal economics
- At list price, monthly cash flow is $782 ($9k/yr) — positive.
- The deal already cash-flows at list — no discount required.
- Meets the 1% rule at list price ($1k rent vs $16k).
Location & tenants
- Location reads 63/100 on livability (#783 in IL) — a middle-class / working-renter tenant base. Strengths: cost of living A+, housing A+, crime A-; Watch: employment D+, schools F, amenities F.
- Market conditions: 2 comparable units currently listed for rent nearby; 8 units permitted in Vermilion County in 2024 (0 in 5+ unit buildings).
Forward outlook
- In year one you build about $2k of equity ($110 loan paydown + $2k appreciation (10.0% local appreciation)).
- Vermilion County population projected at -24% by 2050 — secular population decline; favor cash flow + early exit over multi-decade hold.
- At projected returns (10.0% appreciation + 3.0% rent growth), your $4k cash investment doubles in ~1 year — after that, you're playing with house money.
Negotiation context
- Only 13 days on market — expect competitive offers; lowballing is unlikely to land.
- 3 sale attempts since 2y ago with the ask held roughly flat each time — persistent listings suggest the price (not the market) is what's stuck; bring a comps-based counter.
Risks & watch-outs
- Watch-outs: built in 1900 — expect roof / HVAC / electrical / plumbing capex.
Questions for the listing agent
- Built in 1900 — when were the roof, HVAC, electrical panel, plumbing, and water heater last replaced?
- Is there a deadline driving the sale (1031 exchange, divorce, estate, relocation)? That informs how much negotiation room exists.
- Schools are F-rated, which usually means shorter tenancies and higher turnover. Who's the typical renter profile here, and what's been the actual vacancy rate?
- What's the average days-on-market for RENTAL listings here right now (not sales)? A rising rental-DOM trend means longer vacancies and softer asking-rent achievability than the comps imply.
- What's the recent tenant-quality profile in this submarket — average credit score on applications, eviction rate, late-payment / NSF rate, and stable-employment percentage? A property-management company in the area should have these aggregated.
- How much new for-sale + rental construction is in the pipeline within 1–3 miles? Heavy new supply typically softens prices + rents 12–24 months out; constrained supply supports both.
Investment metrics
- 1% rule
- 7.05% ✓
- Cap rate
- 64.79%
- Cash-on-cash
- 208.93%
- DSCR
- 10.30
- GRM
- 1.2
CMA / ARV
- ARV (on-the-fly)
- $112,158
- Comps found
- 4
Show comp detail 4 sales within ~0.75 mi
| Address | Dist | Beds/Ba | Sqft | Sold | Price | $/sf | Match |
|---|---|---|---|---|---|---|---|
| 600 Guy St | 0.42mi | 2/1.5 | 1,700 (+2%) | 10mo | $89,000 | $52 | 68 |
| 412 E 12th St | 0.06mi | 2/2.0 | 1,872 (+12%) | 17mo | $125,000 | $67 | 59 |
| 312 W 7th St | 0.59mi | 3/2.0 (+1) | 1,712 (+2%) | 3mo | $100,000 | $58 | 57 |
| 412 Panola St | 0.38mi | 3/3.0 (+1) | 1,462 (-13%) | 7mo | $148,000 | $101 | 42 |
Match score weights: distance 35% · size 25% · config 20% · recency 20%. Top-matched comps best support the ARV.
Projected returns pro-forma
10.0% appreciation · 3.0% rent growth · sell at horizon
- IRR
- —
- Equity multiple
- 14.04×
- Total profit
- $58,593
- Equity at exit
- $14,459
- IRR
- —
- Equity multiple
- 30.68×
- Total profit
- $133,391
- Equity at exit
- $31,182
Cash invested: $4,494 (down + closing). Projections, not guarantees.
Landlord ↔ Tenant lean methodology
- Overall (STATE)
- 43 Moderately Tenant-Leaning
- State Illinois
- 43 Moderately Tenant-Leaning · D+7
- County
- — inherits STATE
- City
- — inherits STATE
ZIP-level market 61846
- Home prices YoY
- 9.4%
- Price-to-rent
- 1.2×
Monthly cashflow live
- Estimated rent
- $1,131 medium interval (Pro) →
- Mortgage (P&I)
- −$84
- Tax est. 1.5%
- −$20 /mo · $241/yr
- Insurance
- −$7
- HOA
- −$0
- Vacancy / Maint / Mgmt
- −$237
- Net cashflow
- $782
Break-even live
UW: 25.0% down · 7.5% · 30yr · 1.5% tax · 5.0% vac · 8.0% maint · 8.0% mgmt
Financing live
Cash to close
- Down payment
- $4,012
- Closing costs
- $482
- Reserves months
- —
- Total cash needed
- —
Loan-product check · same deal, 3 products live
Conventional
25% down · 7.5% · 30yr
- Down + closing
- —
- Monthly P&I
- —
- Monthly cashflow
- —
- DSCR
- —
- Eligible?
- —
Personal DTI + credit; lowest rate.
DSCR
20% down · 8.5% · 30yr
- Down + closing
- —
- Monthly P&I
- —
- Monthly cashflow
- —
- DSCR
- —
- Eligible?
- —
No personal income docs; deal must DSCR.
Hard money
10% down · 12.0% · 12mo
- Down + closing
- —
- Monthly P&I
- —
- Monthly cashflow
- —
- DSCR
- —
- Eligible?
- —
Short-term bridge; refi at stabilization.
Rent comps 2 comps
| Address | Beds | Baths | Sqft | Rent | $/sqft | DOM | Units | Dist |
|---|---|---|---|---|---|---|---|---|
| 303 W 12th St Georgetown, IL | 3.0 | 1.0 | 1300 | $1,100 | $0.85 | 5d | 1 | 0.47mi |
| 208 Logan St Georgetown, IL | 3.0 | 1.0 | 1100 | $1,200 | $1.09 | 13d | 1 | 0.89mi |
Listing history 9 events
-
2026-06-18days on market $16,050 Active 13 DOM
-
2026-06-17days on market $16,050 Active 12 DOM
-
2026-06-16days on market $16,050 Active 11 DOM
-
2026-06-15days on market $16,050 Active 10 DOM
-
2026-06-13days on market $16,050 Active 8 DOM
-
2026-06-09days on market $16,050 Active 4 DOM
-
2026-06-08days on market $16,050 Active 3 DOM
-
2026-06-07remarks 250-char remark
-
2026-06-07$16,050 Active 2 DOM
ⓘ Source: listings_history table (triggers on properties + properties_extension) + one-shot
backfill from property_details.listing_events for pre-trigger history.
Climate risk First Street
- Flood 1/10 Low FEMA zone X (unshaded) · 0% chance over 30 yrs
- Wildfire 1/10 Low
- Heat 3/10 Moderate 7 d/yr ≥103°F today · 18 d/yr by 30 yrs out
- Wind 2/10 Low 100% chance of damaging wind over 30 yrs
- Air quality 2/10 Low 1 unhealthy d/yr today · 1 by 30 yrs out
Nearby sold comps map
Loading sold comps map…
Walkable amenities ~0.75 mi
Loading nearby amenities…
Taxation est. · year 1
- Rental income
- $13,570
- − Mortgage interest
- −$899
- − Property taxes
- −$241
- − Insurance
- −$80
- − Repairs & maintenance
- −$1,086
- − Management
- −$1,086
- − Depreciation
- −$467
- Taxable income
- $9,712
- Est. tax owed @ 24.0%
- −$2,331
- After-tax cash flow
- $7,059/yr
For passive investors: Depreciation is non-cash, so a rental often shows a tax loss while cash-flowing — sheltering income. Rental losses are passive: they offset passive income freely, and up to $25,000/yr can offset ordinary (W-2) income if you actively participate and your MAGI is under $100k (phasing out to $0 by $150k); unused losses carry forward. On sale, claimed depreciation is recaptured at up to 25%, and gains may owe capital-gains tax (a 1031 exchange can defer both). Figures are a year-1 estimate at your 24.0% rate — not tax advice; consult a CPA.
Schools (NCES district)
No district data.
Livability — Georgetown
- Score
- 63/100
- State rank
- #783
- US rank
- #15620
Category grades
Schools grade is shown separately in the Schools card above.
Census & demographics
- Census place
- Georgetown, IL
- Population (ZIP)
- 4,484
Population outlook (Vermilion County) Hauer SSP2
- Today (2025)
- 72,775 people
- By 2030
- 69,235 · -4.9%
- By 2040
- 62,360 · -14.3%
- By 2050
- 55,539 · -23.7%
- By 2075
- 40,606 · -44.2%
- By 2100
- 26,985 · -62.9%
Race, ethnicity, and origin ACS 2023
- Neighborhood character
- Predominantly White (89%)
- Race & ethnicity
- White 89% Hispanic / Latino 5% Black 5% Two or more races 4%
- Hispanic origin (detail)
- Mexican 5%
- Common ancestry
- Slovak 2% Serbian 1% Romanian 1%
- Foreign-born
- 1% · Canada
- Languages at home
- 99% English-only · Spanish 1%
Political lean MEDSL · Vermilion
- 2024 margin
- Solid R (+35.7) · D 31.4% · R 67.0% · Other 1.6%
- 2008→2024 swing
- -36.2pp toward R · 2008: 0.6pp · 2024: -35.7pp
- All cycles
- 2024: R+35.7 2020: R+32.9 2016: R+29.2 2012: R+15.7 2008: D+0.6
Not yet ingested
- Civics
- —
Market trends
- HPI YoY
- ▲ 21.78%
- Current HPI
- 254.5489
- Rent YoY
- —
- Metro
- —
- State GDP YoY
- ▲ 1.59%
- F500 in state
- 60
Industry mix (Fortune 500 HQ in IL)
| Industry | F500 HQs | Revenue |
|---|---|---|
| Insurance | 4 | $201B |
|
||
| Consumer Goods | 4 | $87B |
|
||
| Industrial Machinery | 3 | $64B |
|
||
| Healthcare | 2 | $55B |
|
||
| Retail / Pharmacy | 1 | $148B |
|
||
| Agriculture / Food | 1 | $86B |
|
||
Price history
-73.2% since first listed5 events — show timeline
- 2026-06-05 Listed $16,050 CIBR
- 2026-02-06 Listing Removed — MRED as Distributed by MLS Grid
- 2024-11-13 Listed $67,000 CIBR
- 2024-11-12 Listed — MRED as Distributed by MLS Grid
- 2005-03-15 Sold (Public Records) $60,000 Public Records
Property tax history
+5.1%/yrLatest (2024): $1,231 · +10.4% YoY. Source: county tax records.
Cash-flow waterfall
monthlySold comps — $/sqft
last 12 mo · ≤1 miLoading sold comps…