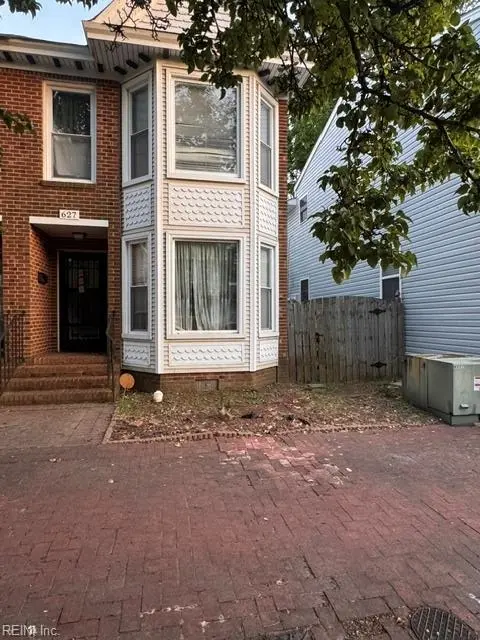
627 South St · Portsmouth, VA
Flood risk 7/10 · Major
- FEMA flood zone
- X (shaded)
- Chance of flooding over 30 yrs
- 0.88%
- Est. flood insurance / yr
- $507 – $1,088
Fire risk 1/10 · Minimal
- Est. fire insurance / yr
- $666 – $1,236
Heat risk 9/10 · Severe
- Hot days now (above 106°F)
- 7 days/yr
- Hot days in 30 yrs
- 16 days/yr
Wind risk 8/10 · Major
- Chance of severe wind over 30 yrs
- 80.0%
Air-quality risk 5/10 · Moderate
- Unhealthy air days now
- 6 days/yr
- Unhealthy air days in 30 yrs
- 7 days/yr
Risk factors via First Street. Map © Google.
Why this score? — see what drove the C+ grade
The composite is a weighted blend of 9 inputs, each scored 0–100. Each bar is that input's sub-score; the figure is the points it added to the 100-point composite (weight × sub-score).
- Cash flow +21.6/30.0
- ARV discount +15.0/15.0
- DSCR +6.9/10.0
- 1% rule +6.0/10.0
- Schools +3.9/10.0
- Livability +3.7/5.0
- Rent growth +3.3/5.0
- Condition / age +2.5/5.0
- Appreciation +0.0/10.0
$130,000
🖨 Deal sheet (PDF) 📄 Offer letter ✓ Due diligence
Listing remarks
Investor Special! Don’t miss this incredible opportunity to bring your vision to life. This property is full of potential and ready for renovation, making it perfect for investors, flippers, or buyers looking to create their dream project. Conveniently located near shopping, dining, major interstates, and local attractions, this home offers strong upside potential in a growing area. With the right updates and repairs, this property could shine again. Sold strictly as-is. Cash or rehab loan preferred. Opportunities like this don’t last long schedule your showing today!
Key facts
- Built 1989
- Listed 2 days
Property features AI
Finance
- HOA & community: No HOA fees
Exterior
- Parking: Off-street parking
- Utilities: City/County water; City/County sewer; Electric water heater
- Home design: Attached townhouse; 2 stories; Crawl foundation; Simple ownership
- Construction: Asphalt shingle roof
- Exterior features: Brick siding; Wood fence
Interior
- Kitchen: Dishwasher; Range; Microwave; Refrigerator
- Bedrooms: No bedroom with full bathroom on the first floor; Total of 5 rooms
- Flooring: Carpet; Ceramic; Vinyl
- Bathrooms: 2 full bathrooms; 1 half bathroom
- Heating & cooling: Heat pump heating; Central air conditioning
- Interior features: One fireplace
- Laundry & utility: Washer and dryer present; Washer hookup; Dryer hookup
Neighborhood map
What this means for you Summary
Snapshot
- This is a 2-bed/2.5-bath townhouse listed at $130k.
Deal economics
- At list price, monthly cash flow is $130 ($2k/yr) — positive.
- The deal already cash-flows at list — no discount required.
- Meets the 1% rule at list price ($1k rent vs $130k).
- Cap rate 8.1% vs local median 4.6% in Portsmouth — top-decile yield for the area; either an underpriced asset or a hidden risk that comps aren't pricing in. Stress-test before assuming the spread holds.
Location & tenants
- Location reads 73/100 on livability (#172 in VA) — a middle-class / working-renter tenant base. Strengths: amenities A+, cost of living A+, housing A+; Watch: employment C-, crime F, commute F.
- Portsmouth City Public School District (urban): math 34% / reading 58% proficiency, ranked #107 of 131 in VA (top 82%) — families likely to look elsewhere, expect single-tenant / working-renter base with shorter leases.
- Zoned schools: Park View Elementary (math 22% / reading 47%, grade F, #966 of 1,108 statewide, top 89%, 463 students, 99% FRL) — zoned schools average 99% FRL vs 60% district-wide (40 pts higher); higher-poverty schools than district average — tighter screening recommended.
- Market conditions: Rents rising (+3.3%/yr); 134 active listings in the ZIP; 40 comparable units currently listed for rent nearby; rentals at typical pace (median 25d on market — plan ~3-4 weeks tenant-placement turnaround); 300 units permitted in Portsmouth city in 2024 (112 in 5+ unit buildings).
- This rent runs 35% of the median local income ($50k/yr) — at the standard rent-burdened threshold; future hikes will face affordability resistance.
Forward outlook
- Local home prices are declining (-3.0%/yr); year-one equity from $899 of loan paydown is wiped out by about $4k of value loss. Plan a longer hold.
Negotiation context
- Only 2 days on market — expect competitive offers; lowballing is unlikely to land.
Risks & watch-outs
- Watch-outs: flood insurance adds $66/mo.
- Climate carrying-cost: major flood risk; severe wind risk, 80% chance of damaging wind over 30y; extreme-heat days projected 7→16/yr by 2055 (HVAC capex compounding) — expect insurance premiums to compound above CPI over the hold.
Questions for the listing agent
- What's the actual annual flood-insurance premium (NFIP or private), and is the property in a SFHA with mandatory coverage?
- Is there a deadline driving the sale (1031 exchange, divorce, estate, relocation)? That informs how much negotiation room exists.
- Schools are B-rated — typically a magnet for longer-tenancy family renters. What's the average tenant stay here, and is there a school-zone premium baked into asking?
- Crime grade is F in this area — have there been break-ins, vandalism, or insurance claims at this property in the last 3 years? What carrier currently insures it and at what premium?
- What's the average days-on-market for RENTAL listings here right now (not sales)? A rising rental-DOM trend means longer vacancies and softer asking-rent achievability than the comps imply.
- What's the recent tenant-quality profile in this submarket — average credit score on applications, eviction rate, late-payment / NSF rate, and stable-employment percentage? A property-management company in the area should have these aggregated.
- How much new for-sale + rental construction is in the pipeline within 1–3 miles? Heavy new supply typically softens prices + rents 12–24 months out; constrained supply supports both.
Investment metrics
- 1% rule
- 1.10% ✓
- Cap rate
- 8.11%
- Cash-on-cash
- 6.48%
- DSCR
- 1.29
- GRM
- 7.6
CMA / ARV
- ARV (on-the-fly)
- $210,240
- Comps found
- 9
Show comp detail 9 sales within ~0.75 mi
| Address | Dist | Beds/Ba | Sqft | Sold | Price | $/sf | Match |
|---|---|---|---|---|---|---|---|
| 333 London St | 0.41mi | 2/2.0 | 1,200 (+3%) | 7mo | $235,000 | $196 | 69 |
| 341 London St | 0.41mi | 2/2.0 | 1,200 (+3%) | 8mo | $220,000 | $183 | 68 |
| 624 Glasgow St | 0.39mi | 2/1.5 | 1,064 (-9%) | 1mo | $225,000 | $211 | 62 |
| 317 London St | 0.40mi | 2/2.0 | 1,250 (+7%) | 7mo | $215,000 | $172 | 62 |
| 707 Twine Ave | 0.65mi | 2/1.5 | 1,152 (-1%) | 3mo | $205,500 | $178 | 61 |
| 111 High St #408 | 0.47mi | 2/2.5 | 1,073 (-8%) | 10mo | $185,000 | $172 | 56 |
| 475 Water St #504 | 0.56mi | 2/2.5 | 1,305 (+12%) | 8mo | $302,000 | $231 | 48 |
| 1 Crawford Pkwy #1006 | 0.61mi | 1/1.5 (-1) | 1,015 (-13%) | 4mo | $125,000 | $123 | 38 |
| 1 Crawford Pkwy #1207 | 0.61mi | 1/1.0 (-1) | 1,000 (-14%) | 12mo | $180,000 | $180 | 27 |
Match score weights: distance 35% · size 25% · config 20% · recency 20%. Top-matched comps best support the ARV.
Projected returns pro-forma
-3.0% appreciation · 3.31% rent growth · sell at horizon
- IRR
- -9.1%
- Equity multiple
- 0.66×
- Total profit
- $-12,242
- Equity at exit
- $19,383
- IRR
- 0.8%
- Equity multiple
- 1.06×
- Total profit
- $2,205
- Equity at exit
- $11,240
Cash invested: $36,400 (down + closing). Projections, not guarantees.
Landlord ↔ Tenant lean methodology
- Overall (STATE)
- 55 Moderately Landlord-Leaning
- State Virginia
- 55 Moderately Landlord-Leaning · D+2
- County
- — inherits STATE
- City
- — inherits STATE
ZIP-level market 23704
- Home prices YoY
- -4.6%
- Rents YoY
- 3.3%
- Active inventory
- 134
- Price-to-rent
- 7.6×
Monthly cashflow live
- Estimated rent
- $1,430 high interval (Pro) →
- Mortgage (P&I)
- −$682
- Tax from tax record
- −$197 /mo · $2,364/yr
- Insurance
- −$54
- Flood insurance flood zone
- −$66 /mo · $798/yr
- HOA
- −$0
- Vacancy / Maint / Mgmt
- −$300
- Net cashflow
- $130
Break-even live
Sensitivity live
| Price | -10% $204 | -5% $167 | +0% $130 | +5% $93 | +10% $57 |
|---|---|---|---|---|---|
| Rent | -10% $17 | -5% $74 | +0% $130 | +5% $187 | +10% $243 |
| Rate | -1.0pp $196 | -0.5pp $163 | base $130 | +0.5pp $97 | +1.0pp $62 |
UW: 25.0% down · 7.5% · 30yr · 1.5% tax · 5.0% vac · 8.0% maint · 8.0% mgmt
Financing live
Cash to close
- Down payment
- $32,500
- Closing costs
- $3,900
- Reserves months
- —
- Total cash needed
- —
Loan-product check · same deal, 3 products live
Conventional
25% down · 7.5% · 30yr
- Down + closing
- —
- Monthly P&I
- —
- Monthly cashflow
- —
- DSCR
- —
- Eligible?
- —
Personal DTI + credit; lowest rate.
DSCR
20% down · 8.5% · 30yr
- Down + closing
- —
- Monthly P&I
- —
- Monthly cashflow
- —
- DSCR
- —
- Eligible?
- —
No personal income docs; deal must DSCR.
Hard money
10% down · 12.0% · 12mo
- Down + closing
- —
- Monthly P&I
- —
- Monthly cashflow
- —
- DSCR
- —
- Eligible?
- —
Short-term bridge; refi at stabilization.
Rent comps 40 comps
| Address | Beds | Baths | Sqft | Rent | $/sqft | DOM | Units | Dist |
|---|---|---|---|---|---|---|---|---|
| 915 Green St Portsmouth, VA | 2.0 | 1.0 | 837 | $1,195 | $1.43 | 44d | 1 | 0.02mi |
| 1003 Green St Unit 1003 Portsmouth, VA | 2.0 | 1.5 | 837 | $1,195 | $1.43 | 24d | 1 | 0.06mi |
| 1029 Green St Portsmouth, VA | 2.0 | 1.5 | 802 | $1,199 | $1.50 | 18d | 1 | 0.09mi |
| 533 Columbia St Portsmouth, VA | 2.0 | 2.0 | 1110 | $1,495 | $1.35 | 44d | 1 | 0.11mi |
| 531 County St Unit 3 Portsmouth, VA | 1.0 | 1.0 | 725 | $900 | $1.24 | 13d | 1 | 0.14mi |
| 531 County St Unit 3 Portsmouth, VA | 1.0 | 1.0 | 725 | $900 | $1.24 | 8d | 1 | 0.14mi |
| 710 Dinwiddie St Portsmouth, VA | 1.0 | 1.0 | 850 | $1,150 | $1.35 | 4d | 1 | 0.17mi |
| 622 Effingham St Portsmouth, VA | 2.0–3.0 | 1.5–2.0 | 1027 | $507 | $0.49 | 24d | 2 | 0.19mi |
| 714 King St Portsmouth, VA | 2.0 | 2.0 | 935 | $1,899 | $2.03 | 44d | 1 | 0.21mi |
| 605 Dinwiddie St Unit B Portsmouth, VA | 2.0 | 1.0 | 900 | $1,650 | $1.83 | 44d | 1 | 0.22mi |
| 507 High St Portsmouth, VA | 1.0 | 1.0 | 686 | $1,474 | $2.15 | 4d | 1 | 0.25mi |
| 800 Crawford St Portsmouth, VA | 1.0 | 1.0 | 825 | $1,599 | $1.94 | 24d | 1 | 0.37mi |
| 811 Randolph St Unit A Portsmouth, VA | 2.0 | 1.0 | 800 | $1,150 | $1.44 | 44d | 1 | 0.42mi |
| 1100 High St Portsmouth, VA | 2.0–3.0 | 1.5–2.0 | 1003 | $1,010 | $1.01 | 3d | 5 | 0.43mi |
| 923 Randolph St Portsmouth, VA | 2.0 | 1.0 | 800 | $1,062 | $1.33 | 44d | 1 | 0.45mi |
| 111 High St #409 Portsmouth, VA | 2.0 | 2.5 | 1078 | $2,500 | $2.32 | 8d | 1 | 0.48mi |
| 412 North St Portsmouth, VA | 2.0 | 1.0 | 850 | $1,415 | $1.66 | 24d | 2 | 0.49mi |
| 303 North St #2 Portsmouth, VA | 1.0 | 1.0 | 800 | $1,224 | $1.53 | 15d | 1 | 0.51mi |
| 320 Dinwiddie St Portsmouth, VA | 1.0 | 1.0 | 700 | $1,150 | $1.64 | 24d | 1 | 0.52mi |
| 941 Holladay St Portsmouth, VA | 1.0 | 1.0 | 720 | $900 | $1.25 | 44d | 1 | 0.53mi |
| 359 Middle St Portsmouth, VA | 1.0 | 1.0 | 700 | $1,150 | $1.64 | 44d | 1 | 0.53mi |
| 1140 London Blvd Portsmouth, VA | 2.0 | 2.0 | 1016 | $1,902 | $1.87 | 4d | 1 | 0.56mi |
| 303 Effingham St Unit S-2F Portsmouth, VA | 3.0 | 2.0 | 1122 | $1,950 | $1.74 | 24d | 1 | 0.59mi |
| 303 Effingham St Unit N-2K Portsmouth, VA | 2.0 | 1.0 | 872 | $1,375 | $1.58 | 24d | 1 | 0.59mi |
| 303 Effingham St Portsmouth, VA | 2.0 | 1.0 | 872 | $1,385 | $1.59 | 44d | 1 | 0.59mi |
| 303 Effingham St Unit S-6E Portsmouth, VA | 2.0 | 1.0 | 879 | $1,360 | $1.55 | 24d | 1 | 0.59mi |
| 303 Effingham St Portsmouth, VA | 1.0–3.0 | 1.0–2.0 | 863 | $1,500 | $1.74 | 17d | 11 | 0.59mi |
| 1447 Talley Cir Portsmouth, VA | 3.0 | 2.5 | 1440 | $2,000 | $1.39 | 24d | 1 | 0.67mi |
| 1416 Richmond Ave Portsmouth, VA | 2.0 | 1.0 | 1024 | $1,150 | $1.12 | 44d | 1 | 0.69mi |
| 1802 Atlanta Ave Unit 2 Portsmouth, VA | 2.0 | 1.0 | 1200 | $1,500 | $1.25 | 24d | 1 | 0.71mi |
| 2007 Elm Ave Portsmouth, VA | 3.0 | 1.0 | 903 | $1,300 | $1.44 | 21d | 1 | 0.71mi |
| 548 Madison St Portsmouth, VA | 2.0 | 1.0 | 900 | $1,349 | $1.50 | 17d | 3 | 0.76mi |
| 548 Madison St Portsmouth, VA | 1.0 | 1.0 | 750 | $1,249 | $1.67 | 44d | 1 | 0.76mi |
| 548 Madison St Unit 54311--D Portsmouth, VA | 1.0 | 1.0 | 750 | $1,249 | $1.67 | 24d | 1 | 0.77mi |
| 548 Madison St Unit 542-21-C Portsmouth, VA | 2.0 | 1.0 | 900 | $1,349 | $1.50 | 24d | 1 | 0.77mi |
| 850 Crawford Pkwy Portsmouth, VA | 1.0–2.0 | 1.0–2.0 | 944 | $2,119 | $2.24 | 3d | 6 | 0.77mi |
| 818 Coolidge St Portsmouth, VA | 2.0 | 1.0 | 1230 | $2,100 | $1.71 | 44d | 1 | 0.81mi |
| 2111 Atlanta Ave Portsmouth, VA | 3.0 | 2.0 | 1418 | $2,395 | $1.69 | 44d | 1 | 0.82mi |
| 129 Elm Ave Portsmouth, VA | 3.0 | 1.5 | 1160 | $2,600 | $2.24 | 44d | 1 | 0.84mi |
| 130 Riverview Ave Unit A Downstairs Portsmouth, VA | 2.0 | 1.0 | 975 | $1,475 | $1.51 | 4d | 1 | 0.85mi |
Listing history 2 events
-
2026-05-21status Under Contract
-
2026-05-18$130,000 Active
ⓘ Source: listings_history table (triggers on properties + properties_extension) + one-shot
backfill from property_details.listing_events for pre-trigger history.
Tax reassessment forecast VA · Resets to sale price
- Current annual tax
- $2,364 · $197/mo
- Projected year-2 tax
- $2,364 · $197/mo
- Expected delta
- $0/yr ($0/mo · 0.0%)
ⓘ Screening estimate from a state-policy table — verify with the county assessor before closing.
Climate risk First Street
- Flood 7/10 Severe FEMA zone X (shaded) · 88% chance over 30 yrs
- Wildfire 1/10 Low
- Heat 9/10 Extreme 7 d/yr ≥106°F today · 16 d/yr by 30 yrs out
- Wind 8/10 Severe 80% chance of damaging wind over 30 yrs
- Air quality 5/10 Major 6 unhealthy d/yr today · 7 by 30 yrs out
Nearby sold comps map
Loading sold comps map…
Walkable amenities ~0.75 mi
Loading nearby amenities…
Taxation est. · year 1
- Rental income
- $17,158
- − Mortgage interest
- −$7,282
- − Property taxes
- −$2,364
- − Insurance
- −$1,448
- − Repairs & maintenance
- −$1,373
- − Management
- −$1,373
- − Depreciation
- −$3,782
- Taxable loss
- −$463
- Est. tax savings @ 24.0%
- +$111
- After-tax cash flow
- $1,673/yr
For passive investors: Depreciation is non-cash, so a rental often shows a tax loss while cash-flowing — sheltering income. Rental losses are passive: they offset passive income freely, and up to $25,000/yr can offset ordinary (W-2) income if you actively participate and your MAGI is under $100k (phasing out to $0 by $150k); unused losses carry forward. On sale, claimed depreciation is recaptured at up to 25%, and gains may owe capital-gains tax (a 1031 exchange can defer both). Figures are a year-1 estimate at your 24.0% rate — not tax advice; consult a CPA.
Schools (NCES district)
- District
- Portsmouth City Public School District
- NCES district ID
- 5103000
- Math proficiency
- 34% ▼ -40.00%
- Reading proficiency
- 58% ▼ -12.00%
- Median HH income
- $46,152
- Composite
- 39.01/100
- National rank
- #4071
- State rank
- #107 of 131 in VA
Livability — Portsmouth
- Score
- 73/100
- State rank
- #172
- US rank
- #5381
Category grades
Schools grade is shown separately in the Schools card above.
Census & demographics
- Census place
- Portsmouth, VA
- County
- Portsmouth City · 96,366 people
- City population
- 96,366
- Metro
- Virginia Beach-Norfolk-Newport News, VA-NC
- Population (ZIP)
- 19,207
- Household income
- $49,583
- Rent vs Own
- Severe rent burden
- 1727.0
Population outlook (Portsmouth County) Hauer SSP2
- Today (2025)
- 96,730 people
- By 2030
- 96,760 · +0.0%
- By 2040
- 96,573 · -0.2%
- By 2050
- 95,606 · -1.2%
- By 2075
- 93,579 · -3.3%
- By 2100
- 83,756 · -13.4%
Race, ethnicity, and origin ACS 2023
- Neighborhood character
- Predominantly Black (66%)
- Race & ethnicity
- Black 66% White 24% Two or more races 6% Hispanic / Latino 4% Asian 2%
- Common ancestry
- Slovak 1% Romanian 1% Lithuanian 1%
- Foreign-born
- 2% · Canada
- Languages at home
- 96% English-only · Spanish 2%
Political lean MEDSL · Portsmouth
- 2024 margin
- Solid D (+38.6) · D 68.6% · R 30.0% · Other 1.4%
- 2008→2024 swing
- -0.7pp no change · 2008: 39.3pp · 2024: 38.6pp
- All cycles
- 2024: D+38.6 2020: D+40.8 2016: D+36.5 2012: D+39.6 2008: D+39.3
Not yet ingested
- Civics
- —
Market trends
- HPI YoY
- ▼ -15.69%
- Current HPI
- 322.7335
- Rent YoY
- ▲ 3.31%
- Metro
- Virginia Beach-Norfolk-Newport News, VA-NC
- State GDP YoY
- ▲ 2.40%
- F500 in state
- 50
Industry mix (Fortune 500 HQ in VA)
| Industry | F500 HQs | Revenue |
|---|---|---|
| Aerospace / Defense | 4 | $236B |
|
||
| Technology / Defense | 3 | $32B |
|
||
| Financial Services | 2 | $176B |
|
||
| Utilities | 2 | $27B |
|
||
| Insurance | 2 | $25B |
|
||
| Technology | 2 | $15B |
|
||
Price history
2 events — show timeline
- 2026-05-21 Pending — REINMLS
- 2026-05-18 Listed $130,000 REINMLS
Property tax history
+2.2%/yrLatest (2025): $2,364 · +0.8% YoY. Source: county tax records.
Cash-flow waterfall
monthlySold comps — $/sqft
last 12 mo · ≤1 miLoading sold comps…