 Multi-family
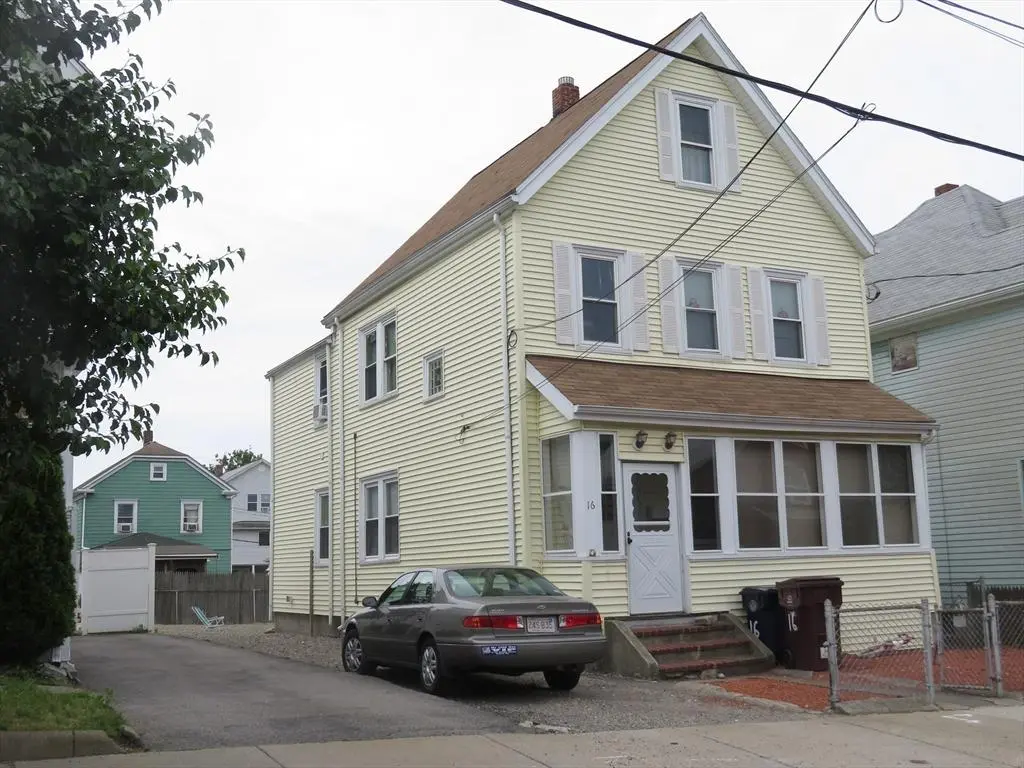
16 Woodville St · Everett, MA
Flood risk 1/10 · Minimal
- FEMA flood zone
- X (unshaded)
- Chance of flooding over 30 yrs
- 0.0%
- Est. flood insurance / yr
- $473 – $860
Fire risk 1/10 · Minimal
- Est. fire insurance / yr
- $915 – $1,699
Heat risk 6/10 · Moderate
- Hot days now (above 96°F)
- 7 days/yr
- Hot days in 30 yrs
- 15 days/yr
Wind risk 6/10 · Moderate
- Chance of severe wind over 30 yrs
- 67.0%
Air-quality risk 3/10 · Minor
- Unhealthy air days now
- 3 days/yr
- Unhealthy air days in 30 yrs
- 3 days/yr
Risk factors via First Street. Map © Google.
Why this score? — see what drove the C- grade
The composite is a weighted blend of 9 inputs, each scored 0–100. Each bar is that input's sub-score; the figure is the points it added to the 100-point composite (weight × sub-score).
- Cash flow +19.6/30.0
- ARV discount +10.9/15.0
- DSCR +6.2/10.0
- 1% rule +4.7/10.0
- Livability +4.0/5.0
- Rent growth +3.0/5.0
- Condition / age +2.5/5.0
- Schools +1.8/10.0
- Appreciation +0.0/10.0
$769,000
🖨 Deal sheet 📄 Offer letter ✓ Due diligence
Multi-family units
County records classify this as Multi-Family (2-4 Unit). Listing-text estimate: 1 unit. estimate disagrees with records
Listing remarks MLS
Perfect for Owner-Occupant or Investor! Ideal location off Main Street for transportation to Orange Line Train Stations, Encore Casino, Shopping Centers, public schools and recreational facilities. Ideally located for easy drive to Downtown Boston, Logan Airport and Highways. Large level lot provides parking for many cars or your creativity to make the large yard yours. The third floor provides lots of extra storage space. Owner has Lead Paint Certificates. Electric with 200 amps was new about 8 years ago. Most plumbing was all new about 8 years ago. New heating systems were also installed about 8 years ago. Both tenants have no lease.
Key facts
- Extra storage space
- Large level lot
- New heating systems
Tags
Neighborhood map
What this means for you Summary
Snapshot
- This is a 2-bed/2.0-bath multifamily listed at $769k.
Deal economics
- At list price, monthly cash flow is $889 ($11k/yr) — positive.
- The deal already cash-flows at list — no discount required.
- To meet the 1% rule (rent ≥ 1% of price), the offer needs to be $748k (2.7% below list).
- Recommended offer: $723k (6.0% below list) — sets the bar for market timing.
- Cap rate 7.7% vs local median 3.8% in Everett — top-decile yield for the area; either an underpriced asset or a hidden risk that comps aren't pricing in. Stress-test before assuming the spread holds.
Location & tenants
- Location reads 80/100 on livability (#35 in MA, #1,665 nationally) — a professional / high-income tenant draw. Strengths: amenities A+, commute A+, health & safety A+; Watch: cost of living F.
- Everett (suburban): math 15% / reading 26% proficiency, ranked #289 of 302 in MA (top 96%) — low school quality limits family demand, transient renter base, plan for 1-2y turnover; 69% free/reduced lunch — lower-income household profile, screen leases tightly.
- Market conditions: Rents rising (+2.0%/yr); 45 active listings in the ZIP; 40 comparable units currently listed for rent nearby; rentals at typical pace (median 24d on market — plan ~3-4 weeks tenant-placement turnaround); 48% of comp listings sitting > 30 days — soft ceiling on asking rent; solid renter incomes; 3,670 units permitted in Middlesex County in 2024 (2,611 in 5+ unit buildings).
- At $7,481/mo this rent would consume 105% of the median local household income ($85k/yr) (locally 2888% of renters already pay >50% of income on rent) — very limited rent-growth headroom before tenants either downsize or default.
Forward outlook
- Local home prices are declining (-3.0%/yr); year-one equity from $5k of loan paydown is wiped out by about $23k of value loss. Plan a longer hold.
- Middlesex County population projected at +20% by 2050 — long-run rental-demand tailwind backs the buy-and-hold thesis.
Negotiation context
- It's been on market 63 days — a 6% lower offer ($723k) is reasonable based on typical stale-listing flexibility.
Risks & watch-outs
- Watch-outs: built in 1890 — expect roof / HVAC / electrical / plumbing capex.
- Climate carrying-cost: major wind risk, 67% chance of damaging wind over 30y; extreme-heat days projected 7→15/yr by 2055 (HVAC capex compounding) — expect insurance premiums to compound above CPI over the hold.
Questions for the listing agent
- It's been on market 63 days. Have you received any prior offers? Is the seller open to a 6% concession, seller financing, or rate buy-down credit?
- Built in 1890 — when were the roof, HVAC, electrical panel, plumbing, and water heater last replaced?
- Why hasn't it sold? Are there any deal-killer items the seller is aware of (foundation, flood, title, zoning, code violations)?
- Is there a deadline driving the sale (1031 exchange, divorce, estate, relocation)? That informs how much negotiation room exists.
- What's the average days-on-market for RENTAL listings here right now (not sales)? A rising rental-DOM trend means longer vacancies and softer asking-rent achievability than the comps imply.
- What's the recent tenant-quality profile in this submarket — average credit score on applications, eviction rate, late-payment / NSF rate, and stable-employment percentage? A property-management company in the area should have these aggregated.
- How much new apartment / multifamily construction is in the pipeline within 1–3 miles? Heavy new supply (>2% of stock underway) typically softens rents 12–24 months out; light construction supports rent growth.
Investment metrics
- 1% rule
- 0.97% ✗
- Cap rate
- 7.68%
- Cash-on-cash
- 4.95%
- DSCR
- 1.22
- GRM
- 8.6
CMA / ARV
- ARV (median comp)
- $831,234
- List price
- $769,000
- Delta
- -7.49%
- Verdict
- FAIR
- Comps
- 20 within 1.0 mi
Show comp detail 3 sales within ~0.75 mi
| Address | Dist | Beds/Ba | Sqft | Sold | Price | $/sf | Match |
|---|---|---|---|---|---|---|---|
| 63 Woodville St | 0.11mi | 2/2.0 | 1,874 (-1%) | 1mo | $635,000 | $339 | 92 |
| 11 Hancock Ter | 0.35mi | 2/2.0 | 1,945 (+3%) | 24mo | $735,000 | $378 | 60 |
| 1 Blake Ct | 0.36mi | 3/2.0 (+1) | 1,792 (-6%) | 18mo | $760,000 | $424 | 54 |
Match score weights: distance 35% · size 25% · config 20% · recency 20%. Top-matched comps best support the ARV.
Projected returns pro-forma
-3.0% appreciation · 2.03% rent growth · sell at horizon
- IRR
- -9.7%
- Equity multiple
- 0.65×
- Total profit
- $-75,304
- Equity at exit
- $114,660
- IRR
- -1.6%
- Equity multiple
- 0.90×
- Total profit
- $-22,058
- Equity at exit
- $66,489
Cash invested: $215,320 (down + closing). Projections, not guarantees.
Landlord ↔ Tenant lean methodology
- Overall (STATE)
- 20 Strongly Tenant-Friendly
- State Massachusetts
- 20 Strongly Tenant-Friendly · D+15
- County
- — inherits STATE
- City
- — inherits STATE
ZIP-level market 02149
- Home prices YoY
- -24.2%
- Rents YoY
- 2.0%
- Active inventory
- 45
- Price-to-rent
- 25.7×
Monthly cashflow live
- Estimated rent
- $7,481 high interval (Pro) →
- Mortgage (P&I)
- −$4,033
- Tax from tax record
- −$668 /mo · $8,017/yr
- Insurance
- −$320
- HOA
- −$0
- Vacancy / Maint / Mgmt
- −$1,571
- Net cashflow
- $889
Break-even live
3-unit breakdown (identical units grouped — click to expand)
| Units | Beds | Baths | Est. rent |
|---|---|---|---|
| 3× units | 2 | 1 | $7,482 |
| #1 | 2 | 1 | $2,494 |
| #2 | 2 | 1 | $2,494 |
| #3 | 2 | 1 | $2,494 |
| Total (3 units) | $7,481 | ||
UW: 25.0% down · 7.5% · 30yr · 1.5% tax · 5.0% vac · 8.0% maint · 8.0% mgmt
Financing live
Cash to close
- Down payment
- $192,250
- Closing costs
- $23,070
- Reserves months
- —
- Total cash needed
- —
Loan-product check · same deal, 3 products live
Conventional
25% down · 7.5% · 30yr
- Down + closing
- —
- Monthly P&I
- —
- Monthly cashflow
- —
- DSCR
- —
- Eligible?
- —
Personal DTI + credit; lowest rate.
DSCR
20% down · 8.5% · 30yr
- Down + closing
- —
- Monthly P&I
- —
- Monthly cashflow
- —
- DSCR
- —
- Eligible?
- —
No personal income docs; deal must DSCR.
Hard money
10% down · 12.0% · 12mo
- Down + closing
- —
- Monthly P&I
- —
- Monthly cashflow
- —
- DSCR
- —
- Eligible?
- —
Short-term bridge; refi at stabilization.
Rent comps 40 comps
| Address | Beds | Baths | Sqft | Rent | $/sqft | DOM | Units | Dist |
|---|---|---|---|---|---|---|---|---|
| 139 Bucknam St Unit R Everett, MA | 3.0 | 2.0 | 1750 | $3,200 | $1.83 | 43d | 1 | 0.22mi |
| 120 Wyllis Ave Everett, MA | 2.0 | 2.0 | 1257 | $3,300 | $2.63 | 20d | 1 | 0.26mi |
| 289 Main St Unit 2 Everett, MA | 3.0 | 1.0 | 1230 | $3,700 | $3.01 | 43d | 1 | 0.26mi |
| 11 Stuart St Everett, MA | 3.0 | 1.0 | 1283 | $3,300 | $2.57 | 23d | 1 | 0.30mi |
| 121 Main St Unit 1 Malden, MA | 3.0 | 1.0 | 1400 | $2,900 | $2.07 | 43d | 1 | 0.37mi |
| 88 Cleveland Ave Everett, MA | 3.0 | 1.0 | 1300 | $3,300 | $2.54 | 43d | 1 | 0.42mi |
| 88 Cross St Unit 1 Malden, MA | 3.0 | 1.0 | 1600 | $3,300 | $2.06 | 43d | 1 | 0.46mi |
| 133 Walnut St Unit 2 Malden, MA | 2.0 | 1.0 | 1400 | $2,625 | $1.88 | 24d | 1 | 0.51mi |
| 201 Belmont St Unit B Everett, MA | 3.0 | 3.0 | 1300 | $3,500 | $2.69 | 43d | 1 | 0.53mi |
| 42 Vernal St Everett, MA | 3.0 | 1.5 | 1300 | $3,300 | $2.54 | 20d | 1 | 0.54mi |
| 403 Ferry St Unit 2 Malden, MA | 3.0 | 1.0 | 1445 | $2,800 | $1.94 | 43d | 1 | 0.60mi |
| 150 Rivers Edge Dr Medford, MA | 1.0–3.0 | 1.0–2.0 | 1055 | $4,155 | $3.94 | 1d | 4 | 0.64mi |
| 7 Hawthorne St #2 Everett, MA | 3.0 | 2.0 | 1500 | $3,200 | $2.13 | 43d | 1 | 0.64mi |
| 163 Ferry St Malden, MA | 3.0 | 2.0 | 1400 | $3,650 | $2.61 | 43d | 1 | 0.66mi |
| 44 School St Everett, MA | 1.0 | 1.0 | 1250 | $2,800 | $2.24 | 43d | 1 | 0.73mi |
| 18 West St Unit A Everett, MA | 3.0 | 1.0 | 1428 | $2,990 | $2.09 | 14d | 1 | 0.73mi |
| 41 Avon St Unit 2 Malden, MA | 3.0 | 1.0 | 1300 | $3,000 | $2.31 | 24d | 1 | 0.74mi |
| 320 Middlesex Ave Medford, MA | 1.0–2.0 | 1.0–2.0 | 1127 | $4,600 | $4.08 | 3d | 2 | 0.87mi |
| 320 Middlesex Ave Medford, MA | 1.0–2.0 | 1.0–2.0 | 1249 | $4,500 | $3.60 | 43d | 3 | 0.87mi |
| 320 Middlesex Ave Medford, MA | 1.0–2.0 | 1.0–2.0 | 1127 | $4,600 | $4.08 | 5d | 3 | 0.87mi |
| 20 Fairmount St Unit 1 Everett, MA | 2.0 | 1.0 | 1400 | $2,500 | $1.79 | 24d | 1 | 0.87mi |
| 188 Middlesex Ave Unit 188 Medford, MA | 3.0 | 2.0 | 1800 | $4,500 | $2.50 | 43d | 1 | 0.87mi |
| 210 Broadway #404 Everett, MA | 2.0 | 2.0 | 1373 | $3,800 | $2.77 | 16d | 1 | 0.90mi |
| 25 Charlton St Everett, MA | 3.0 | 1.0–2.0 | 970 | $3,632 | $3.74 | 2d | 28 | 0.92mi |
| 30 Revere Beach Pkwy Medford, MA | 2.0–3.0 | 2.0 | 1725 | $3,300 | $1.91 | 43d | 1 | 0.96mi |
| 39 Richardson St Malden, MA | 3.0 | 2.0 | 1368 | $4,300 | $3.14 | 43d | 1 | 0.99mi |
| 99 Florence St Malden, MA | 1.0–2.0 | 1.0–2.5 | 1176 | $2,800 | $2.38 | 4d | 9 | 1.00mi |
| 894 Fellsway Medford, MA | 3.0 | 2.0 | 1800 | $3,800 | $2.11 | 20d | 1 | 1.03mi |
| 50 Station Lndg Medford, MA | 3.0 | 1.0–2.0 | 1039 | $4,446 | $4.28 | 1d | 24 | 1.05mi |
| 115 Clarence St #2 Everett, MA | 3.0 | 1.0 | 1500 | $3,500 | $2.33 | 18d | 1 | 1.06mi |
| 343 Highland Ave Unit 1 Malden, MA | 3.0 | 1.5 | 1400 | $2,600 | $1.86 | 5d | 1 | 1.08mi |
| 22 Auburn St #1 Malden, MA | 3.0 | 1.0 | 1300 | $2,850 | $2.19 | 44d | 1 | 1.08mi |
| 48 Spring St Unit 2 Malden, MA | 3.0 | 2.0 | 1500 | $3,500 | $2.33 | 16d | 1 | 1.09mi |
| 14 Summer St Malden, MA | 2.0 | 1.0–2.0 | 878 | $3,769 | $4.29 | 2d | 13 | 1.09mi |
| 58 Maple St Unit 2 Malden, MA | 3.0 | 1.0 | 1500 | $2,900 | $1.93 | 43d | 1 | 1.17mi |
| 100 Station Lndg #902 Medford, MA | 2.0 | 2.0 | 1262 | $3,700 | $2.93 | 43d | 1 | 1.18mi |
| 34 Porter St Apt 2 Malden, MA | 3.0 | 1.0 | 1242 | $2,900 | $2.33 | 43d | 1 | 1.23mi |
| 1760 Revere Beach Pkwy Everett, MA | 1.0–3.0 | 1.0–2.0 | 997 | $3,422 | $3.43 | 1d | 22 | 1.32mi |
| 337 2nd St Everett, MA | 3.0 | 1.0–2.0 | 1076 | $4,627 | $4.30 | 1d | 70 | 1.33mi |
| 30 Lawrence St Unit 2 Everett, MA | 3.0 | 1.0 | 1625 | $3,200 | $1.97 | 43d | 1 | 1.36mi |
Listing history 15 events
-
2026-06-18days on market $769,000 Active 63 DOM
-
2026-06-17days on market $769,000 Active 62 DOM
-
2026-06-16days on market $769,000 Active 61 DOM
-
2026-06-15days on market $769,000 Active 60 DOM
-
2026-06-13days on market $769,000 Active 58 DOM
-
2026-06-13days on market $769,000 Active 57 DOM
-
2026-06-09days on market $769,000 Active 54 DOM
-
2026-06-08days on market $769,000 Active 53 DOM
-
2026-06-07days on market $769,000 Active 52 DOM
-
2026-06-04days on market $769,000 Active 49 DOM
-
2026-06-03days on market $769,000 Active 48 DOM
-
2026-06-02days on market $769,000 Active 47 DOM
-
2026-06-01days on market $769,000 Active 46 DOM
-
2026-05-31days on market $769,000 Active 45 DOM
-
2026-04-16$769,000 New 644-char remark
Show marketing remark (644 chars)
Perfect for Owner-Occupant or Investor! Ideal location off Main Street for transportation to Orange Line Train Stations, Encore Casino, Shopping Centers, public schools and recreational facilities. Ideally located for easy drive to Downtown Boston, Logan Airport and Highways. Large level lot provides parking for many cars or your creativity to make the large yard yours. The third floor provides lots of extra storage space. Owner has Lead Paint Certificates. Electric with 200 amps was new about 8 years ago. Most plumbing was all new about 8 years ago. New heating systems were also installed about 8 years ago. Both tenants have no lease.
ⓘ Source: listings_history table (triggers on properties + properties_extension) + one-shot
backfill from property_details.listing_events for pre-trigger history.
Tax reassessment forecast MA · Partial reset (capped growth)
- Current annual tax
- $8,017 · $668/mo
- Projected year-2 tax
- $8,738 · $728/mo
- Expected delta
- +$721/yr (+$60/mo · 9.0%)
ⓘ Screening estimate from a state-policy table — verify with the county assessor before closing.
Climate risk First Street
- Flood 1/10 Low FEMA zone X (unshaded) · 0% chance over 30 yrs
- Wildfire 1/10 Low
- Heat 6/10 Major 7 d/yr ≥96°F today · 15 d/yr by 30 yrs out
- Wind 6/10 Major 67% chance of damaging wind over 30 yrs
- Air quality 3/10 Moderate 3 unhealthy d/yr today · 3 by 30 yrs out
Nearby sold comps map
Loading sold comps map…
Walkable amenities ~0.75 mi
Loading nearby amenities…
Taxation est. · year 1
- Rental income
- $89,772
- − Mortgage interest
- −$43,076
- − Property taxes
- −$8,017
- − Insurance
- −$3,845
- − Repairs & maintenance
- −$7,182
- − Management
- −$7,182
- − Depreciation
- −$22,371
- Taxable loss
- −$1,900
- Est. tax savings @ 24.0%
- +$456
- After-tax cash flow
- $11,121/yr
For passive investors: Depreciation is non-cash, so a rental often shows a tax loss while cash-flowing — sheltering income. Rental losses are passive: they offset passive income freely, and up to $25,000/yr can offset ordinary (W-2) income if you actively participate and your MAGI is under $100k (phasing out to $0 by $150k); unused losses carry forward. On sale, claimed depreciation is recaptured at up to 25%, and gains may owe capital-gains tax (a 1031 exchange can defer both). Figures are a year-1 estimate at your 24.0% rate — not tax advice; consult a CPA.
Schools (NCES district)
- District
- Everett
- NCES district ID
- 2504770
- Math proficiency
- 15% ▼ -22.00%
- Reading proficiency
- 26% ▼ -12.00%
- Median HH income
- $51,780
- Composite
- 18.46/100
- National rank
- #8926
- State rank
- #289 of 302 in MA
Livability — Everett
- Score
- 80/100
- State rank
- #35
- US rank
- #1665
Category grades
Schools grade is shown separately in the Schools card above.
Census & demographics
- Census place
- Everett, MA
- County
- Middlesex County · 1,437,704 people
- City population
- 50,045
- Metro
- Boston-Cambridge-Newton, MA-NH
- Population (ZIP)
- 50,045
- Household income
- $85,218
- Rent vs Own
- Severe rent burden
- 2888.0
Population outlook (Middlesex County) Hauer SSP2
- Today (2025)
- 1,740,269 people
- By 2030
- 1,817,187 · +4.4%
- By 2040
- 1,963,195 · +12.8%
- By 2050
- 2,087,461 · +20.0%
- By 2075
- 2,344,036 · +34.7%
- By 2100
- 2,383,776 · +37.0%
Race, ethnicity, and origin ACS 2023
- Neighborhood character
- Highly diverse neighborhood (Simpson 0.74)
- Race & ethnicity
- White 38% Hispanic / Latino 31% Two or more races 23% Black 12% Asian 8%
- Hispanic origin (detail)
- Mexican 1% Puerto Rican 4%
- Common ancestry
- Estonian 10% Hispanic 5% Russian 3%
- Foreign-born
- 45% · Canada, Vietnam, China
- Languages at home
- 37% English-only · Spanish 26% Other Indo-European 22% French/Haitian/Cajun 8%
Political lean MEDSL · Middlesex
- 2024 margin
- Solid D (+39.5) · D 68.5% · R 29.0% · Other 2.5%
- 2008→2024 swing
- +9.3pp toward D · 2008: 30.1pp · 2024: 39.5pp
- All cycles
- 2024: D+39.5 2020: D+45.2 2016: D+38.1 2012: D+26.9 2008: D+30.1
Not yet ingested
- Civics
- —
Market trends
- HPI YoY
- ▼ -115.43%
- Current HPI
- 361.8972
- Rent YoY
- ▲ 2.03%
- Metro
- Boston-Cambridge-Newton, MA-NH
- State GDP YoY
- ▲ 2.28%
- F500 in state
- 38
Industry mix (Fortune 500 HQ in MA)
| Industry | F500 HQs | Revenue |
|---|---|---|
| Technology | 3 | $17B |
|
||
| Insurance | 2 | $84B |
|
||
| Retail | 2 | $76B |
|
||
| Life Sciences | 1 | $43B |
|
||
| Energy Technology | 1 | $31B |
|
||
| Aerospace / Defense | 1 | $18B |
|
||
Price history
1 event — show timeline
- 2026-04-16 Listed $769,000 MLS PIN
Property tax history
+7.0%/yrLatest (2025): $8,017 · +12.5% YoY. Source: county tax records.
Cash-flow waterfall
monthlySold comps — $/sqft
last 12 mo · ≤1 miLoading sold comps…