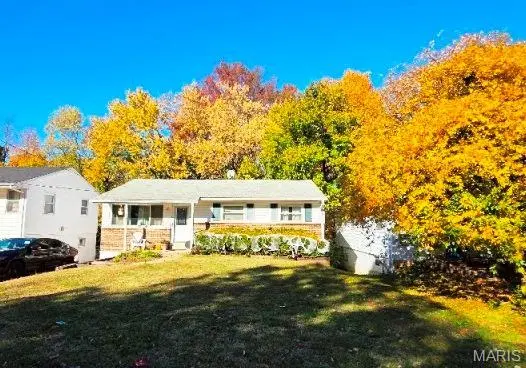
13 Barto Dr · Calverton Park, MO
Flood risk 1/10 · Minimal
- FEMA flood zone
- X (unshaded)
- Chance of flooding over 30 yrs
- 0.0%
- Est. flood insurance / yr
- $473 – $860
Fire risk 1/10 · Minimal
- Est. fire insurance / yr
- $1,054 – $1,958
Heat risk 4/10 · Minor
- Hot days now (above 106°F)
- 7 days/yr
- Hot days in 30 yrs
- 20 days/yr
Wind risk 2/10 · Minimal
- Chance of severe wind over 30 yrs
- 1.0%
Air-quality risk 3/10 · Minor
- Unhealthy air days now
- 3 days/yr
- Unhealthy air days in 30 yrs
- 5 days/yr
Risk factors via First Street. Map © Google.
Why this score? — see what drove the B- grade
The composite is a weighted blend of 9 inputs, each scored 0–100. Each bar is that input's sub-score; the figure is the points it added to the 100-point composite (weight × sub-score).
- Cash flow +30.0/30.0
- DSCR +10.0/10.0
- 1% rule +7.7/10.0
- ARV discount +5.4/15.0
- Rent growth +4.8/5.0
- Livability +3.7/5.0
- Condition / age +2.5/5.0
- Schools +1.2/10.0
- Appreciation +0.0/10.0
$109,900
🖨 Deal sheet 📄 Offer letter ✓ Due diligence
Listing remarks MLS
Ranch style home with a full basement and off street parking. Interior features, three bedrooms, 1.5 baths, living room and eat in kitchen. Some updates to the kitchen, systems and plumbing stack. Full basement with an egress window and lots of room for finishing. No interior access to show. Occupant is a tenant. ALL OFFERS FOR THIS PROPERTY MUST BE SUBMITTED VIA THE RES.NET AGENT PORTAL. OFFERS WILL NOT BE CONSIDERED IF SUBMITTED BY ANY OTHER METHOD.
Key facts
- Off street parking
- Full basement
- Egress window
Tags
Neighborhood map
What this means for you Summary
Snapshot
- This is a 3-bed/1.5-bath single-family listed at $110k.
Deal economics
- At list price, monthly cash flow is $420 ($5k/yr) — positive.
- The deal already cash-flows at list — no discount required.
- Meets the 1% rule at list price ($1k rent vs $110k).
- Recommended offer: $97k (12.0% below list) — sets the bar for market timing.
Location & tenants
- Location reads 74/100 on livability (#73 in MO, #4,882 nationally) — a middle-class / working-renter tenant base. Strengths: cost of living A+, housing A+, crime A; Watch: health & safety C-, amenities F, commute F.
- Ferguson-Florissant R-II (suburban): math 7% / reading 20% proficiency, ranked #311 of 324 in MO (top 96%) — low school quality limits family demand, transient renter base, plan for 1-2y turnover; 70% free/reduced lunch — lower-income household profile, screen leases tightly.
- Market conditions: Rents rising fast (+9.0%/yr); 162 active listings in the ZIP; 39 comparable units currently listed for rent nearby; rentals at typical pace (median 24d on market — plan ~3-4 weeks tenant-placement turnaround); 920 units permitted in St. Louis County in 2024 (250 in 5+ unit buildings).
- This rent runs 32% of the median local income ($52k/yr) — at the standard rent-burdened threshold; future hikes will face affordability resistance.
Forward outlook
- Local home prices are declining (-3.0%/yr); year-one equity from $760 of loan paydown is wiped out by about $3k of value loss. Plan a longer hold.
- At projected returns (-3.0% appreciation + 8.0% rent growth), your $31k cash investment doubles in ~6 years — after that, you're playing with house money.
Negotiation context
- It's been on market 174 days — a 12% lower offer ($97k) is reasonable based on typical stale-listing flexibility.
- 3 sale attempts since 2y ago; this cycle's ask has dropped $10k (8%) from the opening price — seller is motivated, your offer sets the floor, not the list.
Questions for the listing agent
- It's been on market 174 days. Have you received any prior offers? Is the seller open to a 12% concession, seller financing, or rate buy-down credit?
- Built in 1966 — when were the roof, HVAC, electrical panel, plumbing, and water heater last replaced?
- Why hasn't it sold? Are there any deal-killer items the seller is aware of (foundation, flood, title, zoning, code violations)?
- Is there a deadline driving the sale (1031 exchange, divorce, estate, relocation)? That informs how much negotiation room exists.
- Schools are B-rated — typically a magnet for longer-tenancy family renters. What's the average tenant stay here, and is there a school-zone premium baked into asking?
- What's the average days-on-market for RENTAL listings here right now (not sales)? A rising rental-DOM trend means longer vacancies and softer asking-rent achievability than the comps imply.
- What's the recent tenant-quality profile in this submarket — average credit score on applications, eviction rate, late-payment / NSF rate, and stable-employment percentage? A property-management company in the area should have these aggregated.
- How much new for-sale + rental construction is in the pipeline within 1–3 miles? Heavy new supply typically softens prices + rents 12–24 months out; constrained supply supports both.
Investment metrics
- 1% rule
- 1.27% ✓
- Cap rate
- 10.88%
- Cash-on-cash
- 16.37%
- DSCR
- 1.73
- GRM
- 6.6
CMA / ARV
- ARV (median comp)
- $105,010
- List price
- $109,900
- Delta
- 4.66%
- Verdict
- FAIR
- Comps
- 20 within 1.0 mi
Show comp detail 12 sales within ~0.75 mi
| Address | Dist | Beds/Ba | Sqft | Sold | Price | $/sf | Match |
|---|---|---|---|---|---|---|---|
| 201 Becker Dr | 0.27mi | 3/1.0 | 962 (+3%) | 2mo | $130,000 | $135 | 79 |
| 116 Grether Ave | 0.52mi | 3/1.0 | 936 (0%) | 1mo | $109,900 | $117 | 73 |
| 1825 S New Florissant Rd | 0.05mi | 2/1.0 (-1) | 1,029 (+10%) | 2mo | $125,000 | $121 | 72 |
| 116 Barto Dr | 0.15mi | 3/1.0 | 836 (-11%) | 3mo | $115,000 | $138 | 71 |
| 233 Buddie Ave | 0.35mi | 2/1.0 (-1) | 862 (-8%) | 0mo | $74,900 | $87 | 64 |
| 194 Elbring Dr | 0.47mi | 3/1.5 | 864 (-8%) | 3mo | $109,600 | $127 | 63 |
| 217 Anistasia Dr | 0.49mi | 3/1.5 | 864 (-8%) | 4mo | $64,900 | $75 | 61 |
| 16 Montclair Ct | 0.61mi | 3/2.0 | 864 (-8%) | 4mo | $100,000 | $116 | 54 |
| 190 Lynn Meadows Ln | 0.68mi | 3/1.0 | 864 (-8%) | 0mo | $119,900 | $139 | 53 |
| 1865 Clover Ln | 0.61mi | 2/2.0 (-1) | 988 (+6%) | 4mo | $139,900 | $142 | 51 |
| 30 Grether Ave | 0.46mi | 2/2.0 (-1) | 1,058 (+13%) | 4mo | $149,900 | $142 | 46 |
| 258 Williams Blvd | 0.57mi | 3/1.0 | 1,075 (+15%) | 0mo | $129,900 | $121 | 46 |
Match score weights: distance 35% · size 25% · config 20% · recency 20%. Top-matched comps best support the ARV.
Projected returns pro-forma
-3.0% appreciation · 8.0% rent growth · sell at horizon
- IRR
- 12.6%
- Equity multiple
- 1.53×
- Total profit
- $16,256
- Equity at exit
- $16,386
- IRR
- 24.9%
- Equity multiple
- 3.66×
- Total profit
- $81,941
- Equity at exit
- $9,502
Cash invested: $30,772 (down + closing). Projections, not guarantees.
Landlord ↔ Tenant lean methodology
- Overall (STATE)
- 81 Strongly Landlord-Friendly
- State Missouri
- 81 Strongly Landlord-Friendly · R+10
- County
- — inherits STATE
- City
- — inherits STATE
ZIP-level market 63135
- Rents YoY
- 9.0%
- Active inventory
- 162
- Price-to-rent
- 6.6×
Monthly cashflow live
- Estimated rent
- $1,391 high interval (Pro) →
- Mortgage (P&I)
- −$576
- Tax from tax record
- −$57 /mo · $687/yr
- Insurance
- −$46
- HOA
- −$0
- Vacancy / Maint / Mgmt
- −$292
- Net cashflow
- $420
Break-even live
UW: 25.0% down · 7.5% · 30yr · 1.5% tax · 5.0% vac · 8.0% maint · 8.0% mgmt
Financing live
Cash to close
- Down payment
- $27,475
- Closing costs
- $3,297
- Reserves months
- —
- Total cash needed
- —
Loan-product check · same deal, 3 products live
Conventional
25% down · 7.5% · 30yr
- Down + closing
- —
- Monthly P&I
- —
- Monthly cashflow
- —
- DSCR
- —
- Eligible?
- —
Personal DTI + credit; lowest rate.
DSCR
20% down · 8.5% · 30yr
- Down + closing
- —
- Monthly P&I
- —
- Monthly cashflow
- —
- DSCR
- —
- Eligible?
- —
No personal income docs; deal must DSCR.
Hard money
10% down · 12.0% · 12mo
- Down + closing
- —
- Monthly P&I
- —
- Monthly cashflow
- —
- DSCR
- —
- Eligible?
- —
Short-term bridge; refi at stabilization.
Rent comps 39 comps
| Address | Beds | Baths | Sqft | Rent | $/sqft | DOM | Units | Dist |
|---|---|---|---|---|---|---|---|---|
| 24 Barto Dr Saint Louis, MO | 3.0 | 1.0 | 864 | $1,400 | $1.62 | 43d | 1 | 0.05mi |
| 36 Connolly Dr Saint Louis, MO | 3.0 | 1.0 | 1024 | $1,149 | $1.12 | 23d | 1 | 0.10mi |
| 11 Anistasia Dr Saint Louis, MO | 3.0 | 1.5 | 1120 | $1,345 | $1.20 | 23d | 1 | 0.18mi |
| 107 Anistasia Dr Saint Louis, MO | 2.0 | 2.0 | 1030 | $1,400 | $1.36 | 23d | 1 | 0.26mi |
| 221 Barto Dr Saint Louis, MO | 3.0 | 2.0 | 958 | $1,295 | $1.35 | 20d | 1 | 0.32mi |
| 1275 N Florissant Rd Saint Louis, MO | 2.0 | 1.0 | 1008 | $1,275 | $1.26 | 23d | 1 | 0.32mi |
| 1465 W Duchesne Dr Florissant, MO | 3.0 | 1.0 | 896 | $1,500 | $1.67 | 43d | 1 | 0.33mi |
| 46 Bascom Dr Saint Louis, MO | 2.0 | 1.0 | 932 | $1,175 | $1.26 | 43d | 1 | 0.36mi |
| 241 Flora Dr Saint Louis, MO | 2.0 | 1.0 | 703 | $1,075 | $1.53 | 23d | 1 | 0.41mi |
| 171 Elbring Dr Saint Louis, MO | 3.0 | 1.5 | 1008 | $1,395 | $1.38 | 12d | 1 | 0.42mi |
| 153 Bascom Dr Saint Louis, MO | 3.0 | 1.0 | 1076 | $1,195 | $1.11 | 19d | 1 | 0.44mi |
| 220 Du Bourg Ln Florissant, MO | 2.0 | 1.0 | 816 | $1,150 | $1.41 | 43d | 1 | 0.44mi |
| 50 Lynn Meadows Ln Florissant, MO | 3.0 | 1.0 | 864 | $1,450 | $1.68 | 23d | 1 | 0.53mi |
| 263 Sadonia Ave Saint Louis, MO | 3.0 | 2.0 | 888 | $1,350 | $1.52 | 43d | 1 | 0.53mi |
| 1180 S New Florissant Rd Florissant, MO | 3.0 | 1.0 | 925 | $1,225 | $1.32 | 23d | 1 | 0.54mi |
| 260 Sadonia Ave Saint Louis, MO | 3.0 | 2.0 | 1088 | $1,623 | $1.49 | 20d | 1 | 0.54mi |
| 24 Vierling Dr Saint Louis, MO | 2.0 | 1.0 | 850 | $1,290 | $1.52 | 7d | 1 | 0.57mi |
| 7025 Richwood Ln Hazelwood, MO | 3.0 | 1.0 | 936 | $1,375 | $1.47 | 17d | 1 | 0.62mi |
| 297 Saint Eugene Ln Florissant, MO | 2.0 | 1.0 | 1100 | $1,100 | $1.00 | 43d | 1 | 0.84mi |
| 8330 Woodhurst Dr Saint Louis, MO | 3.0 | 1.0 | 1120 | $1,000 | $0.89 | 7d | 1 | 0.86mi |
| 135 Saint Maurice Ln Florissant, MO | 3.0 | 1.0 | 816 | $1,395 | $1.71 | 43d | 1 | 0.88mi |
| 8507 Tally Ho Dr Hazelwood, MO | 2.0 | 1.5 | 1478 | $1,300 | $0.88 | 43d | 5 | 0.89mi |
| 1600 Washington St Florissant, MO | 3.0 | 1.5 | 1095 | $1,250 | $1.14 | 20d | 1 | 0.90mi |
| 1050 Ozment Dr Florissant, MO | 3.0 | 2.0 | 984 | $1,525 | $1.55 | 43d | 1 | 0.91mi |
| 765 Bobbins Ln Florissant, MO | 3.0 | 1.0 | 1107 | $1,450 | $1.31 | 43d | 1 | 0.92mi |
| 6625 Thurston Ave Saint Louis, MO | 2.0 | 1.0 | 939 | $1,400 | $1.49 | 23d | 1 | 0.94mi |
| 6625 Thurston Ave Saint Louis, MO | 2.0 | 1.0 | 939 | $1,300 | $1.38 | 43d | 1 | 0.94mi |
| 1095 Ozment Dr Florissant, MO | 3.0 | 2.0 | 984 | $1,461 | $1.48 | 23d | 1 | 0.97mi |
| 20 Saint Benedict Ln Florissant, MO | 3.0 | 1.5 | 1092 | $1,525 | $1.40 | 20d | 1 | 1.14mi |
| 1502 Summer Run Dr #108 Florissant, MO | 2.0 | 1.5 | 922 | $1,200 | $1.30 | 23d | 1 | 1.16mi |
| 1725 Saint Catherine St Florissant, MO | 3.0 | 1.0 | 1107 | $1,800 | $1.63 | 14d | 1 | 1.20mi |
| 6333 Peurifoy Ave Saint Louis, MO | 3.0 | 2.0 | 840 | $1,295 | $1.54 | 23d | 1 | 1.34mi |
| 305 S Lafayette St Florissant, MO | 3.0 | 1.0 | 864 | $1,409 | $1.63 | 16d | 1 | 1.37mi |
| 1670 Arundel Dr Florissant, MO | 3.0 | 2.0 | 1012 | $1,450 | $1.43 | 23d | 1 | 1.37mi |
| 6336 Washington Ave Berkeley, MO | 2.0 | 1.0 | 720 | $1,175 | $1.63 | 43d | 1 | 1.40mi |
| 6334 Washington Ave Berkeley, MO | 3.0 | 1.0 | 864 | $1,100 | $1.27 | 4d | 1 | 1.41mi |
| 6315 Washington Ave Berkeley, MO | 2.0 | 1.0 | 739 | $1,175 | $1.59 | 16d | 1 | 1.46mi |
| 7437 Hazelcrest Dr Unit H Hazelwood, MO | 3.0 | 1.0 | 1000 | $1,000 | $1.00 | 7d | 1 | 1.49mi |
| 222 Henquin Dr Saint Louis, MO | 2.0 | 1.0 | 816 | $1,050 | $1.29 | 17d | 1 | 1.50mi |
Listing history 20 events
-
2026-06-09days on market $109,900 Active 174 DOM
-
2026-06-08days on market $109,900 Active 173 DOM
-
2026-06-07days on market $109,900 Active 172 DOM
-
2026-06-05days on market $109,900 Active 169 DOM
-
2026-06-03days on market $109,900 Active 168 DOM
-
2026-06-02days on market $109,900 Active 167 DOM
-
2026-06-01days on market $109,900 Active 166 DOM
-
2026-05-31days on market $109,900 Active 165 DOM
-
2026-05-10historical Active Under Contract 455-char remark
Show marketing remark (455 chars)
Ranch style home with a full basement and off street parking. Interior features, three bedrooms, 1.5 baths, living room and eat in kitchen. Some updates to the kitchen, systems and plumbing stack. Full basement with an egress window and lots of room for finishing. No interior access to show. Occupant is a tenant. ALL OFFERS FOR THIS PROPERTY MUST BE SUBMITTED VIA THE RES.NET AGENT PORTAL. OFFERS WILL NOT BE CONSIDERED IF SUBMITTED BY ANY OTHER METHOD.
-
2026-02-13price $109,900 455-char remark
Show marketing remark (455 chars)
Ranch style home with a full basement and off street parking. Interior features, three bedrooms, 1.5 baths, living room and eat in kitchen. Some updates to the kitchen, systems and plumbing stack. Full basement with an egress window and lots of room for finishing. No interior access to show. Occupant is a tenant. ALL OFFERS FOR THIS PROPERTY MUST BE SUBMITTED VIA THE RES.NET AGENT PORTAL. OFFERS WILL NOT BE CONSIDERED IF SUBMITTED BY ANY OTHER METHOD.
-
2025-12-17$119,900 Active 455-char remark
Show marketing remark (455 chars)
Ranch style home with a full basement and off street parking. Interior features, three bedrooms, 1.5 baths, living room and eat in kitchen. Some updates to the kitchen, systems and plumbing stack. Full basement with an egress window and lots of room for finishing. No interior access to show. Occupant is a tenant. ALL OFFERS FOR THIS PROPERTY MUST BE SUBMITTED VIA THE RES.NET AGENT PORTAL. OFFERS WILL NOT BE CONSIDERED IF SUBMITTED BY ANY OTHER METHOD.
-
2025-03-31status Active
-
2025-02-21status Pending
-
2024-12-14$115,000 Active
-
2023-02-09soldstatus $140,000
-
2021-09-22soldstatus $109,900
-
2009-03-10soldstatus $86,000
-
1999-11-12soldstatus $54,900
-
1988-07-01soldstatus
-
1980-01-01soldstatus
ⓘ Source: listings_history table (triggers on properties + properties_extension) + one-shot
backfill from property_details.listing_events for pre-trigger history.
Tax reassessment forecast MO · Resets to sale price
- Current annual tax
- $687 · $57/mo
- Projected year-2 tax
- $1,066 · $89/mo
- Expected delta
- +$379/yr (+$32/mo · 55.1%)
ⓘ Screening estimate from a state-policy table — verify with the county assessor before closing.
Climate risk First Street
- Flood 1/10 Low FEMA zone X (unshaded) · 0% chance over 30 yrs
- Wildfire 1/10 Low
- Heat 4/10 Moderate 7 d/yr ≥106°F today · 20 d/yr by 30 yrs out
- Wind 2/10 Low 100% chance of damaging wind over 30 yrs
- Air quality 3/10 Moderate 3 unhealthy d/yr today · 5 by 30 yrs out
Nearby sold comps map
Loading sold comps map…
Walkable amenities ~0.75 mi
Loading nearby amenities…
Taxation est. · year 1
- Rental income
- $16,697
- − Mortgage interest
- −$6,156
- − Property taxes
- −$687
- − Insurance
- −$550
- − Repairs & maintenance
- −$1,336
- − Management
- −$1,336
- − Depreciation
- −$3,197
- Taxable income
- $3,436
- Est. tax owed @ 24.0%
- −$825
- After-tax cash flow
- $4,214/yr
For passive investors: Depreciation is non-cash, so a rental often shows a tax loss while cash-flowing — sheltering income. Rental losses are passive: they offset passive income freely, and up to $25,000/yr can offset ordinary (W-2) income if you actively participate and your MAGI is under $100k (phasing out to $0 by $150k); unused losses carry forward. On sale, claimed depreciation is recaptured at up to 25%, and gains may owe capital-gains tax (a 1031 exchange can defer both). Figures are a year-1 estimate at your 24.0% rate — not tax advice; consult a CPA.
Schools (NCES district)
- District
- Ferguson-Florissant R-II
- NCES district ID
- 2912010
- Math proficiency
- 7% ▼ -9.00%
- Reading proficiency
- 20% ▼ -6.00%
- Median HH income
- $44,610
- Composite
- 11.96/100
- National rank
- #9666
- State rank
- #311 of 324 in MO
Livability — Calverton Park
- Score
- 74/100
- State rank
- #73
- US rank
- #4882
Category grades
Schools grade is shown separately in the Schools card above.
Census & demographics
- Census place
- Calverton Park, MO
- County
- Saint Louis County · 888,823 people
- City population
- 18,381
- Metro
- St. Louis, MO-IL
- Population (ZIP)
- 18,381
- Household income
- $52,328
- Rent vs Own
- Severe rent burden
- 957.0
Population outlook (St. Louis County) Hauer SSP2
- Today (2025)
- 1,025,227 people
- By 2030
- 1,028,023 · +0.3%
- By 2040
- 1,020,940 · -0.4%
- By 2050
- 1,007,280 · -1.8%
- By 2075
- 987,277 · -3.7%
- By 2100
- 921,984 · -10.1%
Race, ethnicity, and origin ACS 2023
- Neighborhood character
- Predominantly Black (66%)
- Race & ethnicity
- Black 66% White 28% Two or more races 3% Hispanic / Latino 2%
- Common ancestry
- Lithuanian 1% Iranian 1% Romanian 1%
- Foreign-born
- 1% · Canada
- Languages at home
- 95% English-only · Spanish 4%
Political lean MEDSL · St. Louis
- 2024 margin
- Strong D (+23.4) · D 60.8% · R 37.4% · Other 1.7%
- 2008→2024 swing
- +3.5pp toward D · 2008: 19.9pp · 2024: 23.4pp
- All cycles
- 2024: D+23.4 2020: D+24.0 2016: D+16.2 2012: D+13.7 2008: D+19.9
Not yet ingested
- Civics
- —
Market trends
- HPI YoY
- ▼ -152.56%
- Current HPI
- 138.6781
- Rent YoY
- ▲ 9.03%
- Metro
- St. Louis, MO-IL
- State GDP YoY
- ▲ 1.84%
- F500 in state
- 20
Industry mix (Fortune 500 HQ in MO)
| Industry | F500 HQs | Revenue |
|---|---|---|
| Healthcare | 1 | $163B |
|
||
| Insurance | 1 | $21B |
|
||
| Industrial Technology | 1 | $17B |
|
||
| Retail | 1 | $16B |
|
||
| Industrial Distribution | 1 | $10B |
|
||
| Utilities | 1 | $9B |
|
||
Price history
+100.2% since first listed12 events — show timeline
- 2026-05-10 Contingent — MARIS as Distributed by MLS Grid
- 2026-02-13 Price Changed $109,900 MARIS as Distributed by MLS Grid
- 2025-12-17 Listed $119,900 MARIS as Distributed by MLS Grid
- 2025-03-31 Relisted — MARIS as Distributed by MLS Grid
- 2025-02-21 Pending — MARIS as Distributed by MLS Grid
- 2024-12-14 Listed $115,000 MARIS as Distributed by MLS Grid
- 2023-02-09 Sold (Public Records) $140,000 Public Records
- 2021-09-22 Sold (Public Records) $109,900 Public Records
- 2009-03-10 Sold (Public Records) $86,000 Public Records
- 1999-11-12 Sold (Public Records) $54,900 Public Records
- 1988-07-01 Sold (Public Records) — Public Records
- 1980-01-01 Sold (Public Records) — Public Records
Property tax history
-9.0%/yrLatest (2022): $687 · +0.3% YoY. Source: county tax records.
Cash-flow waterfall
monthlySold comps — $/sqft
last 12 mo · ≤1 miLoading sold comps…