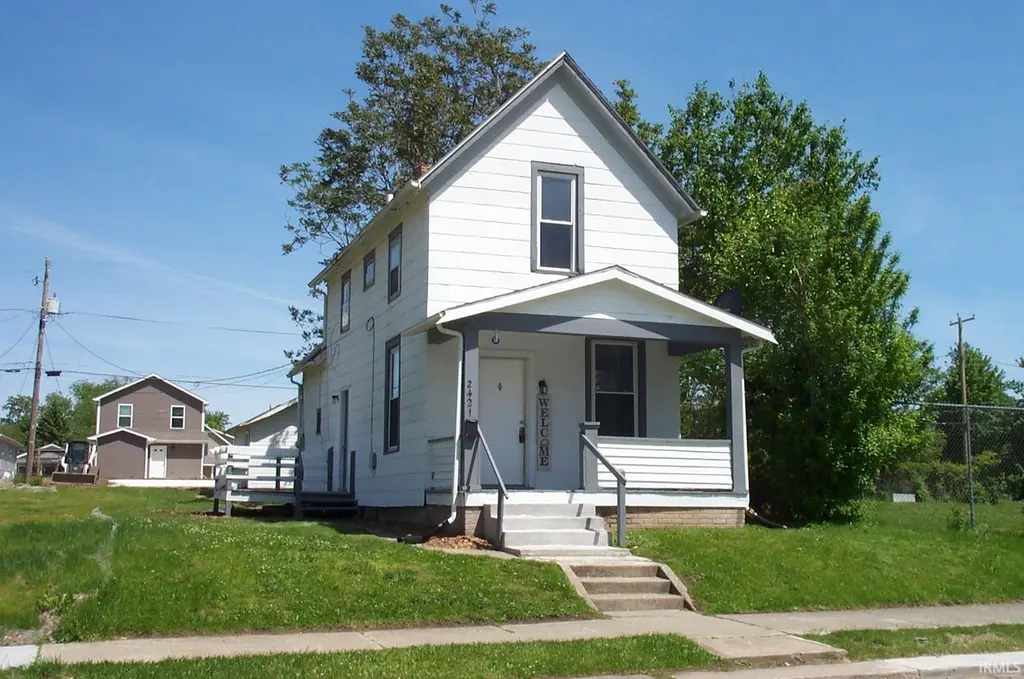
2421 Winter St · Fort Wayne, IN
Flood risk 1/10 · Minimal
- FEMA flood zone
- X (unshaded)
- Chance of flooding over 30 yrs
- 0.0%
- Est. flood insurance / yr
- $507 – $1,088
Fire risk 1/10 · Minimal
- Est. fire insurance / yr
- $717 – $1,331
Heat risk 3/10 · Minor
- Hot days now (above 100°F)
- 7 days/yr
- Hot days in 30 yrs
- 17 days/yr
Wind risk 2/10 · Minimal
- Chance of severe wind over 30 yrs
- —
Air-quality risk 3/10 · Minor
- Unhealthy air days now
- 2 days/yr
- Unhealthy air days in 30 yrs
- 3 days/yr
Risk factors via First Street. Map © Google.
Why this score? — see what drove the A grade
The composite is a weighted blend of 9 inputs, each scored 0–100. Each bar is that input's sub-score; the figure is the points it added to the 100-point composite (weight × sub-score).
- Cash flow +30.0/30.0
- ARV discount +15.0/15.0
- DSCR +10.0/10.0
- Appreciation +10.0/10.0
- 1% rule +9.1/10.0
- Livability +4.2/5.0
- Rent growth +2.5/5.0
- Condition / age +2.5/5.0
- Schools +2.2/10.0
$78,900
🖨 Deal sheet (PDF) 📄 Offer letter ✓ Due diligence
Listing remarks MLS
Living room and big kitchen on main level. Also on main floor is a half bath plus a room which could be the dining room or the 3rd bedroom. Two nice sized bedrooms and full bath upstairs. Newer roof. One car garage. Property is being sold 'as is', and buyer is welcome to have an inspection. Needs a furnace and a water heater. New million dollar development at Bottle Works only a block away. Bowser Park directly across the street. Great investment opportunity.
Key facts
- Covered front porch
- Harwood floors
- Bowser park
Tags
Property features AI
Exterior
- Parking: Detached 1-car garage
- Utilities: Public water; Public sewer; Natural gas available
- Home design: Single-family residence; Site-built home; 2 stories
- Construction: Wood siding
- Exterior features: Level lot; Lot dimensions approximately 30 x 137
Interior
- Kitchen: Refrigerator; Gas range
- Bedrooms: 5 total rooms (bedroom count not specified)
- Flooring: Hardwood; Laminate
- Bathrooms: 1 full bathroom; 1 half bathroom; One main-level bathroom
- Heating & cooling: Natural gas forced air heating; No cooling
- Interior features: Window treatments; Full basement
- Laundry & utility: Electric dryer hookup in basement; Gas water heater
Neighborhood map
What this means for you Summary
Snapshot
- This is a 3-bed/1.0-bath single-family listed at $79k.
Deal economics
- At list price, monthly cash flow is $332 ($4k/yr) — positive.
- The deal already cash-flows at list — no discount required.
- Meets the 1% rule at list price ($1k rent vs $79k).
- Recommended offer: $78k (1.5% below list) — sets the bar for market timing.
- Cap rate 11.3% vs local median 4.8% in Fort Wayne — top-decile yield for the area; either an underpriced asset or a hidden risk that comps aren't pricing in. Stress-test before assuming the spread holds.
Location & tenants
- Location reads 84/100 on livability (#6 in IN, #676 nationally) — a professional / high-income tenant draw. Strengths: amenities A+, commute A+, cost of living A+; Watch: crime C-, employment D+.
- Fort Wayne Community Schools (urban): math 22% / reading 29% proficiency, ranked #263 of 301 in IN (top 87%) — low school quality limits family demand, transient renter base, plan for 1-2y turnover; 60% free/reduced lunch — lower-income household profile, screen leases tightly.
- Zoned schools: Northcrest Elementary School (math 17% / reading 17%, grade F, #837 of 994 statewide, top 86%, 493 students, 71% FRL); Northwood Middle School (math 14% / reading 22%, grade F, #279 of 330 statewide, top 86%, 587 students, 70% FRL); North Side High School (math 19% / reading 51%, grade F, #266 of 369 statewide, top 73%, 1,474 students, 66% FRL).
- Market conditions: 52 active listings in the ZIP; 24 comparable units currently listed for rent nearby; rentals at typical pace (median 22d on market — plan ~3-4 weeks tenant-placement turnaround); lower-income renter base — watch delinquency; 1,861 units permitted in Allen County in 2024 (576 in 5+ unit buildings).
Forward outlook
- In year one you build about $8k of equity ($545 loan paydown + $8k appreciation (10.0% local appreciation)).
- Allen County population projected at +10% by 2050 — modest demand growth; plan on rents tracking national, not racing it.
- At projected returns (10.0% appreciation + 3.0% rent growth), your $22k cash investment doubles in ~2 years — after that, you're playing with house money.
- By year 5, paydown + projected appreciation supports a ~$39k cash-out refi (75% LTV) — recoverable capital for the next deal without selling this one.
Negotiation context
- It's been on market 20 days — a 2% lower offer ($78k) is reasonable based on typical stale-listing flexibility.
- 2 sale attempts since 6y ago; this cycle's ask has dropped $6k (7%) from the opening price — seller is motivated, your offer sets the floor, not the list.
- Current owner paid $22k; list at $79k implies a 259% gain — meaningful room to come down on a strong offer.
Risks & watch-outs
- Watch-outs: built in 1917 — expect roof / HVAC / electrical / plumbing capex.
Questions for the listing agent
- Built in 1917 — when were the roof, HVAC, electrical panel, plumbing, and water heater last replaced?
- Is there a deadline driving the sale (1031 exchange, divorce, estate, relocation)? That informs how much negotiation room exists.
- Schools are D-rated, which usually means shorter tenancies and higher turnover. Who's the typical renter profile here, and what's been the actual vacancy rate?
- What's the average days-on-market for RENTAL listings here right now (not sales)? A rising rental-DOM trend means longer vacancies and softer asking-rent achievability than the comps imply.
- What's the recent tenant-quality profile in this submarket — average credit score on applications, eviction rate, late-payment / NSF rate, and stable-employment percentage? A property-management company in the area should have these aggregated.
- How much new for-sale + rental construction is in the pipeline within 1–3 miles? Heavy new supply typically softens prices + rents 12–24 months out; constrained supply supports both.
Investment metrics
- 1% rule
- 1.41% ✓
- Cap rate
- 11.34%
- Cash-on-cash
- 18.04%
- DSCR
- 1.80
- GRM
- 5.9
CMA / ARV
- ARV (on-the-fly)
- $95,172
- Comps found
- 12
Show comp detail 12 sales within ~0.75 mi
| Address | Dist | Beds/Ba | Sqft | Sold | Price | $/sf | Match |
|---|---|---|---|---|---|---|---|
| 1514 E Creighton Ave | 0.13mi | 2/1.0 (-1) | 1,013 (+10%) | 2mo | $110,000 | $109 | 71 |
| 3202 S Anthony Blvd | 0.53mi | 2/1.0 (-1) | 900 (-3%) | 4mo | $67,500 | $75 | 63 |
| 1426 Eckart St | 0.47mi | 2/2.0 (-1) | 960 (+4%) | 1mo | $139,000 | $145 | 62 |
| 3127 Holton Ave | 0.52mi | 2/1.0 (-1) | 984 (+6%) | 1mo | $53,000 | $54 | 59 |
| 3419 Robinwood Dr | 0.66mi | 3/1.0 | 960 (+4%) | 4mo | $73,000 | $76 | 59 |
| 3105 Plaza Dr | 0.56mi | 3/1.0 | 993 (+8%) | 4mo | $60,000 | $60 | 58 |
| 3214 Winter St | 0.53mi | 2/1.0 (-1) | 872 (-6%) | 9mo | $89,900 | $103 | 53 |
| 2922 Plaza Dr | 0.44mi | 2/1.5 (-1) | 1,000 (+8%) | 10mo | $144,350 | $144 | 50 |
| 3010 Holton Ave | 0.43mi | 3/1.5 | 1,040 (+13%) | 9mo | $101,500 | $98 | 50 |
| 2820 Radcliffe Dr | 0.61mi | 3/1.5 | 1,000 (+8%) | 9mo | $72,000 | $72 | 49 |
| 3202 Queen St | 0.68mi | 3/1.5 | 1,008 (+9%) | 4mo | $150,000 | $149 | 48 |
| 3405 Oliver St | 0.68mi | 2/1.0 (-1) | 988 (+7%) | 7mo | $133,500 | $135 | 46 |
Match score weights: distance 35% · size 25% · config 20% · recency 20%. Top-matched comps best support the ARV.
Projected returns pro-forma
10.0% appreciation · 3.0% rent growth · sell at horizon
- IRR
- 37.7%
- Equity multiple
- 3.90×
- Total profit
- $64,140
- Equity at exit
- $71,079
- IRR
- 32.5%
- Equity multiple
- 8.80×
- Total profit
- $172,288
- Equity at exit
- $153,285
Cash invested: $22,092 (down + closing). Projections, not guarantees.
Landlord ↔ Tenant lean methodology
- Overall (STATE)
- 90 Strongly Landlord-Friendly
- State Indiana
- 90 Strongly Landlord-Friendly · R+11
- County
- — inherits STATE
- City
- — inherits STATE
ZIP-level market 46803
- Active inventory
- 52
- Price-to-rent
- 5.9×
Monthly cashflow live
- Estimated rent
- $1,115 high interval (Pro) →
- Mortgage (P&I)
- −$414
- Tax from tax record
- −$102 /mo · $1,225/yr
- Insurance
- −$33
- HOA
- −$0
- Vacancy / Maint / Mgmt
- −$234
- Net cashflow
- $332
Break-even live
Sensitivity live
| Price | -10% $377 | -5% $354 | +0% $332 | +5% $310 | +10% $287 |
|---|---|---|---|---|---|
| Rent | -10% $244 | -5% $288 | +0% $332 | +5% $376 | +10% $420 |
| Rate | -1.0pp $372 | -0.5pp $352 | base $332 | +0.5pp $312 | +1.0pp $291 |
UW: 25.0% down · 7.5% · 30yr · 1.5% tax · 5.0% vac · 8.0% maint · 8.0% mgmt
Financing live
Cash to close
- Down payment
- $19,725
- Closing costs
- $2,367
- Reserves months
- —
- Total cash needed
- —
Loan-product check · same deal, 3 products live
Conventional
25% down · 7.5% · 30yr
- Down + closing
- —
- Monthly P&I
- —
- Monthly cashflow
- —
- DSCR
- —
- Eligible?
- —
Personal DTI + credit; lowest rate.
DSCR
20% down · 8.5% · 30yr
- Down + closing
- —
- Monthly P&I
- —
- Monthly cashflow
- —
- DSCR
- —
- Eligible?
- —
No personal income docs; deal must DSCR.
Hard money
10% down · 12.0% · 12mo
- Down + closing
- —
- Monthly P&I
- —
- Monthly cashflow
- —
- DSCR
- —
- Eligible?
- —
Short-term bridge; refi at stabilization.
Rent comps 24 comps
| Address | Beds | Baths | Sqft | Rent | $/sqft | DOM | Units | Dist |
|---|---|---|---|---|---|---|---|---|
| 859 Buchanan St Fort Wayne, IN | 1.0–4.0 | 1.0 | 887 | $1,074 | $1.21 | 22d | 1 | 0.62mi |
| 3410 S Anthony Blvd Fort Wayne, IN | 3.0 | 1.0 | 900 | $1,200 | $1.33 | 44d | 1 | 0.62mi |
| 442 E Wildwood Ave Fort Wayne, IN | 2.0 | 1.0 | 864 | $875 | $1.01 | 22d | 1 | 0.90mi |
| 3932 Winter St Fort Wayne, IN | 2.0 | 1.0 | 750 | $875 | $1.17 | 44d | 1 | 0.95mi |
| 4014 Oliver St Fort Wayne, IN | 3.0 | 1.0 | 936 | $1,050 | $1.12 | 14d | 1 | 1.03mi |
| 4129 Bowser Ave Fort Wayne, IN | 3.0 | 1.5 | 850 | $1,250 | $1.47 | 22d | 1 | 1.11mi |
| 3801 Lafayette St Fort Wayne, IN | 2.0 | 1.0 | 1116 | $995 | $0.89 | 14d | 1 | 1.20mi |
| 3127 Pennsylvania St Fort Wayne, IN | 2.0 | 1.0 | 696 | $1,000 | $1.44 | 14d | 1 | 1.21mi |
| 2919 S Harrison St Unit 2921 Fort Wayne, IN | 2.0 | 1.0 | 538 | $825 | $1.53 | 22d | 1 | 1.24mi |
| 3113 S Harrison St Unit 2 Fort Wayne, IN | 2.0 | 1.0 | 600 | $850 | $1.42 | 14d | 1 | 1.26mi |
| 4121 Monroe St Fort Wayne, IN | 2.0 | 1.0 | 725 | $1,100 | $1.52 | 14d | 1 | 1.26mi |
| 4325 Werling Dr Fort Wayne, IN | 1.0–3.0 | 1.0–2.0 | 923 | $1,164 | $1.26 | 44d | 1 | 1.28mi |
| 217 W Masterson Ave Fort Wayne, IN | 2.0 | 1.0 | 1100 | $995 | $0.90 | 22d | 1 | 1.32mi |
| 309 W Leith St Unit 2 Fort Wayne, IN | 2.0 | 1.0 | 900 | $1,000 | $1.11 | 44d | 1 | 1.32mi |
| 309 W Williams St Unit 1 Fort Wayne, IN | 2.0 | 1.0 | 900 | $900 | $1.00 | 22d | 1 | 1.35mi |
| 4018 S Clinton St Fort Wayne, IN | 3.0 | 1.0 | 860 | $1,000 | $1.16 | 22d | 1 | 1.38mi |
| 4126 Lafayette St Fort Wayne, IN | 2.0 | 1.0 | 775 | $1,275 | $1.65 | 44d | 1 | 1.38mi |
| 227 W Darrow Ave Fort Wayne, IN | 3.0 | 1.0 | 995 | $1,000 | $1.01 | 44d | 1 | 1.41mi |
| 4522 Spatz Ave Fort Wayne, IN | 2.0 | 1.0 | 840 | $950 | $1.13 | 44d | 1 | 1.43mi |
| 4705 S Anthony Blvd Fort Wayne, IN | 3.0 | 1.0 | 1110 | $1,050 | $0.95 | 14d | 1 | 1.46mi |
| 2445 Fairfield Ave Fort Wayne, IN | 2.0 | 1.5 | 950 | $1,150 | $1.21 | 14d | 3 | 1.49mi |
| 4331 Lafayette St Fort Wayne, IN | 2.0 | 1.0 | 810 | $925 | $1.14 | 14d | 1 | 1.49mi |
| 807 Edgewater Ave Fort Wayne, IN | 3.0 | 1.0 | 1075 | $1,450 | $1.35 | 22d | 1 | 1.50mi |
| 805 Edgewater Ave Fort Wayne, IN | 3.0 | 1.0 | 1075 | $1,550 | $1.44 | 14d | 1 | 1.50mi |
Listing history 15 events
-
2026-06-17status $78,900 Pending 20 DOM
-
2026-06-16pricedays on market $78,900 Active 20 DOM
-
2026-06-15days on market $81,900 Active 19 DOM
-
2026-06-14days on market $81,900 Active 17 DOM
-
2026-06-10days on market $81,900 Active 14 DOM
-
2026-06-09days on market $81,900 Active 13 DOM
-
2026-06-08pricedays on market $81,900 Active 12 DOM
-
2026-06-07days on market $85,000 Active 11 DOM
-
2026-06-03days on market $85,000 Active 7 DOM
-
2026-06-02statusdays on market $85,000 Active 6 DOM
-
2026-05-30statusdays on market $85,000 Pending 5 DOM
-
2026-05-26$85,000 Active
-
2022-11-14historical
-
2020-04-14soldstatus $22,000 463-char remark
Show marketing remark (463 chars)
Living room and big kitchen on main level. Also on main floor is a half bath plus a room which could be the dining room or the 3rd bedroom. Two nice sized bedrooms and full bath upstairs. Newer roof. One car garage. Property is being sold 'as is', and buyer is welcome to have an inspection. Needs a furnace and a water heater. New million dollar development at Bottle Works only a block away. Bowser Park directly across the street. Great investment opportunity.
-
2020-03-19$28,400 463-char remark
Show marketing remark (463 chars)
Living room and big kitchen on main level. Also on main floor is a half bath plus a room which could be the dining room or the 3rd bedroom. Two nice sized bedrooms and full bath upstairs. Newer roof. One car garage. Property is being sold 'as is', and buyer is welcome to have an inspection. Needs a furnace and a water heater. New million dollar development at Bottle Works only a block away. Bowser Park directly across the street. Great investment opportunity.
ⓘ Source: listings_history table (triggers on properties + properties_extension) + one-shot
backfill from property_details.listing_events for pre-trigger history.
Tax reassessment forecast IN · Partial reset (capped growth)
- Current annual tax
- $1,225 · $102/mo
- Projected year-2 tax
- $1,225 · $102/mo
- Expected delta
- $0/yr ($0/mo · 0.0%)
ⓘ Screening estimate from a state-policy table — verify with the county assessor before closing.
Climate risk First Street
- Flood 1/10 Low FEMA zone X (unshaded) · 0% chance over 30 yrs
- Wildfire 1/10 Low
- Heat 3/10 Moderate 7 d/yr ≥100°F today · 17 d/yr by 30 yrs out
- Wind 2/10 Low
- Air quality 3/10 Moderate 2 unhealthy d/yr today · 3 by 30 yrs out
Nearby sold comps map
Loading sold comps map…
Walkable amenities ~0.75 mi
Loading nearby amenities…
Taxation est. · year 1
- Rental income
- $13,380
- − Mortgage interest
- −$4,420
- − Property taxes
- −$1,225
- − Insurance
- −$394
- − Repairs & maintenance
- −$1,070
- − Management
- −$1,070
- − Depreciation
- −$2,295
- Taxable income
- $2,904
- Est. tax owed @ 24.0%
- −$697
- After-tax cash flow
- $3,288/yr
For passive investors: Depreciation is non-cash, so a rental often shows a tax loss while cash-flowing — sheltering income. Rental losses are passive: they offset passive income freely, and up to $25,000/yr can offset ordinary (W-2) income if you actively participate and your MAGI is under $100k (phasing out to $0 by $150k); unused losses carry forward. On sale, claimed depreciation is recaptured at up to 25%, and gains may owe capital-gains tax (a 1031 exchange can defer both). Figures are a year-1 estimate at your 24.0% rate — not tax advice; consult a CPA.
Schools (NCES district)
- District
- Fort Wayne Community Schools
- NCES district ID
- 1803630
- Math proficiency
- 22% ▼ -11.00%
- Reading proficiency
- 29% ▼ -7.00%
- Median HH income
- $41,951
- Composite
- 21.68/100
- National rank
- #8275
- State rank
- #263 of 301 in IN
Livability — Fort Wayne
- Score
- 84/100
- State rank
- #6
- US rank
- #676
Category grades
Schools grade is shown separately in the Schools card above.
Census & demographics
- Census place
- Fort Wayne, IN
- County
- Allen County · 326,813 people
- City population
- 326,813
- Metro
- Fort Wayne, IN
- Population (ZIP)
- 10,994
- Household income
- $34,381
- Rent vs Own
- Severe rent burden
- 660.0
Population outlook (Allen County) Hauer SSP2
- Today (2025)
- 394,020 people
- By 2030
- 405,128 · +2.8%
- By 2040
- 423,476 · +7.5%
- By 2050
- 435,137 · +10.4%
- By 2075
- 450,293 · +14.3%
- By 2100
- 424,101 · +7.6%
Race, ethnicity, and origin ACS 2023
- Neighborhood character
- Diverse neighborhood (Simpson 0.69)
- Race & ethnicity
- Black 42% White 27% Hispanic / Latino 24% Two or more races 10% Native American 2% Asian 1%
- Hispanic origin (detail)
- Mexican 17% Puerto Rican 1%
- Common ancestry
- Lithuanian 1% Iranian 1% Serbian 1%
- Foreign-born
- 11% · Canada, Philippines
- Languages at home
- 81% English-only · Spanish 16% Other Asian/Pacific 1% French/Haitian/Cajun 1%
Political lean MEDSL · Allen
- 2024 margin
- R (+12.5) · D 42.9% · R 55.4% · Other 1.7%
- 2008→2024 swing
- -8.1pp toward R · 2008: -4.3pp · 2024: -12.5pp
- All cycles
- 2024: R+12.5 2020: R+11.2 2016: R+19.6 2012: R+16.8 2008: R+4.3
Not yet ingested
- Civics
- —
Market trends
- HPI YoY
- ▲ 107.58%
- Current HPI
- 404.7976
- Rent YoY
- —
- Metro
- Fort Wayne, IN
- State GDP YoY
- ▲ 2.90%
- F500 in state
- 18
Industry mix (Fortune 500 HQ in IN)
| Industry | F500 HQs | Revenue |
|---|---|---|
| Industrial Machinery | 2 | $37B |
|
||
| Healthcare | 1 | $177B |
|
||
| Pharmaceuticals | 1 | $45B |
|
||
| Metals / Steel | 1 | $18B |
|
||
| Agriculture | 1 | $17B |
|
||
| Packaging | 1 | $12B |
|
||
Price history
+199.3% since first listed4 events — show timeline
- 2026-05-26 Listed $85,000 IRMLS
- 2022-11-14 Rental Removed — RENT.
- 2020-04-14 Sold (MLS) $22,000 IRMLS
- 2020-03-19 Listed $28,400 IRMLS
Property tax history
+13.8%/yrLatest (2024): $1,225 · +22.1% YoY. Source: county tax records.
Cash-flow waterfall
monthlySold comps — $/sqft
last 12 mo · ≤1 miLoading sold comps…