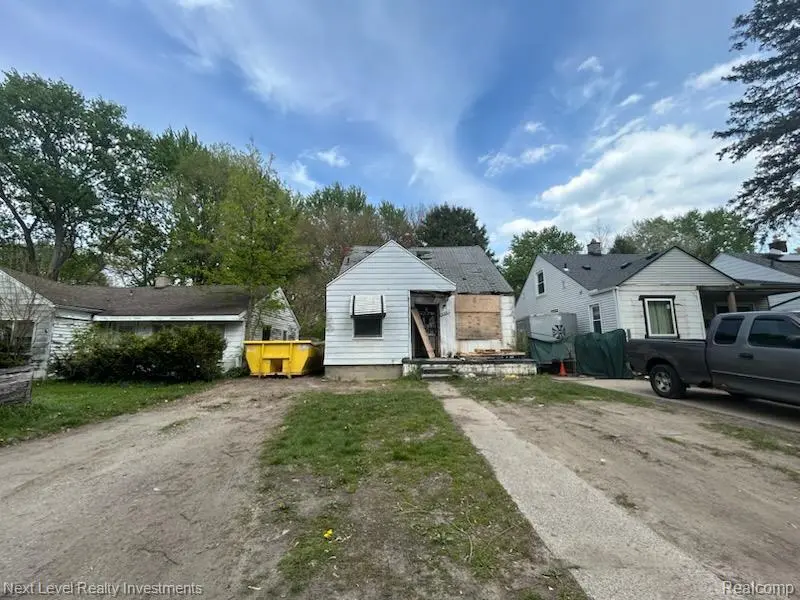
4314 Neff Ave · Detroit, MI
Flood risk 1/10 · Minimal
- FEMA flood zone
- X (unshaded)
- Chance of flooding over 30 yrs
- 0.0%
- Est. flood insurance / yr
- $473 – $860
Fire risk 1/10 · Minimal
- Est. fire insurance / yr
- $784 – $1,456
Heat risk 3/10 · Minor
- Hot days now (above 96°F)
- 6 days/yr
- Hot days in 30 yrs
- 14 days/yr
Wind risk 2/10 · Minimal
- Chance of severe wind over 30 yrs
- —
Air-quality risk 3/10 · Minor
- Unhealthy air days now
- 3 days/yr
- Unhealthy air days in 30 yrs
- 4 days/yr
Risk factors via First Street. Map © Google.
Why this score? — see what drove the D grade
The composite is a weighted blend of 9 inputs, each scored 0–100. Each bar is that input's sub-score; the figure is the points it added to the 100-point composite (weight × sub-score).
- Cash flow +15.0/30.0
- ARV discount +7.5/15.0
- 1% rule +5.0/10.0
- DSCR +5.0/10.0
- Livability +3.7/5.0
- Rent growth +2.7/5.0
- Condition / age +2.5/5.0
- Schools +1.3/10.0
- Appreciation +0.0/10.0
$14,000
🖨 Deal sheet (PDF) 📄 Offer letter ✓ Due diligence
Listing remarks MLS
Development opportunity! Close to East English Village and Grosse Pointe. Room sizes are estimates. Interested buyers must submit a complete proposal package for DLBA approval, including a project proposal, proof of funds, site plan or concept drawing, and proof of previous development experience. Sale is contingent upon execution of a DLBA Development Agreement. The Detroit Land Bank Authority is entitled to a tax recapture for the five (5) tax years following transfer of ownership. This provision may be incompatible with certain tax abatements, lot combinations, or assemblages. Waiver requests may be considered on a case-by-case basis and may require a payment in lieu of taxes, determined after DLBA review of the development pro forma and financing.
Key facts
- 6,534 sq ft lot
- Built 1951
- Listed 19 days
Property features AI
Exterior
- Parking: No garage
- Utilities: Public water; Public sewer; Water and sewer available
- Home design: Single-family residence; One story; Ground-level entry with steps
- Construction: Aluminum siding; Block foundation
- Exterior features: Paved road access; Lot roughly 0.15 acres (35 x 181.81)
Interior
- Bathrooms: 1 full bathroom
- Heating & cooling: Forced air heating (natural gas); No central cooling
- Interior features: 5 total rooms; Unfinished basement
Neighborhood map
What this means for you Summary
Snapshot
- This is a 3-bed/1.0-bath single-family listed at $14k.
Deal economics
- At list price, monthly cash flow is $991 ($12k/yr) — positive.
- The deal already cash-flows at list — no discount required.
- Meets the 1% rule at list price ($1k rent vs $14k).
- Recommended offer: $14k (1.5% below list) — sets the bar for market timing.
- Cap rate 91.2% vs local median 10.0% in Detroit — top-decile yield for the area; either an underpriced asset or a hidden risk that comps aren't pricing in. Stress-test before assuming the spread holds.
Location & tenants
- Location reads 73/100 on livability (#218 in MI) — a middle-class / working-renter tenant base. Strengths: amenities A+, commute A+, cost of living A+; Watch: crime F, employment F.
- Detroit Public Schools Community District (urban): math 10% / reading 24% proficiency, ranked #499 of 540 in MI (top 92%) — low school quality limits family demand, transient renter base, plan for 1-2y turnover; 90% free/reduced lunch — lower-income household profile, screen leases tightly.
- Zoned schools: Marquette Elementarymiddle School (514 students, 94% FRL); East English Village Preparatory Academy At Finney (math 10% / reading 10%, grade F, #659 of 713 statewide, top 97%, 697 students, 85% FRL) — zoned schools at 89% FRL track the district average.
- Market conditions: Rents flat; 492 active listings in the ZIP; 37 comparable units currently listed for rent nearby; rentals at typical pace (median 26d on market — plan ~3-4 weeks tenant-placement turnaround); lower-income renter base — watch delinquency; 2,639 units permitted in Wayne County in 2024 (1,216 in 5+ unit buildings).
- This rent runs 37% of the median local income ($45k/yr) — at the standard rent-burdened threshold; future hikes will face affordability resistance.
Forward outlook
- Local home prices are declining (-3.0%/yr); year-one equity from $97 of loan paydown is wiped out by about $420 of value loss. Plan a longer hold.
- Wayne County population projected at -17% by 2050 — secular population decline; favor cash flow + early exit over multi-decade hold.
- At projected returns (-3.0% appreciation + 0.7% rent growth), your $4k cash investment doubles in ~1 year — after that, you're playing with house money.
Negotiation context
- It's been on market 19 days — a 2% lower offer ($14k) is reasonable based on typical stale-listing flexibility.
- 2 sale attempts with the ask held roughly flat each time — persistent listings suggest the price (not the market) is what's stuck; bring a comps-based counter.
Risks & watch-outs
- Watch-outs: built in 1951 — expect roof / HVAC / electrical / plumbing capex.
Questions for the listing agent
- Built in 1951 — when were the roof, HVAC, electrical panel, plumbing, and water heater last replaced?
- Is there a deadline driving the sale (1031 exchange, divorce, estate, relocation)? That informs how much negotiation room exists.
- Schools are F-rated, which usually means shorter tenancies and higher turnover. Who's the typical renter profile here, and what's been the actual vacancy rate?
- Crime grade is F in this area — have there been break-ins, vandalism, or insurance claims at this property in the last 3 years? What carrier currently insures it and at what premium?
- The area grade is low — what's the realistic commute time and amenity access for the typical tenant pool here? Any planned neighborhood developments (good or bad) we should know about?
- What's the average days-on-market for RENTAL listings here right now (not sales)? A rising rental-DOM trend means longer vacancies and softer asking-rent achievability than the comps imply.
- What's the recent tenant-quality profile in this submarket — average credit score on applications, eviction rate, late-payment / NSF rate, and stable-employment percentage? A property-management company in the area should have these aggregated.
- How much new for-sale + rental construction is in the pipeline within 1–3 miles? Heavy new supply typically softens prices + rents 12–24 months out; constrained supply supports both.
Investment metrics
- 1% rule
- 9.84% ✓
- Cap rate
- 91.24%
- Cash-on-cash
- 303.37%
- DSCR
- 14.50
- GRM
- 0.8
CMA / ARV
- ARV (on-the-fly)
- $75,460
- Comps found
- 12
Show comp detail 12 sales within ~0.75 mi
| Address | Dist | Beds/Ba | Sqft | Sold | Price | $/sf | Match |
|---|---|---|---|---|---|---|---|
| 4163 University Pl | 0.12mi | 3/1.0 | 975 (-0%) | 7mo | $75,000 | $77 | 88 |
| 4104 Woodhall St | 0.14mi | 3/1.0 | 1,090 (+11%) | 3mo | $29,900 | $27 | 72 |
| 4356 Harvard Rd | 0.34mi | 3/2.0 | 921 (-6%) | 1mo | $150,000 | $163 | 69 |
| 4335 Cadieux Rd | 0.31mi | 3/1.0 | 1,062 (+8%) | 6mo | $80,000 | $75 | 67 |
| 5220 University Pl | 0.54mi | 2/1.0 (-1) | 1,001 (+2%) | 0mo | $40,000 | $40 | 66 |
| 3950 Cadieux Rd | 0.34mi | 2/1.0 (-1) | 900 (-8%) | 0mo | $30,000 | $33 | 65 |
| 5252 Lodewyck St | 0.61mi | 3/1.5 | 1,006 (+3%) | 5mo | $105,000 | $104 | 61 |
| 5260 Marseilles St | 0.60mi | 3/1.0 | 1,040 (+6%) | 7mo | $75,000 | $72 | 56 |
| 3482 Grayton St | 0.58mi | 3/1.0 | 1,097 (+12%) | 3mo | $140,000 | $128 | 50 |
| 5271 Marseilles St | 0.59mi | 3/1.0 | 1,100 (+12%) | 5mo | $75,000 | $68 | 48 |
| 866 Lincoln Rd | 0.47mi | 2/2.0 (-1) | 1,104 (+13%) | 1mo | $249,000 | $226 | 47 |
| 415 Lothrop Rd | 0.60mi | 2/1.5 (-1) | 1,098 (+12%) | 6mo | $245,000 | $223 | 40 |
Match score weights: distance 35% · size 25% · config 20% · recency 20%. Top-matched comps best support the ARV.
Projected returns pro-forma
-3.0% appreciation · 0.73% rent growth · sell at horizon
- IRR
- —
- Equity multiple
- 15.74×
- Total profit
- $57,796
- Equity at exit
- $2,087
- IRR
- —
- Equity multiple
- 31.52×
- Total profit
- $119,629
- Equity at exit
- $1,210
Cash invested: $3,920 (down + closing). Projections, not guarantees.
Landlord ↔ Tenant lean methodology
- Overall (STATE)
- 62 Landlord-Friendly
- State Michigan
- 62 Landlord-Friendly · EVEN
- County
- — inherits STATE
- City
- — inherits STATE
ZIP-level market 48224
- Rents YoY
- 0.7%
- Active inventory
- 492
- Price-to-rent
- 0.8×
Monthly cashflow live
- Estimated rent
- $1,377 high interval (Pro) →
- Mortgage (P&I)
- −$73
- Tax est. 1.5%
- −$18 /mo · $210/yr
- Insurance
- −$6
- HOA
- −$0
- Vacancy / Maint / Mgmt
- −$289
- Net cashflow
- $991
Break-even live
Sensitivity live
| Price | -10% $1,001 | -5% $996 | +0% $991 | +5% $986 | +10% $981 |
|---|---|---|---|---|---|
| Rent | -10% $882 | -5% $937 | +0% $991 | +5% $1,045 | +10% $1,100 |
| Rate | -1.0pp $998 | -0.5pp $995 | base $991 | +0.5pp $987 | +1.0pp $984 |
UW: 25.0% down · 7.5% · 30yr · 1.5% tax · 5.0% vac · 8.0% maint · 8.0% mgmt
Financing live
Cash to close
- Down payment
- $3,500
- Closing costs
- $420
- Reserves months
- —
- Total cash needed
- —
Loan-product check · same deal, 3 products live
Conventional
25% down · 7.5% · 30yr
- Down + closing
- —
- Monthly P&I
- —
- Monthly cashflow
- —
- DSCR
- —
- Eligible?
- —
Personal DTI + credit; lowest rate.
DSCR
20% down · 8.5% · 30yr
- Down + closing
- —
- Monthly P&I
- —
- Monthly cashflow
- —
- DSCR
- —
- Eligible?
- —
No personal income docs; deal must DSCR.
Hard money
10% down · 12.0% · 12mo
- Down + closing
- —
- Monthly P&I
- —
- Monthly cashflow
- —
- DSCR
- —
- Eligible?
- —
Short-term bridge; refi at stabilization.
Rent comps 37 comps
| Address | Beds | Baths | Sqft | Rent | $/sqft | DOM | Units | Dist |
|---|---|---|---|---|---|---|---|---|
| 17137 Ontario St Unit 1 Detroit, MI | 2.0 | 1.0 | 982 | $1,123 | $1.14 | 26d | 1 | 0.31mi |
| 4811 Cadieux Rd Unit 10 Detroit, MI | 2.0 | 1.0 | 663 | $1,200 | $1.81 | 45d | 1 | 0.38mi |
| 4811 Cadieux Rd Unit 11 Detroit, MI | 2.0 | 1.0 | 663 | $1,200 | $1.81 | 23d | 1 | 0.38mi |
| 4837 Cadieux Rd Unit 9 Detroit, MI | 2.0 | 1.0 | 650 | $1,200 | $1.85 | 45d | 1 | 0.40mi |
| 4865 Cadieux Rd Unit 11 Detroit, MI | 2.0 | 1.0 | 630 | $1,200 | $1.90 | 45d | 1 | 0.41mi |
| 890 Neff Rd Grosse Pointe, MI | 2.0 | 1.0 | 1100 | $2,000 | $1.82 | 26d | 1 | 0.42mi |
| 5786 Neff Ave Detroit, MI | 3.0 | 1.5 | 1100 | $1,225 | $1.11 | 18d | 1 | 0.84mi |
| 4627 Bedford St Unit 1 Detroit, MI | 2.0 | 1.0 | 1050 | $945 | $0.90 | 21d | 1 | 0.93mi |
| 5955 Guilford St Detroit, MI | 3.0 | 1.0 | 802 | $1,400 | $1.75 | 19d | 1 | 0.94mi |
| 5915 Farmbrook St Detroit, MI | 3.0 | 1.5 | 1000 | $1,250 | $1.25 | 26d | 1 | 0.95mi |
| 5028 Bedford St Detroit, MI | 3.0 | 1.0 | 1000 | $1,400 | $1.40 | 6d | 1 | 0.97mi |
| 5783 Yorkshire Rd Detroit, MI | 2.0 | 1.0 | 1040 | $1,200 | $1.15 | 45d | 1 | 0.99mi |
| 5031 Bedford St Detroit, MI | 2.0 | 1.0 | 876 | $1,870 | $2.13 | 0d | 1 | 1.00mi |
| 6181 Neff Ave Detroit, MI | 3.0 | 1.0 | 1102 | $1,299 | $1.18 | 19d | 1 | 1.08mi |
| 6175 Marseilles St Detroit, MI | 3.0 | 1.0 | 1100 | $1,100 | $1.00 | 45d | 1 | 1.09mi |
| 5112 Haverhill St Unit 1 Detroit, MI | 2.0 | 1.0 | 1000 | $1,100 | $1.10 | 45d | 1 | 1.10mi |
| 5284 Devonshire Rd Detroit, MI | 2.0 | 1.0 | 650 | $1,050 | $1.62 | 26d | 1 | 1.10mi |
| 22148 Moross Rd Grosse Pointe, MI | 2.0 | 1.0 | 819 | $1,250 | $1.53 | 4d | 1 | 1.11mi |
| 22148 Moross Rd Grosse Pointe, MI | 2.0 | 1.0 | 819 | $1,250 | $1.53 | 19d | 1 | 1.11mi |
| 22144 Moross Rd Grosse Pointe, MI | 2.0 | 1.0 | 819 | $1,350 | $1.65 | 19d | 1 | 1.11mi |
| 22144 Moross Rd Grosse Pointe, MI | 2.0 | 1.0 | 819 | $1,350 | $1.65 | 4d | 1 | 1.11mi |
| 542 Neff Ln Grosse Pointe, MI | 2.0 | 1.0 | 900 | $1,595 | $1.77 | 45d | 1 | 1.12mi |
| 6304 Bluehill St Detroit, MI | 3.0 | 1.0 | 1088 | $1,500 | $1.38 | 45d | 1 | 1.14mi |
| 6325 Neff Ave Detroit, MI | 3.0 | 1.0 | 1000 | $1,500 | $1.50 | 4d | 1 | 1.15mi |
| 6301 Lodewyck St Detroit, MI | 3.0 | 1.0 | 1084 | $1,300 | $1.20 | 0d | 1 | 1.16mi |
| 6301 Lodewyck St Detroit, MI | 3.0 | 1.0 | 1084 | $1,300 | $1.20 | 14d | 1 | 1.16mi |
| 509 Saint Clair Ave Grosse Pointe, MI | 2.0 | 1.0 | 1000 | $1,300 | $1.30 | 45d | 1 | 1.19mi |
| 17710 Chester St Detroit, MI | 2.0 | 1.0 | 984 | $1,250 | $1.27 | 45d | 1 | 1.23mi |
| 17720 Chester St Detroit, MI | 2.0 | 1.0 | 986 | $1,250 | $1.27 | 45d | 1 | 1.23mi |
| 5235 Chatsworth St Detroit, MI | 2.0 | 1.0 | 900 | $1,050 | $1.17 | 45d | 1 | 1.30mi |
| 4151 Nottingham Rd Detroit, MI | 2.0 | 1.0 | 1022 | $1,275 | $1.25 | 19d | 1 | 1.37mi |
| 4391 Nottingham Rd Unit 4393 Detroit, MI | 2.0 | 1.0 | 1038 | $950 | $0.92 | 6d | 1 | 1.37mi |
| 389 Saint Clair Ave Grosse Pointe, MI | 2.0 | 2.0 | 1000 | $3,150 | $3.15 | 45d | 1 | 1.42mi |
| 21401 Kingsville St Harper Woods, MI | 2.0 | 1.0 | 944 | $1,200 | $1.27 | 26d | 1 | 1.42mi |
| 295 Rivard Blvd heuristic Grosse Pointe, MI | 2.0 | 1.0 | 1000 | $2,000 | $2.00 | 26d | 1 | 1.46mi |
| 10037 Grayton St Detroit, MI | 3.0 | 1.0 | 1000 | $1,400 | $1.40 | 5d | 1 | 1.47mi |
| 10542 Lanark St Detroit, MI | 3.0 | 1.0 | 1023 | $1,250 | $1.22 | 45d | 1 | 1.50mi |
Listing history 13 events
-
2026-06-21days on market $14,000 Active 19 DOM
-
2026-06-18days on market $14,000 Active 16 DOM
-
2026-06-17days on market $14,000 Active 15 DOM
-
2026-06-16days on market $14,000 Active 14 DOM
-
2026-06-15days on market $14,000 Active 13 DOM
-
2026-06-13days on market $14,000 Active 11 DOM
-
2026-06-13days on market $14,000 Active 10 DOM
-
2026-06-09days on market $14,000 Active 7 DOM
-
2026-06-08days on market $14,000 Active 6 DOM
-
2026-06-07days on market $14,000 Active 5 DOM
-
2026-06-04days on market $14,000 Active 2 DOM
-
2026-06-02remarks 699-char remark
Show marketing remark (761 chars)
Development opportunity! Close to East English Village and Grosse Pointe. Room sizes are estimates. Interested buyers must submit a complete proposal package for DLBA approval, including a project proposal, proof of funds, site plan or concept drawing, and proof of previous development experience. Sale is contingent upon execution of a DLBA Development Agreement. The Detroit Land Bank Authority is entitled to a tax recapture for the five (5) tax years following transfer of ownership. This provision may be incompatible with certain tax abatements, lot combinations, or assemblages. Waiver requests may be considered on a case-by-case basis and may require a payment in lieu of taxes, determined after DLBA review of the development pro forma and financing.
-
2026-06-02$14,000 Active 1 DOM
Show marketing remark (761 chars)
Development opportunity! Close to East English Village and Grosse Pointe. Room sizes are estimates. Interested buyers must submit a complete proposal package for DLBA approval, including a project proposal, proof of funds, site plan or concept drawing, and proof of previous development experience. Sale is contingent upon execution of a DLBA Development Agreement. The Detroit Land Bank Authority is entitled to a tax recapture for the five (5) tax years following transfer of ownership. This provision may be incompatible with certain tax abatements, lot combinations, or assemblages. Waiver requests may be considered on a case-by-case basis and may require a payment in lieu of taxes, determined after DLBA review of the development pro forma and financing.
ⓘ Source: listings_history table (triggers on properties + properties_extension) + one-shot
backfill from property_details.listing_events for pre-trigger history.
Climate risk First Street
- Flood 1/10 Low FEMA zone X (unshaded) · 0% chance over 30 yrs
- Wildfire 1/10 Low
- Heat 3/10 Moderate 6 d/yr ≥96°F today · 14 d/yr by 30 yrs out
- Wind 2/10 Low
- Air quality 3/10 Moderate 3 unhealthy d/yr today · 4 by 30 yrs out
Nearby sold comps map
Loading sold comps map…
Walkable amenities ~0.75 mi
Loading nearby amenities…
Taxation est. · year 1
- Rental income
- $16,523
- − Mortgage interest
- −$784
- − Property taxes
- −$210
- − Insurance
- −$70
- − Repairs & maintenance
- −$1,322
- − Management
- −$1,322
- − Depreciation
- −$407
- Taxable income
- $12,408
- Est. tax owed @ 24.0%
- −$2,978
- After-tax cash flow
- $8,914/yr
For passive investors: Depreciation is non-cash, so a rental often shows a tax loss while cash-flowing — sheltering income. Rental losses are passive: they offset passive income freely, and up to $25,000/yr can offset ordinary (W-2) income if you actively participate and your MAGI is under $100k (phasing out to $0 by $150k); unused losses carry forward. On sale, claimed depreciation is recaptured at up to 25%, and gains may owe capital-gains tax (a 1031 exchange can defer both). Figures are a year-1 estimate at your 24.0% rate — not tax advice; consult a CPA.
Schools (NCES district)
- District
- Detroit Public Schools Community District
- NCES district ID
- 2601103
- Math proficiency
- 10% ▼ -2.00%
- Reading proficiency
- 24% ▲ 6.00%
- Median HH income
- $25,815
- Composite
- 13.06/100
- National rank
- #9564
- State rank
- #499 of 540 in MI
Livability — Detroit
- Score
- 73/100
- State rank
- #218
- US rank
- #5427
Category grades
Schools grade is shown separately in the Schools card above.
Census & demographics
- Census place
- Detroit, MI
- County
- Wayne County · 1,562,939 people
- City population
- 572,865
- Metro
- Detroit-Warren-Dearborn, MI
- Population (ZIP)
- 39,668
- Household income
- $44,856
- Rent vs Own
- Severe rent burden
- 2515.0
Population outlook (Wayne County) Hauer SSP2
- Today (2025)
- 1,675,273 people
- By 2030
- 1,620,300 · -3.3%
- By 2040
- 1,502,341 · -10.3%
- By 2050
- 1,384,039 · -17.4%
- By 2075
- 1,124,592 · -32.9%
- By 2100
- 881,193 · -47.4%
Race, ethnicity, and origin ACS 2023
- Neighborhood character
- Predominantly Black (88%)
- Race & ethnicity
- Black 88% White 8% Two or more races 3% Hispanic / Latino 1%
- Common ancestry
- Iranian 1% Romanian 1% Lithuanian 1%
- Foreign-born
- 1%
- Languages at home
- 97% English-only · Spanish 2%
Political lean MEDSL · Wayne
- 2024 margin
- Strong D (+29.0) · D 62.7% · R 33.7% · Other 3.6%
- 2008→2024 swing
- -20.5pp toward R · 2008: 49.5pp · 2024: 29.0pp
- All cycles
- 2024: D+29.0 2020: D+38.1 2016: D+37.3 2012: D+46.9 2008: D+49.5
Not yet ingested
- Civics
- —
Market trends
- HPI YoY
- ▼ -226.38%
- Current HPI
- 161.886
- Rent YoY
- ▲ 0.73%
- Metro
- Detroit-Warren-Dearborn, MI
- State GDP YoY
- ▲ 1.37%
- F500 in state
- 28
Industry mix (Fortune 500 HQ in MI)
| Industry | F500 HQs | Revenue |
|---|---|---|
| Automotive Parts | 3 | $48B |
|
||
| Automotive | 2 | $372B |
|
||
| Chemicals | 1 | $45B |
|
||
| Automotive Retail | 1 | $29B |
|
||
| Healthcare / Medical Devices | 1 | $23B |
|
||
| Automotive Technology | 1 | $20B |
|
||
Price history
-71.4% since first listed5 events — show timeline
- 2026-06-02 Listed $14,000 REALCOMP
- 2026-06-02 Listed $14,000 MiRealSource-MiMLS
- 1998-07-30 Sold (Public Records) $50,000 Public Records
- 1996-09-30 Sold (Public Records) $23,000 Public Records
- 1996-09-30 Sold (Public Records) $49,000 Public Records
Property tax history
+11.5%/yrLatest (2025): $3,203 · +0.0% YoY. Source: county tax records.
Cash-flow waterfall
monthlySold comps — $/sqft
last 12 mo · ≤1 miLoading sold comps…