 🏷️ Likely Rental
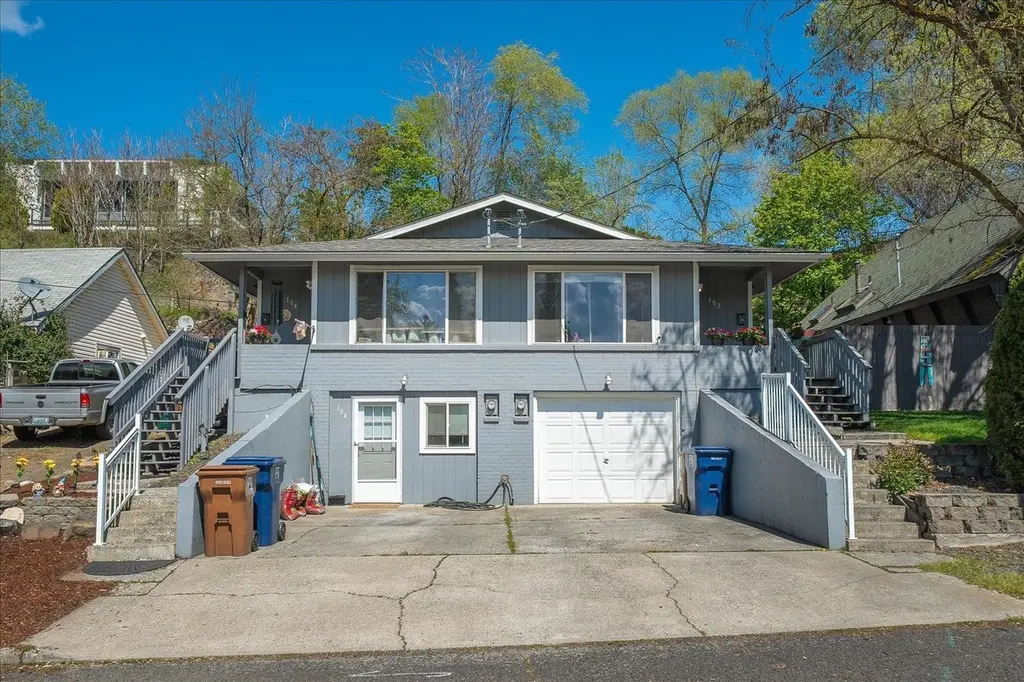
104 W Cora Ave Unit 102 W Cora Ave · Spokane, WA
Flood risk 1/10 · Minimal
- FEMA flood zone
- X (unshaded)
- Chance of flooding over 30 yrs
- 0.0%
- Est. flood insurance / yr
- $473 – $860
Fire risk 1/10 · Minimal
- Est. fire insurance / yr
- $604 – $1,122
Heat risk 3/10 · Minor
- Hot days now (above 94°F)
- 7 days/yr
- Hot days in 30 yrs
- 15 days/yr
Wind risk 1/10 · Minimal
- Chance of severe wind over 30 yrs
- —
Air-quality risk 10/10 · Severe
- Unhealthy air days now
- 19 days/yr
- Unhealthy air days in 30 yrs
- 21 days/yr
Risk factors via First Street. Map © Google.
Why this score? — see what drove the C grade
The composite is a weighted blend of 9 inputs, each scored 0–100. Each bar is that input's sub-score; the figure is the points it added to the 100-point composite (weight × sub-score).
- Cash flow +16.1/30.0
- ARV discount +15.0/15.0
- DSCR +5.0/10.0
- Schools +4.6/10.0
- 1% rule +4.4/10.0
- Livability +4.0/5.0
- Rent growth +3.3/5.0
- Condition / age +2.8/5.0
- Appreciation +0.0/10.0
$418,500
🖨 Deal sheet 📄 Offer letter ✓ Due diligence
Multi-family units
County records classify this as Multi-Family (2-4 Unit). Listing-text estimate: 2 units. confirmed
Listing remarks
UPDATED PRICE! Turnkey duplex with immediate cash flow in a great central Spokane location offering an excellent opportunity for owner-occupants or investors alike. Live in one unit and offset your monthly mortgage with rental income from the other, or continue operating as a straightforward investment. Current gross rent of $3,400/month ($40,800/year). This side-by-side duplex features two spacious units, one configured as a 4-bedroom and the other as a 3-bedroom with garage space. Both units offer private fenced backyard patio areas and off-street parking. Well-maintained with consistent updates during current ownership, including landscaping and drainage improvements, full yard fencing,
Key facts
- 6,098 sq ft lot
- Garage
- Built 1974
Property features AI
Finance
- Other: Total building area approximately 3,100 (public records); Two total units (one 4-bed/2-bath unit and one 3-bed/2-bath unit)
- HOA & community: No community or association amenities
Exterior
- Parking: Attached underground garage with 1 garage space
- Utilities: High-speed internet available
- Home design: Residential income duplex; Duplex structure
- Construction: Wood siding; Composition roof
- Exterior features: Patio; Fenced yard; Hillside lot; City bus service within ~6 blocks; Paved city street frontage
Interior
- Kitchen: Free-standing range; Dishwasher; Refrigerator
- Bedrooms: One unit with 4 bedrooms; One unit with 3 bedrooms
- Bathrooms: Each unit has 2 bathrooms
- Heating & cooling: Electric baseboard heating; Window air conditioning units
- Interior features: Finished full basement with daylight windows and walk-out access; Appliances include free-standing range, dishwasher, and refrigerator
- Laundry & utility: Washer and dryer included
Neighborhood map
What this means for you Summary
Snapshot
- This is a 1×4bd/2.0ba + 1×3bd/2.0ba units multifamily listed at $418k. Condition is rated average.
Deal economics
- At list price, monthly cash flow is $216 ($3k/yr) — positive. Per door: $108/mo.
- The deal already cash-flows at list — no discount required.
- To meet the 1% rule (rent ≥ 1% of price), the offer needs to be $394k (6.0% below list).
- Recommended offer: $394k (6.0% below list) — sets the bar for 1% rule.
- Cap rate 6.9% vs local median 3.2% in Spokane — top-decile yield for the area; either an underpriced asset or a hidden risk that comps aren't pricing in. Stress-test before assuming the spread holds.
Location & tenants
- Location reads 80/100 on livability (#93 in WA, #1,822 nationally) — a professional / high-income tenant draw. Strengths: amenities A+, commute A+, housing A+; Watch: crime F.
- Spokane School District (urban): math 47% / reading 58% proficiency, ranked #136 of 291 in WA (top 47%) — acceptable for families but not a draw, mixed tenant base, ~2y average lease.
- Zoned schools: Garfield Elementary (382 students, 79% FRL); North Central High School (1,674 students, 64% FRL) — zoned schools average 71% FRL vs 50% district-wide (22 pts higher); higher-poverty schools than district average — tighter screening recommended.
- Market conditions: Rents rising (+3.2%/yr); 324 active listings in the ZIP; solid renter incomes; 3,608 units permitted in Spokane County in 2024 (1,792 in 5+ unit buildings).
- At $3,935/mo this rent would consume 61% of the median local household income ($77k/yr) (locally 965% of renters already pay >50% of income on rent) — very limited rent-growth headroom before tenants either downsize or default.
Forward outlook
- Local home prices are declining (-3.0%/yr); year-one equity from $3k of loan paydown is wiped out by about $13k of value loss. Plan a longer hold.
- Spokane County population projected at +13% by 2050 — modest demand growth; plan on rents tracking national, not racing it.
Negotiation context
- It's been on market 35 days — a 3% lower offer ($406k) is reasonable based on typical stale-listing flexibility.
Questions for the listing agent
- It's been on market 35 days. Have you received any prior offers? Is the seller open to a 6% concession, seller financing, or rate buy-down credit?
- Can we see the unit-by-unit rent roll, current vacancy, and any below-market leases? What's the average tenancy length?
- What capital expenditures (roof, boiler, parking lot, exteriors) have been made in the last 5 years, and what's planned in the next 2?
- Built in 1974 — when were the roof, HVAC, electrical panel, plumbing, and water heater last replaced?
- Is there a deadline driving the sale (1031 exchange, divorce, estate, relocation)? That informs how much negotiation room exists.
- Schools are B-rated — typically a magnet for longer-tenancy family renters. What's the average tenant stay here, and is there a school-zone premium baked into asking?
- Crime grade is F in this area — have there been break-ins, vandalism, or insurance claims at this property in the last 3 years? What carrier currently insures it and at what premium?
- What's the average days-on-market for RENTAL listings here right now (not sales)? A rising rental-DOM trend means longer vacancies and softer asking-rent achievability than the comps imply.
- What's the recent tenant-quality profile in this submarket — average credit score on applications, eviction rate, late-payment / NSF rate, and stable-employment percentage? A property-management company in the area should have these aggregated.
- How much new apartment / multifamily construction is in the pipeline within 1–3 miles? Heavy new supply (>2% of stock underway) typically softens rents 12–24 months out; light construction supports rent growth.
Investment metrics
- 1% rule
- 0.94% ✗
- Cap rate
- 6.91%
- Cash-on-cash
- 2.22%
- DSCR
- 1.10
- GRM
- 8.9
CMA / ARV
- ARV (on-the-fly)
- $561,100
- Comps found
- 2
Show comp detail 2 sales within ~0.75 mi
| Address | Dist | Beds/Ba | Sqft | Sold | Price | $/sf | Match |
|---|---|---|---|---|---|---|---|
| 620 E Euclid Ave | 0.56mi | 7/4.0 (-1) | 2,760 (-11%) | 7mo | $500,000 | $181 | 44 |
| 702-704 E Bridgeport Ave | 0.62mi | 8/4.0 | 3,360 (+8%) | 18mo | $485,000 | $144 | 42 |
Match score weights: distance 35% · size 25% · config 20% · recency 20%. Top-matched comps best support the ARV.
Projected returns pro-forma
-3.0% appreciation · 3.23% rent growth · sell at horizon
- IRR
- -12.5%
- Equity multiple
- 0.55×
- Total profit
- $-53,055
- Equity at exit
- $62,400
- IRR
- -3.1%
- Equity multiple
- 0.79×
- Total profit
- $-24,440
- Equity at exit
- $36,184
Cash invested: $117,180 (down + closing). Projections, not guarantees.
Landlord ↔ Tenant lean methodology
- Overall (STATE)
- 28 Tenant-Leaning
- State Washington
- 28 Tenant-Leaning · D+8
- County
- — inherits STATE
- City
- — inherits STATE
ZIP-level market 99205
- Rents YoY
- 3.2%
- Active inventory
- 324
- Price-to-rent
- 16.9×
Monthly cashflow live
- Estimated rent
- $3,935 high interval (Pro) →
- Mortgage (P&I)
- −$2,195
- Tax est. 1.5%
- −$523 /mo · $6,278/yr
- Insurance
- −$174
- HOA
- −$0
- Vacancy / Maint / Mgmt
- −$826
- Net cashflow
- $216
Break-even live
2-unit breakdown (identical units grouped — click to expand)
| Units | Beds | Baths | Est. rent |
|---|---|---|---|
| 1× unit | 4 | 2 | $2,067 |
| 1× unit | 3 | 2 | $1,868 |
| Total (2 units) | $3,935 | ||
UW: 25.0% down · 7.5% · 30yr · 1.5% tax · 5.0% vac · 8.0% maint · 8.0% mgmt
Financing live
Cash to close
- Down payment
- $104,625
- Closing costs
- $12,555
- Reserves months
- —
- Total cash needed
- —
Loan-product check · same deal, 3 products live
Conventional
25% down · 7.5% · 30yr
- Down + closing
- —
- Monthly P&I
- —
- Monthly cashflow
- —
- DSCR
- —
- Eligible?
- —
Personal DTI + credit; lowest rate.
DSCR
20% down · 8.5% · 30yr
- Down + closing
- —
- Monthly P&I
- —
- Monthly cashflow
- —
- DSCR
- —
- Eligible?
- —
No personal income docs; deal must DSCR.
Hard money
10% down · 12.0% · 12mo
- Down + closing
- —
- Monthly P&I
- —
- Monthly cashflow
- —
- DSCR
- —
- Eligible?
- —
Short-term bridge; refi at stabilization.
Listing history 10 events
-
2026-06-10status $418,500 Pending 35 DOM
-
2026-06-09days on market $418,500 Active 35 DOM
-
2026-06-08days on market $418,500 Active 34 DOM
-
2026-06-07days on market $418,500 Active 33 DOM
-
2026-06-03days on market $418,500 Active 29 DOM
-
2026-06-02days on market $418,500 Active 28 DOM
-
2026-06-01days on market $418,500 Active 27 DOM
-
2026-05-31days on market $418,500 Active 26 DOM
-
2026-05-31days on market $418,500 Active 25 DOM
-
2026-05-05$425,000 Active
ⓘ Source: listings_history table (triggers on properties + properties_extension) + one-shot
backfill from property_details.listing_events for pre-trigger history.
Climate risk First Street
- Flood 1/10 Low FEMA zone X (unshaded) · 0% chance over 30 yrs
- Wildfire 1/10 Low
- Heat 3/10 Moderate 7 d/yr ≥94°F today · 15 d/yr by 30 yrs out
- Wind 1/10 Low
- Air quality 10/10 Extreme 19 unhealthy d/yr today · 21 by 30 yrs out
Nearby sold comps map
Loading sold comps map…
Walkable amenities ~0.75 mi
Loading nearby amenities…
Taxation est. · year 1
- Rental income
- $47,220
- − Mortgage interest
- −$23,443
- − Property taxes
- −$6,278
- − Insurance
- −$2,092
- − Repairs & maintenance
- −$3,778
- − Management
- −$3,778
- − Depreciation
- −$12,175
- Taxable loss
- −$4,322
- Est. tax savings @ 24.0%
- +$1,037
- After-tax cash flow
- $3,635/yr
For passive investors: Depreciation is non-cash, so a rental often shows a tax loss while cash-flowing — sheltering income. Rental losses are passive: they offset passive income freely, and up to $25,000/yr can offset ordinary (W-2) income if you actively participate and your MAGI is under $100k (phasing out to $0 by $150k); unused losses carry forward. On sale, claimed depreciation is recaptured at up to 25%, and gains may owe capital-gains tax (a 1031 exchange can defer both). Figures are a year-1 estimate at your 24.0% rate — not tax advice; consult a CPA.
Condition & rehab AI · 12 photos
This two-unit duplex requires moderate renovations to improve its curb appeal and interior aesthetics, which can significantly increase its resale and rental value.
Repairs flagged
- Minor Kitchen backsplash — Worn and dated appearance
- Minor Bathroom fixtures — Signs of wear
- Moderate Exterior siding — Weathered appearance
- Moderate Windows — Signs of wear
- Moderate Carpeted floors — Worn appearance
- Moderate Paint — Faded appearance
- Moderate HVAC system — Dated appearance
- Moderate Electrical outlets and switches — Worn appearance
Value-add opportunities
- Both Painting and updating kitchen backsplash — Fresh paint and updated backsplash can significantly improve the home's curb appeal and interior aesthetics.
- Both HVAC system upgrade — A new HVAC system can improve comfort and energy efficiency, making the home more attractive to buyers and renters.
- Both Window replacement — New windows can improve energy efficiency, reduce heating and cooling costs, and enhance the home's curb appeal.
- Both Exterior siding repair and painting — A fresh coat of paint and repairs to the siding can significantly improve the home's curb appeal and increase its value.
- Both Floor refinishing and carpet cleaning — Fresh floors and clean carpets can make the home more attractive to buyers and renters, especially in the rental market.
- Both Electrical outlet replacement and lighting upgrades — Upgrading the electrical outlets and adding modern lighting fixtures can improve the home's functionality and aesthetics, making it more attractive to buyers and renters.
- Both Landscaping and curb appeal improvements — A well-maintained and landscaped yard can significantly improve the home's curb appeal and increase its value, both in the resale and rental markets.
Renovation cost estimate screening
| Repair item | Severity | Est. cost |
|---|---|---|
| Kitchen backsplash · Worn and dated appearance | Minor | $500–3,000 |
| Bathroom fixtures · Signs of wear | Minor | $500–3,000 |
| Exterior siding · Weathered appearance | Moderate | $3,000–15,000 |
| Windows · Signs of wear | Moderate | $3,000–15,000 |
| Carpeted floors · Worn appearance | Moderate | $3,000–15,000 |
| Paint · Faded appearance | Moderate | $3,000–15,000 |
| HVAC system · Dated appearance | Moderate | $3,000–15,000 |
| Electrical outlets and switches · Worn appearance | Moderate | $3,000–15,000 |
| Total estimated repair cost · 8 items | $19,000–96,000 |
Value-add ROI direction
- Both Painting and updating kitchen backsplash — Fresh paint and updated backsplash can significantly improve the home's curb appeal and interior aesthetics. ↑
- Both HVAC system upgrade — A new HVAC system can improve comfort and energy efficiency, making the home more attractive to buyers and renters. ↑
- Both Window replacement — New windows can improve energy efficiency, reduce heating and cooling costs, and enhance the home's curb appeal. ↑
- Both Exterior siding repair and painting — A fresh coat of paint and repairs to the siding can significantly improve the home's curb appeal and increase its value. ↑
- Both Floor refinishing and carpet cleaning — Fresh floors and clean carpets can make the home more attractive to buyers and renters, especially in the rental market. ↑
- Both Electrical outlet replacement and lighting upgrades — Upgrading the electrical outlets and adding modern lighting fixtures can improve the home's functionality and aesthetics, making it more attractive to buyers and renters. ↑
- Both Landscaping and curb appeal improvements — A well-maintained and landscaped yard can significantly improve the home's curb appeal and increase its value, both in the resale and rental markets. ↑
ⓘ Cost ranges are severity-bucket heuristics (US national rule-of-thumb). Get contractor quotes + a written scope before underwriting a rehab budget.
Schools (NCES district)
- District
- Spokane School District
- NCES district ID
- 5308250
- Math proficiency
- 47% ▲ 1.00%
- Reading proficiency
- 58% ▲ 1.00%
- Median HH income
- $43,187
- Composite
- 46.1/100
- National rank
- #5477
- State rank
- #136 of 291 in WA
Livability — Spokane
- Score
- 80/100
- State rank
- #93
- US rank
- #1822
Category grades
Schools grade is shown separately in the Schools card above.
Census & demographics
- Census place
- Spokane, WA
- County
- Spokane County · 496,401 people
- City population
- 298,820
- Metro
- Spokane-Spokane Valley, WA
- Population (ZIP)
- 43,169
- Household income
- $77,374
- Rent vs Own
- Severe rent burden
- 965.0
Population outlook (Spokane County) Hauer SSP2
- Today (2025)
- 531,314 people
- By 2030
- 549,278 · +3.4%
- By 2040
- 577,822 · +8.8%
- By 2050
- 598,188 · +12.6%
- By 2075
- 630,744 · +18.7%
- By 2100
- 622,360 · +17.1%
Race, ethnicity, and origin ACS 2023
- Neighborhood character
- Predominantly White (81%)
- Race & ethnicity
- White 81% Two or more races 10% Hispanic / Latino 7% Asian 2% Black 1% Native American 1%
- Hispanic origin (detail)
- Mexican 4%
- Common ancestry
- Portuguese 5% Slovak 3% Romanian 2%
- Foreign-born
- 3% · Canada, Philippines
- Languages at home
- 94% English-only · Spanish 2% Other Asian/Pacific 1% Russian/Polish/Slavic 1%
Political lean MEDSL · Spokane
- 2024 margin
- Toss-up / Even · D 46.0% · R 51.0% · Other 3.0%
- 2008→2024 swing
- -3.8pp toward R · 2008: -1.1pp · 2024: -5.0pp
- All cycles
- 2024: R+5.0 2020: R+4.3 2016: R+8.3 2012: R+6.3 2008: R+1.1
Not yet ingested
- Civics
- —
Market trends
- HPI YoY
- ▼ -475.69%
- Current HPI
- 377.1519
- Rent YoY
- ▲ 3.23%
- Metro
- Spokane-Spokane Valley, WA
- State GDP YoY
- ▲ 4.65%
- F500 in state
- 22
Industry mix (Fortune 500 HQ in WA)
| Industry | F500 HQs | Revenue |
|---|---|---|
| Retail | 2 | $269B |
|
||
| Technology / Retail | 1 | $638B |
|
||
| Technology | 1 | $245B |
|
||
| Telecommunications | 1 | $38B |
|
||
| Food / Beverage | 1 | $36B |
|
||
| Automotive / Trucks | 1 | $34B |
|
||
Price history
1 event — show timeline
- 2026-05-05 Listed $425,000 SPOKANEMLS as Distributed by MLS Grid
Cash-flow waterfall
monthlySold comps — $/sqft
last 12 mo · ≤1 miLoading sold comps…