 🏗️ New Construction
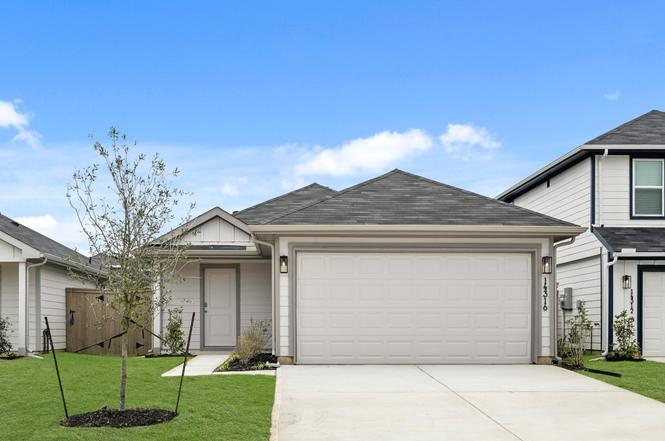
14316 Leafy Willow Dr · Splendora, TX
Flood risk No data
- FEMA flood zone
- —
- Chance of flooding over 30 yrs
- —
- Est. flood insurance / yr
- —
Fire risk No data
- Est. fire insurance / yr
- —
Heat risk No data
- Hot days now (above threshold)
- —
- Hot days in 30 yrs
- —
Wind risk No data
- Chance of severe wind over 30 yrs
- —
Air-quality risk No data
- Unhealthy air days now
- —
- Unhealthy air days in 30 yrs
- —
Risk factors via First Street. Map © Google.
Why this score? — see what drove the D+ grade
The composite is a weighted blend of 9 inputs, each scored 0–100. Each bar is that input's sub-score; the figure is the points it added to the 100-point composite (weight × sub-score).
- Cash flow +18.8/30.0
- ARV discount +7.5/15.0
- DSCR +5.9/10.0
- 1% rule +4.3/10.0
- Livability +3.1/5.0
- Rent growth +2.5/5.0
- Schools +2.5/10.0
- Condition / age +2.5/5.0
- Appreciation +1.8/10.0
$227,990
🖨 Deal sheet (PDF) 📄 Offer letter ✓ Due diligence
Listing remarks
AMAZING NEW D. R. HORTON BUILT 1 STORY 4 BEDROOM IN THE CANOPIES! Excellent Location! Wonderful Open Concept Interior Layout + Great Split Plan Design! Island Kitchen Opens to Spacious Dining Area & Large Living Room! Privately Located Primary Suite Features Lovely Bath with Large Shower & BIG Walk-In Closet! Generously Sized Secondary Bedrooms! Convenient Indoor Utility Room with Access into Garage! Wonderful Community with Park - PLUS Easy Access to Highway 59! Move In Ready!
Key facts
- Large shower
- Island kitchen
- Large living room
Tags
Property features AI
Finance
- HOA & community: Association: Vision Communities Management; Annual association fee; Community amenities: pool, playground, park, picnic area, trails, curbs
Exterior
- Parking: Attached 2-car garage
- Security: Smoke detector(s)
- Utilities: Public water; Public sewer
- Home design: Residential property; Southeast-facing; Under construction (new construction); Slab foundation
- Construction: Built in 2025; Cement siding; Composition roof
- Exterior features: Porch; Private yard; Fence (back yard); Subdivision setting; Concrete road surface
Interior
- Kitchen: Dishwasher; Free-standing range; Gas oven; Gas range; Microwave; Oven; Disposal; Quartz countertops
- Bedrooms: Primary bedroom (First floor) — 14 x 12; Bedroom (First floor) — 10 x 10; Bedroom (First floor) — 10 x 10; Bedroom (First floor) — 10 x 10
- Flooring: Carpet; Plank; Vinyl
- Bathrooms: 2 full bathrooms
- Heating & cooling: Central heating (gas); Central air (electric)
- Interior features: Breakfast bar; High ceilings; Kitchen island; Kitchen/family room combo; Kitchen/dining combo; Living/dining room; Walk-in pantry; Tub with shower; Programmable thermostat; Low emissivity windows
- Laundry & utility: Washer hookup; Electric dryer hookup; Tankless water heater
Neighborhood map
What this means for you Summary
Snapshot
- This is a 4-bed/2.0-bath land listed at $228k.
Deal economics
- At list price, monthly cash flow is $230 ($3k/yr) — positive.
- The deal already cash-flows at list — no discount required.
- To meet the 1% rule (rent ≥ 1% of price), the offer needs to be $211k (7.4% below list).
- Recommended offer: $201k (12.0% below list) — sets the bar for market timing.
- Cap rate 7.5% vs local median 5.2% in Splendora — top-decile yield for the area; either an underpriced asset or a hidden risk that comps aren't pricing in. Stress-test before assuming the spread holds.
Location & tenants
- Location reads 62/100 on livability (#911 in TX) — a middle-class / working-renter tenant base. Strengths: cost of living A+, housing A+; Watch: amenities F, commute F, health & safety F.
- Splendora ISD (rural): math 25% / reading 31% proficiency, ranked #648 of 826 in TX (top 78%) — low school quality limits family demand, transient renter base, plan for 1-2y turnover.
- Zoned schools: Piney Woods El (math 23% / reading 28%, grade F, #2,982 of 4,322 statewide, top 70%, 534 students, 55% FRL); Splendora J H (math 28% / reading 42%, grade F, #842 of 1,662 statewide, top 51%, 774 students, 62% FRL); Splendora H S (math 18% / reading 38%, grade F, #1,170 of 1,632 statewide, top 72%, 1,344 students, 59% FRL) — zoned schools at 59% FRL track the district average.
- Market conditions: 548 active listings in the ZIP; solid renter incomes; 13,259 units permitted in Montgomery County in 2024 (1,402 in 5+ unit buildings).
- This rent runs 32% of the median local income ($79k/yr) — at the standard rent-burdened threshold; future hikes will face affordability resistance.
Forward outlook
- Local home prices are declining (-3.0%/yr); year-one equity from $2k of loan paydown is wiped out by about $7k of value loss. Plan a longer hold.
- Montgomery County population projected at +65% by 2050 — long-run rental-demand tailwind backs the buy-and-hold thesis.
Negotiation context
- It's been on market 394 days — a 12% lower offer ($201k) is reasonable based on typical stale-listing flexibility.
- 3 sale attempts; this cycle's ask has dropped $27k (11%) from the opening price — seller is motivated, your offer sets the floor, not the list.
Questions for the listing agent
- It's been on market 394 days. Have you received any prior offers? Is the seller open to a 12% concession, seller financing, or rate buy-down credit?
- What does the HOA fee cover, when was the last increase, and are there any pending special assessments or reserve-fund shortfalls?
- Why hasn't it sold? Are there any deal-killer items the seller is aware of (foundation, flood, title, zoning, code violations)?
- Is there a deadline driving the sale (1031 exchange, divorce, estate, relocation)? That informs how much negotiation room exists.
- Schools are F-rated, which usually means shorter tenancies and higher turnover. Who's the typical renter profile here, and what's been the actual vacancy rate?
- The area grade is low — what's the realistic commute time and amenity access for the typical tenant pool here? Any planned neighborhood developments (good or bad) we should know about?
- What's the average days-on-market for RENTAL listings here right now (not sales)? A rising rental-DOM trend means longer vacancies and softer asking-rent achievability than the comps imply.
- What's the recent tenant-quality profile in this submarket — average credit score on applications, eviction rate, late-payment / NSF rate, and stable-employment percentage? A property-management company in the area should have these aggregated.
- How much new for-sale + rental construction is in the pipeline within 1–3 miles? Heavy new supply typically softens prices + rents 12–24 months out; constrained supply supports both.
Investment metrics
- 1% rule
- 0.93% ✗
- Cap rate
- 7.50%
- Cash-on-cash
- 4.32%
- DSCR
- 1.19
- GRM
- 9.0
CMA / ARV
No comps found within radius.
Projected returns pro-forma
-3.0% appreciation · 3.0% rent growth · sell at horizon
- IRR
- -9.6%
- Equity multiple
- 0.65×
- Total profit
- $-22,365
- Equity at exit
- $33,994
- IRR
- -0.2%
- Equity multiple
- 0.99×
- Total profit
- $-850
- Equity at exit
- $19,712
Cash invested: $63,837 (down + closing). Projections, not guarantees.
Landlord ↔ Tenant lean methodology
- Overall (STATE)
- 87 Strongly Landlord-Friendly
- State Texas
- 87 Strongly Landlord-Friendly · R+5
- County
- — inherits STATE
- City
- — inherits STATE
ZIP-level market 77372
- Home prices YoY
- -2.1%
- Active inventory
- 548
- Price-to-rent
- 9.0×
Monthly cashflow live
- Estimated rent
- $2,110 medium interval (Pro) →
- Mortgage (P&I)
- −$1,196
- Tax from tax record
- −$84 /mo · $1,007/yr
- Insurance
- −$95
- HOA
- −$63
- Vacancy / Maint / Mgmt
- −$443
- Net cashflow
- $230
Break-even live
Sensitivity live
| Price | -10% $359 | -5% $294 | +0% $230 | +5% $165 | +10% $101 |
|---|---|---|---|---|---|
| Rent | -10% $63 | -5% $146 | +0% $230 | +5% $313 | +10% $396 |
| Rate | -1.0pp $345 | -0.5pp $288 | base $230 | +0.5pp $171 | +1.0pp $111 |
UW: 25.0% down · 7.5% · 30yr · 1.5% tax · 5.0% vac · 8.0% maint · 8.0% mgmt
Financing live
Cash to close
- Down payment
- $56,998
- Closing costs
- $6,840
- Reserves months
- —
- Total cash needed
- —
Loan-product check · same deal, 3 products live
Conventional
25% down · 7.5% · 30yr
- Down + closing
- —
- Monthly P&I
- —
- Monthly cashflow
- —
- DSCR
- —
- Eligible?
- —
Personal DTI + credit; lowest rate.
DSCR
20% down · 8.5% · 30yr
- Down + closing
- —
- Monthly P&I
- —
- Monthly cashflow
- —
- DSCR
- —
- Eligible?
- —
No personal income docs; deal must DSCR.
Hard money
10% down · 12.0% · 12mo
- Down + closing
- —
- Monthly P&I
- —
- Monthly cashflow
- —
- DSCR
- —
- Eligible?
- —
Short-term bridge; refi at stabilization.
HOA detail
- Monthly dues
- $63 · $756/yr
Listing history 32 events
-
2026-06-21days on market $227,990 Active 394 DOM
-
2026-06-18days on market $227,990 Active 391 DOM
-
2026-06-17days on market $227,990 Active 390 DOM
-
2026-06-16days on market $227,990 Active 389 DOM
-
2026-06-15days on market $227,990 Active 388 DOM
-
2026-06-13days on market $227,990 Active 386 DOM
-
2026-06-13days on market $227,990 Active 385 DOM
-
2026-06-09days on market $227,990 Active 382 DOM
-
2026-06-08days on market $227,990 Active 381 DOM
-
2026-06-07days on market $227,990 Active 380 DOM
-
2026-06-04days on market $227,990 Active 377 DOM
-
2026-06-03days on market $227,990 Active 376 DOM
-
2026-06-02days on market $227,990 Active 375 DOM
-
2026-06-02pricestatus $227,990 Active 374 DOM
-
2026-06-01days on market $233,990 Active Under Contract 374 DOM
-
2026-05-31days on market $233,990 Active Under Contract 373 DOM
-
2026-04-05historical Active Under Contract
-
2026-03-23price $233,990
-
2026-03-16price $234,990
-
2026-03-10price $237,990
-
2026-01-09status Active
-
2026-01-09price $238,880
-
2025-11-01historical Active Under Contract
-
2025-10-30price $232,990
-
2025-10-30status Active
-
2025-08-05historical Active Under Contract
-
2025-07-22price $238,990
-
2025-07-18price $240,990
-
2025-07-04price $242,990
-
2025-06-24price $244,990
-
2025-06-05price $249,990
-
2025-05-23$254,990 Active
ⓘ Source: listings_history table (triggers on properties + properties_extension) + one-shot
backfill from property_details.listing_events for pre-trigger history.
Tax reassessment forecast TX · Resets to sale price
- Current annual tax
- $1,007 · $84/mo
- Projected year-2 tax
- $4,172 · $348/mo
- Expected delta
- +$3,165/yr (+$264/mo · 314.3%)
ⓘ Screening estimate from a state-policy table — verify with the county assessor before closing.
Nearby sold comps map
Loading sold comps map…
Walkable amenities ~0.75 mi
Loading nearby amenities…
Taxation est. · year 1
- Rental income
- $25,325
- − Mortgage interest
- −$12,771
- − Property taxes
- −$1,007
- − Insurance
- −$1,140
- − Repairs & maintenance
- −$2,026
- − Management
- −$2,026
- − HOA
- −$756
- − Depreciation
- −$6,632
- Taxable loss
- −$1,033
- Est. tax savings @ 24.0%
- +$248
- After-tax cash flow
- $3,005/yr
For passive investors: Depreciation is non-cash, so a rental often shows a tax loss while cash-flowing — sheltering income. Rental losses are passive: they offset passive income freely, and up to $25,000/yr can offset ordinary (W-2) income if you actively participate and your MAGI is under $100k (phasing out to $0 by $150k); unused losses carry forward. On sale, claimed depreciation is recaptured at up to 25%, and gains may owe capital-gains tax (a 1031 exchange can defer both). Figures are a year-1 estimate at your 24.0% rate — not tax advice; consult a CPA.
Schools (NCES district)
- District
- Splendora ISD
- NCES district ID
- 4841070
- Math proficiency
- 25% ▼ -8.00%
- Reading proficiency
- 31% ▼ -1.00%
- Median HH income
- $54,166
- Composite
- 24.92/100
- National rank
- #7572
- State rank
- #648 of 826 in TX
Livability — Splendora
- Score
- 62/100
- State rank
- #911
- US rank
- #16335
Category grades
Schools grade is shown separately in the Schools card above.
Census & demographics
- County
- Montgomery County · 663,713 people
- City population
- 14,367
- Metro
- Houston-The Woodlands-Sugar Land, TX
- Population (ZIP)
- 14,367
- Household income
- $79,085
- Rent vs Own
- Severe rent burden
- 135.0
Population outlook (Montgomery County) Hauer SSP2
- Today (2025)
- 713,896 people
- By 2030
- 805,263 · +12.8%
- By 2040
- 992,708 · +39.1%
- By 2050
- 1,179,590 · +65.2%
- By 2075
- 1,628,084 · +128.1%
- By 2100
- 1,937,880 · +171.5%
Race, ethnicity, and origin ACS 2023
- Neighborhood character
- Majority White (61%)
- Race & ethnicity
- White 61% Hispanic / Latino 36% Two or more races 9% Native American 1%
- Hispanic origin (detail)
- Mexican 32%
- Common ancestry
- Lithuanian 4% Italian 2% Slovak 1%
- Foreign-born
- 9% · Canada
- Languages at home
- 71% English-only · Spanish 28%
Political lean MEDSL · Montgomery
- 2024 margin
- Solid R (+45.5) · D 26.8% · R 72.3%
- 2008→2024 swing
- +7.2pp toward D · 2008: -52.7pp · 2024: -45.5pp
- All cycles
- 2024: R+45.5 2020: R+43.8 2016: R+51.4 2012: R+60.7 2008: R+52.7
Not yet ingested
- Civics
- —
Market trends
- HPI YoY
- ▼ -6.47%
- Current HPI
- 306.9962
- Rent YoY
- —
- Metro
- Houston-The Woodlands-Sugar Land, TX
- State GDP YoY
- ▲ 3.95%
- F500 in state
- 110
Industry mix (Fortune 500 HQ in TX)
| Industry | F500 HQs | Revenue |
|---|---|---|
| Energy | 16 | $1,198B |
|
||
| Technology | 5 | $198B |
|
||
| Engineering / Construction | 4 | $72B |
|
||
| Energy Services | 3 | $60B |
|
||
| Utilities | 3 | $41B |
|
||
| Healthcare | 2 | $330B |
|
||
Price history
-8.2% since first listed16 events — show timeline
- 2026-04-05 Contingent — HARMLS
- 2026-03-23 Price Changed $233,990 HARMLS
- 2026-03-16 Price Changed $234,990 HARMLS
- 2026-03-10 Price Changed $237,990 HARMLS
- 2026-01-09 Relisted — HARMLS
- 2026-01-09 Price Changed $238,880 HARMLS
- 2025-11-01 Contingent — HARMLS
- 2025-10-30 Price Changed $232,990 HARMLS
- 2025-10-30 Relisted — HARMLS
- 2025-08-05 Contingent — HARMLS
- 2025-07-22 Price Changed $238,990 HARMLS
- 2025-07-18 Price Changed $240,990 HARMLS
- 2025-07-04 Price Changed $242,990 HARMLS
- 2025-06-24 Price Changed $244,990 HARMLS
- 2025-06-05 Price Changed $249,990 HARMLS
- 2025-05-23 Listed $254,990 HARMLS
Cash-flow waterfall
monthlySold comps — $/sqft
last 12 mo · ≤1 miLoading sold comps…