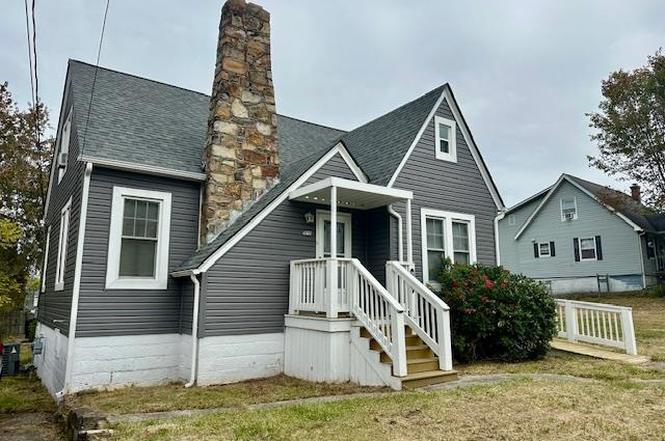
225 Fairview Ave · Beckley, WV
Flood risk 1/10 · Minimal
- FEMA flood zone
- X (unshaded)
- Chance of flooding over 30 yrs
- 0.0%
- Est. flood insurance / yr
- $473 – $860
Fire risk 2/10 · Minimal
- Est. fire insurance / yr
- $787 – $1,461
Heat risk 2/10 · Minimal
- Hot days now (above 91°F)
- 7 days/yr
- Hot days in 30 yrs
- 20 days/yr
Wind risk 1/10 · Minimal
- Chance of severe wind over 30 yrs
- —
Air-quality risk 1/10 · Minimal
- Unhealthy air days now
- 0 days/yr
- Unhealthy air days in 30 yrs
- 0 days/yr
Risk factors via First Street. Map © Google.
Why this score? — see what drove the D- grade
The composite is a weighted blend of 9 inputs, each scored 0–100. Each bar is that input's sub-score; the figure is the points it added to the 100-point composite (weight × sub-score).
- Cash flow +16.4/30.0
- DSCR +5.1/10.0
- Rent growth +3.6/5.0
- 1% rule +3.3/10.0
- Schools +3.0/10.0
- Livability +3.0/5.0
- Condition / age +2.5/5.0
- ARV discount +0.0/15.0
- Appreciation +0.0/10.0
$159,900
🖨 Deal sheet (PDF) 📄 Offer letter ✓ Due diligence
Listing remarks
This inviting 3 bedroom 2 bath home is full of charm and character! The property includes an additional vacant lot that conveys with the sale -perfect for expansion or extra outdoor space. Enjoy the covered the deck, ideal for relaxing or entertaining, and the convenience of a wheelchair accessible ramp. Inside, you'll find spacious bedrooms and a full unfinished basement offering ample storage or room to customize. Located just minutes from shopping, restaurants, & the hospital, this charming home combines comfort, accessibility, and a fantastic location.
Key facts
- Covered deck
- 0.3 acre lot
- Built 1936
Tags
Property features AI
Exterior
- Parking: Open parking; No garage; Asphalt parking surface
- Utilities: Public water; Public sewer
- Home design: Residential property
- Construction: Stone and vinyl siding exterior; Asphalt roof
- Exterior features: Covered rear porch; Porch; Level, landscaped lot; Has a view
Interior
- Kitchen: Dishwasher; Cooktop; Microwave; Refrigerator; Electric water heater
- Bedrooms: 5 total rooms (includes bedrooms and living spaces)
- Flooring: Carpet; Tile; Laminate
- Bathrooms: 2 full bathrooms
- Heating & cooling: Natural gas heating; Heat pump; Central air; Window unit(s); Ceiling fans
- Interior features: Eat-in kitchen; Ceiling fans; Fireplace; Full unfinished basement
- Laundry & utility: Washer hookup in basement
Neighborhood map
What this means for you Summary
Snapshot
- This is a 3-bed/1.0-bath single-family listed at $160k.
Deal economics
- At list price, monthly cash flow is $90 ($1k/yr) — positive.
- The deal already cash-flows at list — no discount required.
- To meet the 1% rule (rent ≥ 1% of price), the offer needs to be $133k (17.1% below list).
- Recommended offer: $133k (17.1% below list) — sets the bar for 1% rule.
Location & tenants
- Location reads 59/100 on livability (#235 in WV) — a working-class tenant base; expect higher turnover. Strengths: cost of living A+, housing A-; Watch: employment D, crime F, amenities F.
- Raleigh County Schools (rural): math 29% / reading 42% proficiency, ranked #14 of 55 in WV (top 26%) — families likely to look elsewhere, expect single-tenant / working-renter base with shorter leases.
- Zoned schools: Crescent Elementary (math 57% / reading 42%, grade D, #49 of 377 statewide, top 16%, 323 students, 0% FRL); Park Middle School (math 40% / reading 49%, grade D, #10 of 109 statewide, top 8%, 394 students, 0% FRL); Woodrow Wilson High School (math 24% / reading 56%, grade F, #20 of 110 statewide, top 17%, 1,330 students, 0% FRL) — zoned schools average 0% FRL vs 46% district-wide (46 pts lower); this property's tenant base skews higher-income than the district average.
- Market conditions: Rents rising fast (+4.2%/yr); 112 active listings in the ZIP; 41 units permitted in Raleigh County in 2024 (0 in 5+ unit buildings).
Forward outlook
- Local home prices are declining (-3.0%/yr); year-one equity from $1k of loan paydown is wiped out by about $5k of value loss. Plan a longer hold.
- Raleigh County population projected at -16% by 2050 — secular population decline; favor cash flow + early exit over multi-decade hold.
Negotiation context
- It's been on market 249 days — a 12% lower offer ($141k) is reasonable based on typical stale-listing flexibility.
- 2 sale attempts; this cycle's ask has dropped $20k (11%) from the opening price — seller is motivated, your offer sets the floor, not the list.
Risks & watch-outs
- Watch-outs: built in 1936 — expect roof / HVAC / electrical / plumbing capex.
Questions for the listing agent
- It's been on market 249 days. Have you received any prior offers? Is the seller open to a 17% concession, seller financing, or rate buy-down credit?
- Built in 1936 — when were the roof, HVAC, electrical panel, plumbing, and water heater last replaced?
- Why hasn't it sold? Are there any deal-killer items the seller is aware of (foundation, flood, title, zoning, code violations)?
- Is there a deadline driving the sale (1031 exchange, divorce, estate, relocation)? That informs how much negotiation room exists.
- Schools are D-rated, which usually means shorter tenancies and higher turnover. Who's the typical renter profile here, and what's been the actual vacancy rate?
- Crime grade is F in this area — have there been break-ins, vandalism, or insurance claims at this property in the last 3 years? What carrier currently insures it and at what premium?
- The area grade is low — what's the realistic commute time and amenity access for the typical tenant pool here? Any planned neighborhood developments (good or bad) we should know about?
- What's the average days-on-market for RENTAL listings here right now (not sales)? A rising rental-DOM trend means longer vacancies and softer asking-rent achievability than the comps imply.
- What's the recent tenant-quality profile in this submarket — average credit score on applications, eviction rate, late-payment / NSF rate, and stable-employment percentage? A property-management company in the area should have these aggregated.
- How much new for-sale + rental construction is in the pipeline within 1–3 miles? Heavy new supply typically softens prices + rents 12–24 months out; constrained supply supports both.
Investment metrics
- 1% rule
- 0.83% ✗
- Cap rate
- 6.97%
- Cash-on-cash
- 2.42%
- DSCR
- 1.11
- GRM
- 10.1
CMA / ARV
- ARV (on-the-fly)
- $130,725
- Comps found
- 12
Show comp detail 12 sales within ~0.75 mi
| Address | Dist | Beds/Ba | Sqft | Sold | Price | $/sf | Match |
|---|---|---|---|---|---|---|---|
| 118 Dexter Ave | 0.07mi | 3/1.0 | 1,484 (-6%) | 8mo | $165,000 | $111 | 80 |
| 1519 Harper Rd | 0.20mi | 3/1.5 | 1,536 (-2%) | 8mo | $73,000 | $48 | 78 |
| 223 West Locust Dr | 0.07mi | 3/2.0 | 1,710 (+9%) | 6mo | $127,200 | $74 | 73 |
| 216 Fairview Ave | 0.04mi | 4/2.0 (+1) | 1,509 (-4%) | 19mo | $165,000 | $109 | 66 |
| 233 Fairview Ave | 0.04mi | 3/3.0 | 1,360 (-14%) | 3mo | $58,000 | $43 | 65 |
| 207 Chestnut St | 0.67mi | 3/1.0 | 1,608 (+2%) | 8mo | $50,000 | $31 | 58 |
| 108 West Locust Dr | 0.11mi | 4/1.5 (+1) | 1,793 (+14%) | 9mo | $163,000 | $91 | 57 |
| 210 Fairview Ave | 0.07mi | 2/2.0 (-1) | 1,368 (-13%) | 17mo | $130,000 | $95 | 51 |
| 323 Ellison Ave | 0.60mi | 3/1.5 | 1,501 (-5%) | 20mo | $125,000 | $83 | 46 |
| 301 Reservoir Rd | 0.61mi | 3/2.0 | 1,417 (-10%) | 12mo | $156,000 | $110 | 40 |
| 411 Ewart Ave | 0.49mi | 3/2.0 | 1,800 (+14%) | 12mo | $142,000 | $79 | 39 |
| 115 Adkins St | 0.66mi | 4/1.0 (+1) | 1,453 (-8%) | 17mo | $14,000 | $10 | 38 |
Match score weights: distance 35% · size 25% · config 20% · recency 20%. Top-matched comps best support the ARV.
Projected returns pro-forma
-3.0% appreciation · 4.25% rent growth · sell at horizon
- IRR
- -11.3%
- Equity multiple
- 0.59×
- Total profit
- $-18,537
- Equity at exit
- $23,842
- IRR
- -0.6%
- Equity multiple
- 0.96×
- Total profit
- $-1,911
- Equity at exit
- $13,825
Cash invested: $44,772 (down + closing). Projections, not guarantees.
Landlord ↔ Tenant lean methodology
- Overall (STATE)
- 83 Strongly Landlord-Friendly
- State West Virginia
- 83 Strongly Landlord-Friendly · R+22
- County
- — inherits STATE
- City
- — inherits STATE
ZIP-level market 25801
- Home prices YoY
- -17.8%
- Rents YoY
- 4.2%
- Active inventory
- 112
- Price-to-rent
- 10.1×
Monthly cashflow live
- Estimated rent
- $1,326 medium interval (Pro) →
- Mortgage (P&I)
- −$839
- Tax from tax record
- −$52 /mo · $621/yr
- Insurance
- −$67
- HOA
- −$0
- Vacancy / Maint / Mgmt
- −$278
- Net cashflow
- $90
Break-even live
Sensitivity live
| Price | -10% $181 | -5% $136 | +0% $90 | +5% $45 | +10% $0 |
|---|---|---|---|---|---|
| Rent | -10% $-14 | -5% $38 | +0% $90 | +5% $143 | +10% $195 |
| Rate | -1.0pp $171 | -0.5pp $131 | base $90 | +0.5pp $49 | +1.0pp $7 |
UW: 25.0% down · 7.5% · 30yr · 1.5% tax · 5.0% vac · 8.0% maint · 8.0% mgmt
Financing live
Cash to close
- Down payment
- $39,975
- Closing costs
- $4,797
- Reserves months
- —
- Total cash needed
- —
Loan-product check · same deal, 3 products live
Conventional
25% down · 7.5% · 30yr
- Down + closing
- —
- Monthly P&I
- —
- Monthly cashflow
- —
- DSCR
- —
- Eligible?
- —
Personal DTI + credit; lowest rate.
DSCR
20% down · 8.5% · 30yr
- Down + closing
- —
- Monthly P&I
- —
- Monthly cashflow
- —
- DSCR
- —
- Eligible?
- —
No personal income docs; deal must DSCR.
Hard money
10% down · 12.0% · 12mo
- Down + closing
- —
- Monthly P&I
- —
- Monthly cashflow
- —
- DSCR
- —
- Eligible?
- —
Short-term bridge; refi at stabilization.
Listing history 21 events
-
2026-06-19days on market $159,900 Active 249 DOM
-
2026-06-18days on market $159,900 Active 248 DOM
-
2026-06-17days on market $159,900 Active 247 DOM
-
2026-06-16days on market $159,900 Active 246 DOM
-
2026-06-15days on market $159,900 Active 245 DOM
-
2026-06-14days on market $159,900 Active 243 DOM
-
2026-06-12days on market $159,900 Active 242 DOM
-
2026-06-09days on market $159,900 Active 239 DOM
-
2026-06-08days on market $159,900 Active 238 DOM
-
2026-06-07days on market $159,900 Active 237 DOM
-
2026-06-03days on market $159,900 Active 233 DOM
-
2026-06-02days on market $159,900 Active 232 DOM
-
2026-06-01days on market $159,900 Active 231 DOM
-
2026-05-31days on market $159,900 Active 230 DOM
-
2026-05-30days on market $159,900 Active 229 DOM
-
2026-04-18status Active
-
2026-04-18price $159,900
-
2026-03-26historical Active Under Contract
-
2026-02-16price $169,000
-
2026-01-02price $175,000
-
2025-10-13$180,000 Active
ⓘ Source: listings_history table (triggers on properties + properties_extension) + one-shot
backfill from property_details.listing_events for pre-trigger history.
Tax reassessment forecast WV · Resets to sale price
- Current annual tax
- $621 · $52/mo
- Projected year-2 tax
- $943 · $79/mo
- Expected delta
- +$322/yr (+$27/mo · 51.9%)
ⓘ Screening estimate from a state-policy table — verify with the county assessor before closing.
Climate risk First Street
- Flood 1/10 Low FEMA zone X (unshaded) · 0% chance over 30 yrs
- Wildfire 2/10 Low
- Heat 2/10 Low 7 d/yr ≥91°F today · 20 d/yr by 30 yrs out
- Wind 1/10 Low
- Air quality 1/10 Low 0 unhealthy d/yr today · 0 by 30 yrs out
Nearby sold comps map
Loading sold comps map…
Walkable amenities ~0.75 mi
Loading nearby amenities…
Taxation est. · year 1
- Rental income
- $15,909
- − Mortgage interest
- −$8,957
- − Property taxes
- −$621
- − Insurance
- −$800
- − Repairs & maintenance
- −$1,273
- − Management
- −$1,273
- − Depreciation
- −$4,652
- Taxable loss
- −$1,666
- Est. tax savings @ 24.0%
- +$400
- After-tax cash flow
- $1,485/yr
For passive investors: Depreciation is non-cash, so a rental often shows a tax loss while cash-flowing — sheltering income. Rental losses are passive: they offset passive income freely, and up to $25,000/yr can offset ordinary (W-2) income if you actively participate and your MAGI is under $100k (phasing out to $0 by $150k); unused losses carry forward. On sale, claimed depreciation is recaptured at up to 25%, and gains may owe capital-gains tax (a 1031 exchange can defer both). Figures are a year-1 estimate at your 24.0% rate — not tax advice; consult a CPA.
Schools (NCES district)
- District
- Raleigh County Schools
- NCES district ID
- 5401230
- Math proficiency
- 29% ▼ -8.00%
- Reading proficiency
- 42% ▼ -3.00%
- Median HH income
- $39,828
- Composite
- 29.74/100
- National rank
- #6445
- State rank
- #14 of 55 in WV
Livability — Beckley
- Score
- 59/100
- State rank
- #235
- US rank
- #20551
Category grades
Schools grade is shown separately in the Schools card above.
Census & demographics
- Census place
- Beckley, WV
- County
- Raleigh County · 31,128 people
- City population
- 31,128
- Metro
- Beckley, WV
- Population (ZIP)
- 31,128
- Household income
- $56,836
- Rent vs Own
- Severe rent burden
- 1384.0
Population outlook (Raleigh County) Hauer SSP2
- Today (2025)
- 73,505 people
- By 2030
- 70,954 · -3.5%
- By 2040
- 66,038 · -10.2%
- By 2050
- 61,919 · -15.8%
- By 2075
- 51,954 · -29.3%
- By 2100
- 39,724 · -46.0%
Race, ethnicity, and origin ACS 2023
- Neighborhood character
- Predominantly White (81%)
- Race & ethnicity
- White 81% Black 10% Two or more races 7% Hispanic / Latino 2% Asian 2%
- Common ancestry
- Slovak 2% Italian 1% Lithuanian 1%
- Foreign-born
- 2% · Canada
- Languages at home
- 96% English-only · Spanish 2% Other Indo-European 1%
Political lean MEDSL · Raleigh
- 2024 margin
- Solid R (+54.3) · D 22.0% · R 76.3% · Other 1.6%
- 2008→2024 swing
- -28.5pp toward R · 2008: -25.9pp · 2024: -54.3pp
- All cycles
- 2024: R+54.3 2020: R+50.4 2016: R+52.8 2012: R+44.6 2008: R+25.9
Not yet ingested
- Civics
- —
Market trends
- HPI YoY
- ▼ -45.60%
- Current HPI
- 210.0114
- Rent YoY
- ▲ 4.25%
- Metro
- Beckley, WV
- State GDP YoY
- —
- F500 in state
- 0
Price history
-11.2% since first listed6 events — show timeline
- 2026-04-18 Relisted — BBOR
- 2026-04-18 Price Changed $159,900 BBOR
- 2026-03-26 Contingent — BBOR
- 2026-02-16 Price Changed $169,000 BBOR
- 2026-01-02 Price Changed $175,000 BBOR
- 2025-10-13 Listed $180,000 BBOR
Property tax history
-2.8%/yrLatest (2025): $621 · +8.4% YoY. Source: county tax records.
Cash-flow waterfall
monthlySold comps — $/sqft
last 12 mo · ≤1 miLoading sold comps…