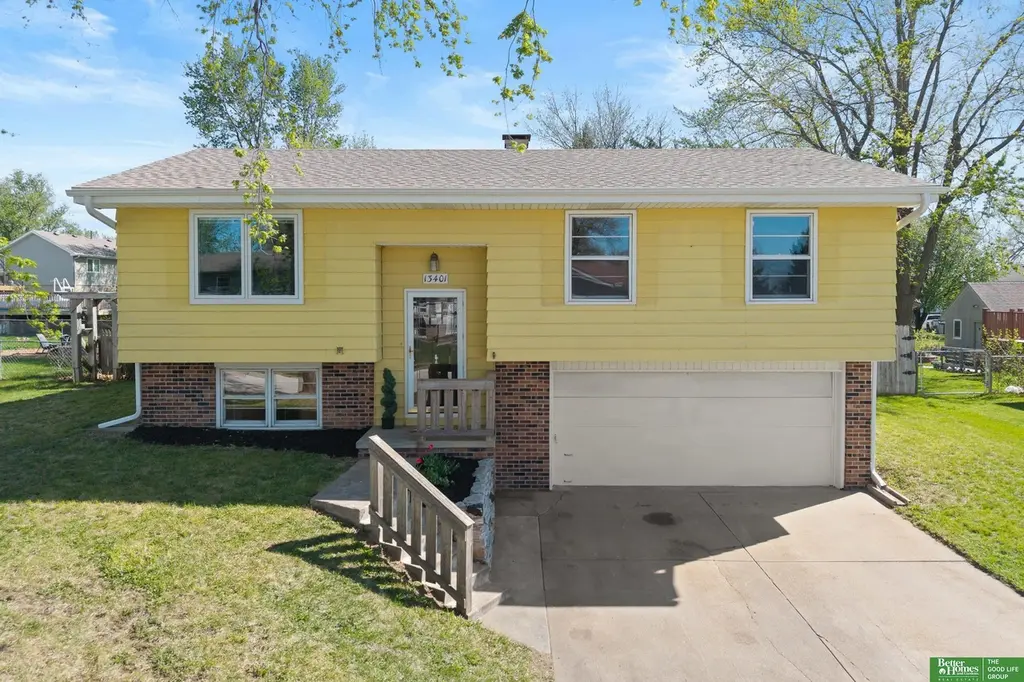
13401 Glenn St · Papillion, NE
Flood risk 1/10 · Minimal
- FEMA flood zone
- X (unshaded)
- Chance of flooding over 30 yrs
- 0.0%
- Est. flood insurance / yr
- $473 – $860
Fire risk 1/10 · Minimal
- Est. fire insurance / yr
- $1,161 – $2,155
Heat risk 3/10 · Minor
- Hot days now (above 103°F)
- 7 days/yr
- Hot days in 30 yrs
- 16 days/yr
Wind risk 2/10 · Minimal
- Chance of severe wind over 30 yrs
- —
Air-quality risk 1/10 · Minimal
- Unhealthy air days now
- 0 days/yr
- Unhealthy air days in 30 yrs
- 0 days/yr
Risk factors via First Street. Map © Google.
Why this score? — see what drove the C- grade
The composite is a weighted blend of 9 inputs, each scored 0–100. Each bar is that input's sub-score; the figure is the points it added to the 100-point composite (weight × sub-score).
- Cash flow +16.5/30.0
- ARV discount +11.9/15.0
- Schools +5.2/10.0
- DSCR +5.1/10.0
- 1% rule +4.2/10.0
- Livability +4.2/5.0
- Rent growth +3.4/5.0
- Condition / age +2.5/5.0
- Appreciation +0.0/10.0
$240,000
🖨 Deal sheet 📄 Offer letter ✓ Due diligence
Listing remarks MLS
3 bedroom 2 bath 2 car garage finished basement
Key facts
- Fenced yard
- Laundry room
- Flex space
Tags
Property features AI
Exterior
- Parking: Attached 2-car garage; 2 covered parking spaces
- Utilities: Public water; Public sewer
- Home design: Split entry home; Single-family residence; Living area approx. 1,452 sq ft; Above-grade finished area approx. 1,056 sq ft; Below-grade finished area approx. 396 sq ft; Built in 1966
- Construction: Block foundation
- Exterior features: Deck; Chain link fencing; Lot approximately 0.27 acres (dimensions approx. 71 x 155.7 x 76.1 x 167)
Interior
- Kitchen: Kitchen on the main floor (approx. 10' x 11')
- Bedrooms: Master bedroom on main floor (approx. 12.5' x 11.5'); Bedroom 2 on main floor (approx. 12' x 9'); Bedroom 3 on main floor (approx. 10' x 9')
- Bathrooms: One full bathroom on the main level; One quarter bathroom
- Heating & cooling: Natural gas heating; Forced air; Central air conditioning
- Interior features: Partially finished basement; No fireplaces
Neighborhood map
What this means for you Summary
Snapshot
- This is a 3-bed/1.0-bath single-family listed at $240k.
Deal economics
- At list price, monthly cash flow is $140 ($2k/yr) — positive.
- The deal already cash-flows at list — no discount required.
- To meet the 1% rule (rent ≥ 1% of price), the offer needs to be $221k (7.9% below list).
- Recommended offer: $221k (7.9% below list) — sets the bar for 1% rule.
- Cap rate 7.0% vs local median 2.6% in Papillion — top-decile yield for the area; either an underpriced asset or a hidden risk that comps aren't pricing in. Stress-test before assuming the spread holds.
Location & tenants
- Location reads 85/100 on livability (#4 in NE, #482 nationally) — a professional / high-income tenant draw. Strengths: crime A+, employment A+, housing A+; Watch: amenities D-, commute F.
- Springfield Platteview Community Schools (rural): math 56% / reading 60% proficiency, ranked #18 of 111 in NE (top 16%) — acceptable for families but not a draw, mixed tenant base, ~2y average lease; only 12% free/reduced lunch — higher-income household profile.
- Zoned schools: Westmont Elementary School (math 57% / reading 57%, grade C+, #136 of 502 statewide, top 31%, 271 students, 22% FRL); Platteview Central Jr High School (math 52% / reading 57%, grade B-, #32 of 128 statewide, top 28%, 181 students, 22% FRL); Platteview Senior High School (math 52% / reading 57%, grade C-, #80 of 261 statewide, top 37%, 388 students, 17% FRL).
- Market conditions: Rents rising (+3.7%/yr); 71 active listings in the ZIP; 3 comparable units currently listed for rent nearby; rentals leasing fast (median 3d on market — plan ~1-2 weeks tenant-placement turnaround); solid renter incomes; 1,612 units permitted in Sarpy County in 2024 (364 in 5+ unit buildings).
- This rent runs 31% of the median local income ($86k/yr) — at the standard rent-burdened threshold; future hikes will face affordability resistance.
Forward outlook
- Local home prices are declining (-3.0%/yr); year-one equity from $2k of loan paydown is wiped out by about $7k of value loss. Plan a longer hold.
- Sarpy County population projected at +41% by 2050 — long-run rental-demand tailwind backs the buy-and-hold thesis.
Negotiation context
- Only 7 days on market — expect competitive offers; lowballing is unlikely to land.
- 4 sale attempts since 21y ago with the ask held roughly flat each time — persistent listings suggest the price (not the market) is what's stuck; bring a comps-based counter.
- Current owner paid $175k; 37% above their basis — modest negotiation headroom, anchor on the comps not their cost.
Questions for the listing agent
- Built in 1966 — when were the roof, HVAC, electrical panel, plumbing, and water heater last replaced?
- Is there a deadline driving the sale (1031 exchange, divorce, estate, relocation)? That informs how much negotiation room exists.
- Schools are A-rated — typically a magnet for longer-tenancy family renters. What's the average tenant stay here, and is there a school-zone premium baked into asking?
- What's the average days-on-market for RENTAL listings here right now (not sales)? A rising rental-DOM trend means longer vacancies and softer asking-rent achievability than the comps imply.
- What's the recent tenant-quality profile in this submarket — average credit score on applications, eviction rate, late-payment / NSF rate, and stable-employment percentage? A property-management company in the area should have these aggregated.
- How much new for-sale + rental construction is in the pipeline within 1–3 miles? Heavy new supply typically softens prices + rents 12–24 months out; constrained supply supports both.
Investment metrics
- 1% rule
- 0.92% ✗
- Cap rate
- 6.99%
- Cash-on-cash
- 2.51%
- DSCR
- 1.11
- GRM
- 9.1
CMA / ARV
- ARV (on-the-fly)
- $265,716
- Comps found
- 11
Show comp detail 11 sales within ~0.75 mi
| Address | Dist | Beds/Ba | Sqft | Sold | Price | $/sf | Match |
|---|---|---|---|---|---|---|---|
| 13401 Glenn St | 0.00mi | 3/1.5 | 1,452 (0%) | 1mo | $245,000 | $169 | 97 |
| 13307 Glenn St | 0.02mi | 3/2.0 | 1,476 (+2%) | 8mo | $270,000 | $183 | 86 |
| 13414 Shepard St | 0.16mi | 3/1.5 | 1,488 (+2%) | 13mo | $297,500 | $200 | 75 |
| 13521 Carpenter St | 0.17mi | 3/1.5 | 1,577 (+9%) | 2mo | $294,000 | $186 | 74 |
| 13503 Glenn St | 0.09mi | 3/2.0 | 1,603 (+10%) | 4mo | $272,000 | $170 | 71 |
| 13310 Grissom St | 0.08mi | 4/2.0 (+1) | 1,382 (-5%) | 23mo | $260,000 | $188 | 60 |
| 13604 Carpenter St | 0.18mi | 4/2.0 (+1) | 1,490 (+3%) | 24mo | $275,000 | $185 | 58 |
| 13202 Slayton St | 0.28mi | 3/2.0 | 1,269 (-13%) | 7mo | $270,000 | $213 | 56 |
| 13402 Slayton St | 0.23mi | 4/2.0 (+1) | 1,516 (+4%) | 24mo | $277,000 | $183 | 53 |
| 13515 Shepard St | 0.20mi | 3/3.0 | 1,658 (+14%) | 10mo | $295,000 | $178 | 51 |
| 13207 Cooper St | 0.25mi | 3/3.0 | 1,644 (+13%) | 24mo | $295,000 | $179 | 38 |
Match score weights: distance 35% · size 25% · config 20% · recency 20%. Top-matched comps best support the ARV.
Projected returns pro-forma
-3.0% appreciation · 3.73% rent growth · sell at horizon
- IRR
- -11.5%
- Equity multiple
- 0.58×
- Total profit
- $-28,316
- Equity at exit
- $35,785
- IRR
- -1.3%
- Equity multiple
- 0.91×
- Total profit
- $-6,337
- Equity at exit
- $20,751
Cash invested: $67,200 (down + closing). Projections, not guarantees.
Landlord ↔ Tenant lean methodology
- Overall (STATE)
- 83 Strongly Landlord-Friendly
- State Nebraska
- 83 Strongly Landlord-Friendly · R+13
- County
- — inherits STATE
- City
- — inherits STATE
ZIP-level market 68138
- Home prices YoY
- -19.6%
- Rents YoY
- 3.7%
- Active inventory
- 71
- Price-to-rent
- 9.1×
Monthly cashflow live
- Estimated rent
- $2,209 medium interval (Pro) →
- Mortgage (P&I)
- −$1,259
- Tax from tax record
- −$247 /mo · $2,959/yr
- Insurance
- −$100
- HOA
- −$0
- Vacancy / Maint / Mgmt
- −$464
- Net cashflow
- $140
Break-even live
UW: 25.0% down · 7.5% · 30yr · 1.5% tax · 5.0% vac · 8.0% maint · 8.0% mgmt
Financing live
Cash to close
- Down payment
- $60,000
- Closing costs
- $7,200
- Reserves months
- —
- Total cash needed
- —
Loan-product check · same deal, 3 products live
Conventional
25% down · 7.5% · 30yr
- Down + closing
- —
- Monthly P&I
- —
- Monthly cashflow
- —
- DSCR
- —
- Eligible?
- —
Personal DTI + credit; lowest rate.
DSCR
20% down · 8.5% · 30yr
- Down + closing
- —
- Monthly P&I
- —
- Monthly cashflow
- —
- DSCR
- —
- Eligible?
- —
No personal income docs; deal must DSCR.
Hard money
10% down · 12.0% · 12mo
- Down + closing
- —
- Monthly P&I
- —
- Monthly cashflow
- —
- DSCR
- —
- Eligible?
- —
Short-term bridge; refi at stabilization.
Rent comps 3 comps
| Address | Beds | Baths | Sqft | Rent | $/sqft | DOM | Units | Dist |
|---|---|---|---|---|---|---|---|---|
| 13178 Lincoln Rd Omaha, NE | 2.0–4.0 | 2.0–3.5 | 1770 | $2,245 | $1.27 | 2d | 6 | 0.86mi |
| 13108 Lincoln Rd Omaha, NE | 1.0–4.0 | 1.0–3.5 | 1584 | $2,412 | $1.52 | 2d | 11 | 0.87mi |
| 13041 Cornhusker Rd Omaha, NE | 1.0–2.0 | 1.0–2.0 | 1222 | $2,295 | $1.88 | 2d | 13 | 1.24mi |
Listing history 15 events
-
2026-04-30status Pending
-
2026-04-23$240,000 New
-
2026-04-18status Pending
-
2026-04-17historical
-
2026-04-13$240,000 New
-
2020-11-20soldstatus $175,000
-
2020-11-17soldstatus $175,000 Sold 47-char remark
Show marketing remark (47 chars)
3 bedroom 2 bath 2 car garage finished basement
-
2020-09-24status Pending 47-char remark
Show marketing remark (47 chars)
3 bedroom 2 bath 2 car garage finished basement
-
2020-09-21price $185,000 47-char remark
Show marketing remark (47 chars)
3 bedroom 2 bath 2 car garage finished basement
-
2020-09-16price $189,000 47-char remark
Show marketing remark (47 chars)
3 bedroom 2 bath 2 car garage finished basement
-
2020-09-07$199,000 Active - New 47-char remark
Show marketing remark (47 chars)
3 bedroom 2 bath 2 car garage finished basement
-
2005-12-20soldstatus $110,000
-
2005-12-16soldstatus $110,000
-
2005-11-29historical
-
2005-10-12$112,000
ⓘ Source: listings_history table (triggers on properties + properties_extension) + one-shot
backfill from property_details.listing_events for pre-trigger history.
Tax reassessment forecast NE · Resets to sale price
- Current annual tax
- $2,959 · $247/mo
- Projected year-2 tax
- $4,152 · $346/mo
- Expected delta
- +$1,193/yr (+$99/mo · 40.3%)
ⓘ Screening estimate from a state-policy table — verify with the county assessor before closing.
Climate risk First Street
- Flood 1/10 Low FEMA zone X (unshaded) · 0% chance over 30 yrs
- Wildfire 1/10 Low
- Heat 3/10 Moderate 7 d/yr ≥103°F today · 16 d/yr by 30 yrs out
- Wind 2/10 Low
- Air quality 1/10 Low 0 unhealthy d/yr today · 0 by 30 yrs out
Nearby sold comps map
Loading sold comps map…
Walkable amenities ~0.75 mi
Loading nearby amenities…
Taxation est. · year 1
- Rental income
- $26,514
- − Mortgage interest
- −$13,444
- − Property taxes
- −$2,959
- − Insurance
- −$1,200
- − Repairs & maintenance
- −$2,121
- − Management
- −$2,121
- − Depreciation
- −$6,982
- Taxable loss
- −$2,313
- Est. tax savings @ 24.0%
- +$555
- After-tax cash flow
- $2,239/yr
For passive investors: Depreciation is non-cash, so a rental often shows a tax loss while cash-flowing — sheltering income. Rental losses are passive: they offset passive income freely, and up to $25,000/yr can offset ordinary (W-2) income if you actively participate and your MAGI is under $100k (phasing out to $0 by $150k); unused losses carry forward. On sale, claimed depreciation is recaptured at up to 25%, and gains may owe capital-gains tax (a 1031 exchange can defer both). Figures are a year-1 estimate at your 24.0% rate — not tax advice; consult a CPA.
Schools (NCES district)
- District
- Springfield Platteview Community Schools
- NCES district ID
- 3175630
- Math proficiency
- 56% ▼ -13.00%
- Reading proficiency
- 60% ▼ -5.00%
- Median HH income
- $75,382
- Composite
- 51.83/100
- National rank
- #1667
- State rank
- #18 of 111 in NE
Livability — Papillion
- Score
- 85/100
- State rank
- #4
- US rank
- #482
Category grades
Schools grade is shown separately in the Schools card above.
Census & demographics
- County
- Sarpy County · 161,202 people
- City population
- 35,085
- Metro
- Omaha-Council Bluffs, NE-IA
- Population (ZIP)
- 11,713
- Household income
- $86,007
- Rent vs Own
- Severe rent burden
- 303.0
Population outlook (Sarpy County) Hauer SSP2
- Today (2025)
- 211,769 people
- By 2030
- 229,365 · +8.3%
- By 2040
- 264,122 · +24.7%
- By 2050
- 298,087 · +40.8%
- By 2075
- 381,667 · +80.2%
- By 2100
- 448,180 · +111.6%
Race, ethnicity, and origin ACS 2023
- Neighborhood character
- Predominantly White (84%)
- Race & ethnicity
- White 84% Hispanic / Latino 9% Two or more races 7% Asian 2%
- Hispanic origin (detail)
- Mexican 6% Cuban 1%
- Common ancestry
- Romanian 5% Italian 5% Lithuanian 3%
- Foreign-born
- 3% · Canada
- Languages at home
- 97% English-only · Spanish 1% Other Indo-European 1%
Political lean MEDSL · Sarpy
- 2024 margin
- R (+11.7) · D 43.5% · R 55.2% · Other 1.3%
- 2008→2024 swing
- +4.2pp toward D · 2008: -15.9pp · 2024: -11.7pp
- All cycles
- 2024: R+11.7 2020: R+11.2 2016: R+21.8 2012: R+23.6 2008: R+15.9
Not yet ingested
- Civics
- —
Market trends
- HPI YoY
- ▼ -61.11%
- Current HPI
- 250.0183
- Rent YoY
- ▲ 3.73%
- Metro
- Omaha-Council Bluffs, NE-IA
- State GDP YoY
- ▲ 0.68%
- F500 in state
- 2
Industry mix (Fortune 500 HQ in NE)
| Industry | F500 HQs | Revenue |
|---|---|---|
| Conglomerate | 1 | $371B |
|
||
Price history
+114.3% since first listed15 events — show timeline
- 2026-04-30 Pending — GPRMLS
- 2026-04-23 Listed $240,000 GPRMLS
- 2026-04-18 Pending — GPRMLS
- 2026-04-17 Listing Removed — GPRMLS
- 2026-04-13 Listed $240,000 GPRMLS
- 2020-11-20 Sold (Public Records) $175,000 Public Records
- 2020-11-17 Sold (MLS) $175,000 GPRMLS
- 2020-09-24 Pending — GPRMLS
- 2020-09-21 Price Changed $185,000 GPRMLS
- 2020-09-16 Price Changed $189,000 GPRMLS
- 2020-09-07 Listed $199,000 GPRMLS
- 2005-12-20 Sold (Public Records) $110,000 Public Records
- 2005-12-16 Sold (MLS) $110,000 GPRMLS
- 2005-11-29 Listing Removed — GPRMLS
- 2005-10-12 Listed $112,000 GPRMLS
Property tax history
+3.1%/yrLatest (2025): $2,959 · +6.2% YoY. Source: county tax records.
Cash-flow waterfall
monthlySold comps — $/sqft
last 12 mo · ≤1 miLoading sold comps…