 Duplex
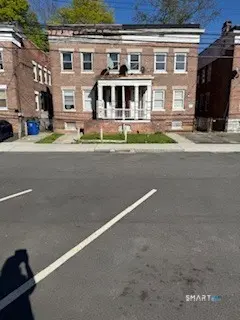
270-Bond Bond St · Bridgeport, CT
Flood risk 1/10 · Minimal
- FEMA flood zone
- X (unshaded)
- Chance of flooding over 30 yrs
- 0.0%
- Est. flood insurance / yr
- $473 – $860
Fire risk 1/10 · Minimal
- Est. fire insurance / yr
- $829 – $1,539
Heat risk 6/10 · Moderate
- Hot days now (above 97°F)
- 7 days/yr
- Hot days in 30 yrs
- 15 days/yr
Wind risk 6/10 · Moderate
- Chance of severe wind over 30 yrs
- 54.0%
Air-quality risk 4/10 · Minor
- Unhealthy air days now
- 5 days/yr
- Unhealthy air days in 30 yrs
- 7 days/yr
Risk factors via First Street. Map © Google.
Why this score? — see what drove the C+ grade
The composite is a weighted blend of 9 inputs, each scored 0–100. Each bar is that input's sub-score; the figure is the points it added to the 100-point composite (weight × sub-score).
- Cash flow +25.3/30.0
- ARV discount +11.8/15.0
- DSCR +8.3/10.0
- 1% rule +6.5/10.0
- Livability +4.0/5.0
- Rent growth +2.5/5.0
- Condition / age +2.5/5.0
- Schools +1.2/10.0
- Appreciation +0.0/10.0
$349,900
🖨 Deal sheet 📄 Offer letter ✓ Due diligence
Multi-family units
County records classify this as Multi-Family (2-4 Unit). Listing-text estimate: 2 units. confirmed
Listing remarks MLS
Brick Attached two family property that needs work. First Floor, repairs were started but not completed. Needs complete rehab. Most of the first floor unit has newer Sheetrock, and sub unit needs new kitchen and bath. Second Floor is in decent condition. will not Qualify for FHA or Traditional Fanancing, 203K and Cash Buyers preferred.
Key facts
- 2,613 sq ft lot
- Built 1910
- Listed 2 days
Property features AI
Exterior
- Utilities: Public water connected; Public sewer connected
- Home design: Multi-family (2-family); Flat roof
- Construction: Concrete and masonry foundation; Brick construction; Brick color/finish
- Exterior features: City views; Brick exterior
Interior
- Bedrooms: 4 bedrooms
- Bathrooms: 2 full bathrooms
- Heating & cooling: Hot air heating; Natural gas fuel; Domestic hot water
- Interior features: Full unfinished basement; 8 total rooms
Neighborhood map
What this means for you Summary
Snapshot
- This is a 2 × 2-bed/1.0-bath units multifamily listed at $350k.
Deal economics
- At list price, monthly cash flow is $797 ($10k/yr) — positive. Per door: $398/mo.
- The deal already cash-flows at list — no discount required.
- Meets the 1% rule at list price ($4k rent vs $350k).
- Cap rate 9.0% vs local median 5.0% in Bridgeport — top-decile yield for the area; either an underpriced asset or a hidden risk that comps aren't pricing in. Stress-test before assuming the spread holds.
Location & tenants
- Location reads 81/100 on livability (#15 in CT, #1,374 nationally) — a professional / high-income tenant draw. Strengths: amenities A+, commute A+, health & safety A+; Watch: crime C-, employment D+, schools D-.
- Bridgeport School District (urban): math 9% / reading 19% proficiency, ranked #151 of 153 in CT (top 99%) — low school quality limits family demand, transient renter base, plan for 1-2y turnover; 97% free/reduced lunch — lower-income household profile, screen leases tightly.
- Market conditions: 68 active listings in the ZIP; 40 comparable units currently listed for rent nearby; rentals at typical pace (median 24d on market — plan ~3-4 weeks tenant-placement turnaround); 42% of comp listings sitting > 30 days — soft ceiling on asking rent; 852 units permitted in Greater Bridgeport Planning Region in 2024 (698 in 5+ unit buildings).
- At $4,026/mo this rent would consume 94% of the median local household income ($52k/yr) (locally 1368% of renters already pay >50% of income on rent) — very limited rent-growth headroom before tenants either downsize or default.
Forward outlook
- Local home prices are declining (-3.0%/yr); year-one equity from $2k of loan paydown is wiped out by about $10k of value loss. Plan a longer hold.
Negotiation context
- Only 2 days on market — expect competitive offers; lowballing is unlikely to land.
- 6 sale attempts since 20y ago with the ask held roughly flat each time — persistent listings suggest the price (not the market) is what's stuck; bring a comps-based counter.
- Current owner paid $43k; list at $350k implies a 720% gain — meaningful room to come down on a strong offer.
Risks & watch-outs
- Watch-outs: built in 1910 — expect roof / HVAC / electrical / plumbing capex.
- Climate carrying-cost: major wind risk, 54% chance of damaging wind over 30y; extreme-heat days projected 7→15/yr by 2055 (HVAC capex compounding) — expect insurance premiums to compound above CPI over the hold.
Questions for the listing agent
- Can we see the unit-by-unit rent roll, current vacancy, and any below-market leases? What's the average tenancy length?
- What capital expenditures (roof, boiler, parking lot, exteriors) have been made in the last 5 years, and what's planned in the next 2?
- Built in 1910 — when were the roof, HVAC, electrical panel, plumbing, and water heater last replaced?
- Is there a deadline driving the sale (1031 exchange, divorce, estate, relocation)? That informs how much negotiation room exists.
- Schools are D-rated, which usually means shorter tenancies and higher turnover. Who's the typical renter profile here, and what's been the actual vacancy rate?
- What's the average days-on-market for RENTAL listings here right now (not sales)? A rising rental-DOM trend means longer vacancies and softer asking-rent achievability than the comps imply.
- What's the recent tenant-quality profile in this submarket — average credit score on applications, eviction rate, late-payment / NSF rate, and stable-employment percentage? A property-management company in the area should have these aggregated.
- How much new apartment / multifamily construction is in the pipeline within 1–3 miles? Heavy new supply (>2% of stock underway) typically softens rents 12–24 months out; light construction supports rent growth.
Investment metrics
- 1% rule
- 1.15% ✓
- Cap rate
- 9.03%
- Cash-on-cash
- 9.76%
- DSCR
- 1.43
- GRM
- 7.2
CMA / ARV
- ARV (median comp)
- $386,625
- List price
- $349,900
- Delta
- -9.50%
- Verdict
- FAIR
- Comps
- 20 within 1.0 mi
Show comp detail 8 sales within ~0.75 mi
| Address | Dist | Beds/Ba | Sqft | Sold | Price | $/sf | Match |
|---|---|---|---|---|---|---|---|
| 276 Bond St | 0.00mi | 4/2.0 | 1,712 (0%) | 10mo | $475,000 | $277 | 92 |
| 310 Bond St | 0.04mi | 4/2.0 | 1,712 (0%) | 8mo | $365,000 | $213 | 91 |
| 184 Pearl Harbor St | 0.40mi | 4/2.0 | 1,700 (-1%) | 2mo | $445,000 | $262 | 79 |
| 323 Pearl Harbor St | 0.42mi | 4/2.5 | 1,700 (-1%) | 7mo | $450,000 | $265 | 71 |
| 989 Pearl Harbor St | 0.67mi | 4/2.0 | 1,700 (-1%) | 11mo | $550,000 | $324 | 58 |
| 54 Asylum St | 0.45mi | 5/3.0 (+1) | 1,792 (+5%) | 12mo | $560,000 | $313 | 52 |
| 96 Manila Pl | 0.65mi | 4/3.0 | 1,812 (+6%) | 8mo | $465,000 | $257 | 49 |
| 83 Berkeley Pl | 0.70mi | 5/2.0 (+1) | 1,617 (-6%) | 5mo | $475,000 | $294 | 49 |
Match score weights: distance 35% · size 25% · config 20% · recency 20%. Top-matched comps best support the ARV.
Projected returns pro-forma
-3.0% appreciation · 3.0% rent growth · sell at horizon
- IRR
- -1.6%
- Equity multiple
- 0.94×
- Total profit
- $-5,903
- Equity at exit
- $52,171
- IRR
- 8.1%
- Equity multiple
- 1.62×
- Total profit
- $60,377
- Equity at exit
- $30,253
Cash invested: $97,972 (down + closing). Projections, not guarantees.
Landlord ↔ Tenant lean methodology
- Overall (STATE)
- 27 Tenant-Leaning
- State Connecticut
- 27 Tenant-Leaning · D+7
- County
- — inherits STATE
- City
- — inherits STATE
ZIP-level market 06610
- Home prices YoY
- -7.5%
- Active inventory
- 68
- Price-to-rent
- 14.5×
Monthly cashflow live
- Estimated rent
- $4,026 high interval (Pro) →
- Mortgage (P&I)
- −$1,835
- Tax from tax record
- −$403 /mo · $4,835/yr
- Insurance
- −$146
- HOA
- −$0
- Vacancy / Maint / Mgmt
- −$845
- Net cashflow
- $797
Break-even live
2-unit breakdown (identical units grouped — click to expand)
| Units | Beds | Baths | Est. rent |
|---|---|---|---|
| 2× units | 2 | 1 | $4,026 |
| #1 | 2 | 1 | $2,013 |
| #2 | 2 | 1 | $2,013 |
| Total (2 units) | $4,026 | ||
UW: 25.0% down · 7.5% · 30yr · 1.5% tax · 5.0% vac · 8.0% maint · 8.0% mgmt
Financing live
Cash to close
- Down payment
- $87,475
- Closing costs
- $10,497
- Reserves months
- —
- Total cash needed
- —
Loan-product check · same deal, 3 products live
Conventional
25% down · 7.5% · 30yr
- Down + closing
- —
- Monthly P&I
- —
- Monthly cashflow
- —
- DSCR
- —
- Eligible?
- —
Personal DTI + credit; lowest rate.
DSCR
20% down · 8.5% · 30yr
- Down + closing
- —
- Monthly P&I
- —
- Monthly cashflow
- —
- DSCR
- —
- Eligible?
- —
No personal income docs; deal must DSCR.
Hard money
10% down · 12.0% · 12mo
- Down + closing
- —
- Monthly P&I
- —
- Monthly cashflow
- —
- DSCR
- —
- Eligible?
- —
Short-term bridge; refi at stabilization.
Rent comps 40 comps
| Address | Beds | Baths | Sqft | Rent | $/sqft | DOM | Units | Dist |
|---|---|---|---|---|---|---|---|---|
| 365 Remington St Bridgeport, CT | 5.0 | 2.0 | 1124 | $3,800 | $3.38 | 44d | 1 | 0.13mi |
| 144 Palisade Ave Bridgeport, CT | 3.0 | 1.0 | 1096 | $2,600 | $2.37 | 44d | 1 | 0.15mi |
| 64 Velvet St Bridgeport, CT | 3.0 | 1.0 | 1430 | $2,500 | $1.75 | 12d | 1 | 0.32mi |
| 335 Ridgefield Ave Bridgeport, CT | 3.0 | 1.0 | 1400 | $2,250 | $1.61 | 3d | 1 | 0.43mi |
| 333 Ridgefield Ave Bridgeport, CT | 3.0 | 1.0 | 1400 | $2,250 | $1.61 | 3d | 1 | 0.43mi |
| 292 Ridgefield Ave Unit 3 Bridgeport, CT | 3.0 | 1.0 | 1792 | $2,450 | $1.37 | 44d | 1 | 0.48mi |
| 292 Ridgefield Ave Unit 2 Bridgeport, CT | 4.0 | 1.0 | 1792 | $2,650 | $1.48 | 44d | 1 | 0.48mi |
| 479 Putnam St Unit 3R Bridgeport, CT | 5.0 | 2.0 | 2000 | $2,350 | $1.18 | 19d | 1 | 0.52mi |
| 75 Judson Pl Bridgeport, CT | 3.0 | 1.5 | 1384 | $2,850 | $2.06 | 14d | 1 | 0.56mi |
| 1325 Pembroke St Unit 2nd Floor Bridgeport, CT | 3.0 | 1.0 | 1600 | $3,500 | $2.19 | 44d | 1 | 0.59mi |
| 672 Brooks St Bridgeport, CT | 4.0 | 1.0 | 1232 | $3,300 | $2.68 | 14d | 1 | 0.59mi |
| 407 East Ave Bridgeport, CT | 5.0 | 1.0 | 1720 | $3,250 | $1.89 | 3d | 1 | 0.62mi |
| 587 Brooks St Unit !st floor Bridgeport, CT | 3.0 | 2.0 | 1500 | $2,400 | $1.60 | 44d | 1 | 0.64mi |
| 530 Jane St Unit 2B Bridgeport, CT | 3.0 | 2.0 | 2217 | $3,400 | $1.53 | 44d | 1 | 0.65mi |
| 53 Pixlee Pl Unit 2nd Bridgeport, CT | 3.0 | 1.0 | 1475 | $2,195 | $1.49 | 3d | 1 | 0.68mi |
| 2048 E Main St Bridgeport, CT | 4.0 | 2.0 | 2000 | $3,000 | $1.50 | 44d | 1 | 0.70mi |
| 704 Maple St #704 Bridgeport, CT | 3.0 | 1.5 | 1948 | $2,700 | $1.39 | 24d | 1 | 0.76mi |
| 285 Clover St Unit 2 Stratford, CT | 3.0 | 1.0 | 1152 | $2,150 | $1.87 | 44d | 1 | 0.78mi |
| 545 Park St Bridgeport, CT | 3.0 | 1.0 | 1176 | $2,050 | $1.74 | 44d | 1 | 0.80mi |
| 438 Park St Unit 1 Bridgeport, CT | 3.0 | 1.0 | 1196 | $2,900 | $2.42 | 3d | 1 | 0.81mi |
| 982 Pembroke St Unit 2L Bridgeport, CT | 4.0 | 1.0 | 2043 | $2,475 | $1.21 | 3d | 1 | 0.82mi |
| 172 Swanson Ave Stratford, CT | 3.0 | 1.5 | 1495 | $3,300 | $2.21 | 3d | 1 | 0.86mi |
| 690 William St Unit 2 Bridgeport, CT | 3.0 | 1.0 | 1746 | $2,200 | $1.26 | 24d | 1 | 0.91mi |
| 80 Huntington Rd Bridgeport, CT | 3.0 | 1.0 | 1100 | $2,300 | $2.09 | 44d | 1 | 0.93mi |
| 279 Harriet St Bridgeport, CT | 3.0 | 1.5 | 1392 | $3,000 | $2.16 | 24d | 1 | 1.11mi |
| 481 Hollister Ave Unit 2nd Bridgeport, CT | 3.0 | 1.0 | 1250 | $2,000 | $1.60 | 24d | 1 | 1.13mi |
| 458 Hollister Ave Unit 2nd Bridgeport, CT | 3.0 | 1.0 | 1100 | $1,899 | $1.73 | 44d | 1 | 1.16mi |
| 166 6th St Bridgeport, CT | 3.0 | 1.0 | 1100 | $2,300 | $2.09 | 19d | 1 | 1.16mi |
| 52-54 Ives Ct Bridgeport, CT | 4.0 | 1.0 | 2092 | $2,750 | $1.31 | 44d | 1 | 1.19mi |
| 588 E Main St Unit C Bridgeport, CT | 3.0 | 1.0 | 1400 | $2,475 | $1.77 | 14d | 1 | 1.20mi |
| 415 Logan St Unit 2nd Floor Bridgeport, CT | 3.0 | 1.0 | 1500 | $2,000 | $1.33 | 44d | 1 | 1.20mi |
| 136 Sherman St Unit 142 Bridgeport, CT | 4.0 | 1.5 | 2116 | $2,800 | $1.32 | 3d | 1 | 1.21mi |
| 511 E Main St Bridgeport, CT | 3.0 | 1.0 | 1100 | $2,300 | $2.09 | 44d | 1 | 1.26mi |
| 507 E Main St Bridgeport, CT | 3.0 | 1.0 | 1120 | $2,198 | $1.96 | 44d | 1 | 1.27mi |
| 505 E Main St Bridgeport, CT | 3.0 | 1.0 | 1120 | $2,199 | $1.96 | 44d | 1 | 1.27mi |
| 272 Davenport St Unit 2 Bridgeport, CT | 4.0 | 1.0 | 1066 | $2,200 | $2.06 | 24d | 1 | 1.27mi |
| 272 Davenport St Unit 2 Bridgeport, CT | 4.0 | 1.0 | 1066 | $2,200 | $2.06 | 14d | 1 | 1.27mi |
| 45-51 Cowles St Unit 45 Bridgeport, CT | 3.0 | 1.0 | 1200 | $2,550 | $2.12 | 21d | 1 | 1.34mi |
| 45-51 Cowles St Unit 45 Bridgeport, CT | 3.0 | 1.0 | 1200 | $2,600 | $2.17 | 14d | 1 | 1.34mi |
| 45-51 Cowles St Unit 45 Bridgeport, CT | 3.0 | 1.0 | 1200 | $2,400 | $2.00 | 3d | 1 | 1.34mi |
Listing history 13 events
-
2026-05-04status Under Contract 111-char remark
-
2026-05-02$349,900 Active 111-char remark
-
2016-04-15soldstatus $42,650 337-char remark
Show marketing remark (337 chars)
Brick Attached two family property that needs work. First Floor, repairs were started but not completed. Needs complete rehab. Most of the first floor unit has newer Sheetrock, and sub unit needs new kitchen and bath. Second Floor is in decent condition. will not Qualify for FHA or Traditional Fanancing, 203K and Cash Buyers preferred.
-
2016-03-07historical 337-char remark
Show marketing remark (337 chars)
Brick Attached two family property that needs work. First Floor, repairs were started but not completed. Needs complete rehab. Most of the first floor unit has newer Sheetrock, and sub unit needs new kitchen and bath. Second Floor is in decent condition. will not Qualify for FHA or Traditional Fanancing, 203K and Cash Buyers preferred.
-
2016-02-17$50,000 337-char remark
Show marketing remark (337 chars)
Brick Attached two family property that needs work. First Floor, repairs were started but not completed. Needs complete rehab. Most of the first floor unit has newer Sheetrock, and sub unit needs new kitchen and bath. Second Floor is in decent condition. will not Qualify for FHA or Traditional Fanancing, 203K and Cash Buyers preferred.
-
2011-06-02historical
-
2010-06-02$59,000
-
2009-10-31historical
-
2009-01-26$98,900
-
2007-11-30historical
-
2007-08-28$177,000
-
2007-02-16historical
-
2006-08-22$200,000
ⓘ Source: listings_history table (triggers on properties + properties_extension) + one-shot
backfill from property_details.listing_events for pre-trigger history.
Tax reassessment forecast CT · Partial reset (capped growth)
- Current annual tax
- $4,835 · $403/mo
- Projected year-2 tax
- $6,161 · $513/mo
- Expected delta
- +$1,326/yr (+$111/mo · 27.4%)
ⓘ Screening estimate from a state-policy table — verify with the county assessor before closing.
Climate risk First Street
- Flood 1/10 Low FEMA zone X (unshaded) · 0% chance over 30 yrs
- Wildfire 1/10 Low
- Heat 6/10 Major 7 d/yr ≥97°F today · 15 d/yr by 30 yrs out
- Wind 6/10 Major 54% chance of damaging wind over 30 yrs
- Air quality 4/10 Moderate 5 unhealthy d/yr today · 7 by 30 yrs out
Nearby sold comps map
Loading sold comps map…
Walkable amenities ~0.75 mi
Loading nearby amenities…
Taxation est. · year 1
- Rental income
- $48,312
- − Mortgage interest
- −$19,600
- − Property taxes
- −$4,835
- − Insurance
- −$1,750
- − Repairs & maintenance
- −$3,865
- − Management
- −$3,865
- − Depreciation
- −$10,179
- Taxable income
- $4,219
- Est. tax owed @ 24.0%
- −$1,013
- After-tax cash flow
- $8,550/yr
For passive investors: Depreciation is non-cash, so a rental often shows a tax loss while cash-flowing — sheltering income. Rental losses are passive: they offset passive income freely, and up to $25,000/yr can offset ordinary (W-2) income if you actively participate and your MAGI is under $100k (phasing out to $0 by $150k); unused losses carry forward. On sale, claimed depreciation is recaptured at up to 25%, and gains may owe capital-gains tax (a 1031 exchange can defer both). Figures are a year-1 estimate at your 24.0% rate — not tax advice; consult a CPA.
Schools (NCES district)
- District
- Bridgeport School District
- NCES district ID
- 0900450
- Math proficiency
- 9% ▼ -7.00%
- Reading proficiency
- 19% ▼ -10.00%
- Median HH income
- $41,507
- Composite
- 12.09/100
- National rank
- #9656
- State rank
- #151 of 153 in CT
Livability — Bridgeport
- Score
- 81/100
- State rank
- #15
- US rank
- #1374
Category grades
Schools grade is shown separately in the Schools card above.
Census & demographics
- Census place
- Bridgeport, CT
- County
- Fairfield County · 765,532 people
- City population
- 149,153
- Metro
- Bridgeport-Stamford-Norwalk, CT
- Population (ZIP)
- 22,020
- Household income
- $51,634
- Rent vs Own
- Severe rent burden
- 1368.0
Population outlook (Greater Bridgeport County) Hauer SSP2
- By 2040
- 365,581
Race, ethnicity, and origin ACS 2023
- Neighborhood character
- Diverse neighborhood (Simpson 0.65)
- Race & ethnicity
- Hispanic / Latino 51% Black 23% White 20% Two or more races 14% Asian 3% Native American 1%
- Hispanic origin (detail)
- Mexican 3% Puerto Rican 30% Dominican 6%
- Common ancestry
- Romanian 4% Estonian 3% Hispanic 2%
- Foreign-born
- 31% · Canada, Jamaica, Vietnam
- Languages at home
- 47% English-only · Spanish 40% Other Indo-European 5% Russian/Polish/Slavic 3%
Political lean MEDSL · Greater Bridgeport
- 2024 margin
- Strong D (+23.3) · D 60.9% · R 37.6% · Other 1.5%
- All cycles
- 2024: D+23.3
Not yet ingested
- Civics
- —
Market trends
- HPI YoY
- ▼ -29.78%
- Current HPI
- 370.1432
- Rent YoY
- —
- Metro
- Bridgeport-Stamford-Norwalk, CT
- State GDP YoY
- ▲ 1.06%
- F500 in state
- 38
Industry mix (Fortune 500 HQ in CT)
| Industry | F500 HQs | Revenue |
|---|---|---|
| Industrial Machinery | 4 | $38B |
|
||
| Insurance | 3 | $71B |
|
||
| Financial Services | 2 | $25B |
|
||
| Transportation / Logistics | 2 | $18B |
|
||
| Healthcare | 1 | $247B |
|
||
| Telecommunications | 1 | $55B |
|
||
Price history
+75.0% since first listed13 events — show timeline
- 2026-05-04 Pending — Smart MLS
- 2026-05-02 Listed $349,900 Smart MLS
- 2016-04-15 Sold (MLS) $42,650 Smart MLS
- 2016-03-07 Listing Removed — Smart MLS
- 2016-02-17 Listed $50,000 Smart MLS
- 2011-06-02 Listing Removed — Smart MLS
- 2010-06-02 Listed $59,000 Smart MLS
- 2009-10-31 Listing Removed — Smart MLS
- 2009-01-26 Listed $98,900 Smart MLS
- 2007-11-30 Listing Removed — Smart MLS
- 2007-08-28 Listed $177,000 Smart MLS
- 2007-02-16 Listing Removed — Smart MLS
- 2006-08-22 Listed $200,000 Smart MLS
Property tax history
-1.2%/yrLatest (2023): $4,835 · +0.0% YoY. Source: county tax records.
Cash-flow waterfall
monthlySold comps — $/sqft
last 12 mo · ≤1 miLoading sold comps…