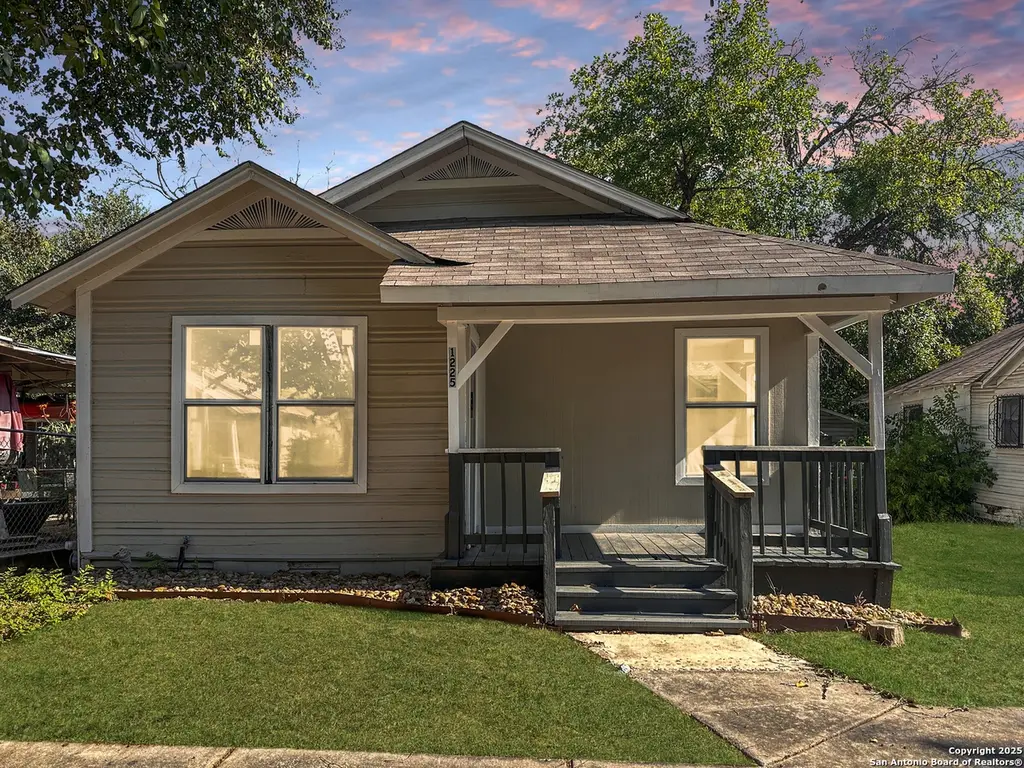
1225 Leal · San Antonio, TX
Flood risk 9/10 · Severe
- FEMA flood zone
- AE
- Chance of flooding over 30 yrs
- 0.99%
- Est. flood insurance / yr
- $1,737 – $8,500
Fire risk 1/10 · Minimal
- Est. fire insurance / yr
- $1,222 – $2,270
Heat risk 8/10 · Major
- Hot days now (above 109°F)
- 7 days/yr
- Hot days in 30 yrs
- 22 days/yr
Wind risk 6/10 · Moderate
- Chance of severe wind over 30 yrs
- 77.0%
Air-quality risk 2/10 · Minimal
- Unhealthy air days now
- 1 days/yr
- Unhealthy air days in 30 yrs
- 2 days/yr
Risk factors via First Street. Map © Google.
Why this score? — see what drove the A grade
The composite is a weighted blend of 9 inputs, each scored 0–100. Each bar is that input's sub-score; the figure is the points it added to the 100-point composite (weight × sub-score).
- Cash flow +30.0/30.0
- ARV discount +15.0/15.0
- 1% rule +10.0/10.0
- DSCR +10.0/10.0
- Appreciation +10.0/10.0
- Rent growth +4.4/5.0
- Livability +4.0/5.0
- Condition / age +2.5/5.0
- Schools +1.4/10.0
$89,900
🖨 Deal sheet (PDF) 📄 Offer letter ✓ Due diligence
Listing remarks MLS
This fantastic West Side Home, has many fine features that you will enjoy. On the exterior it has an inviting front porch, with a fenced back yard. Sits on a secluded low traffic street. Inside this quaint home features laminate flooring throughout and 2 full baths. The best feature by far is the attached separate living space that features a large living area with a separate bedroom and full bath.
Key facts
- Laminate flooring
- Large living area
- Fenced back yard
Tags
Neighborhood map
What this means for you Summary
Snapshot
- This is a 5-bed/2.0-bath single-family listed at $90k.
Deal economics
- At list price, monthly cash flow is $332 ($4k/yr) — positive.
- The deal already cash-flows at list — no discount required.
- Meets the 1% rule at list price ($2k rent vs $90k).
- Recommended offer: $79k (12.0% below list) — sets the bar for market timing.
Location & tenants
- Location reads 80/100 on livability (#31 in TX, #1,616 nationally) — a professional / high-income tenant draw. Strengths: amenities A+, commute A+, cost of living A+; Watch: crime F.
- San Antonio ISD (urban): math 12% / reading 22% proficiency, ranked #805 of 826 in TX (top 98%) — low school quality limits family demand, transient renter base, plan for 1-2y turnover; 80% free/reduced lunch — lower-income household profile, screen leases tightly.
- Zoned schools: David Crockett Academy (math 9% / reading 19%, grade F, #4,127 of 4,322 statewide, top 96%, 656 students, 98% FRL); Lanier H S (math 9% / reading 15%, grade F, #1,554 of 1,632 statewide, top 95%, 1,547 students, 97% FRL) — zoned schools average 97% FRL vs 80% district-wide (17 pts higher); higher-poverty schools than district average — tighter screening recommended.
- Market conditions: Rents rising fast (+7.7%/yr); 164 active listings in the ZIP; 5 comparable units currently listed for rent nearby; rentals at typical pace (median 26d on market — plan ~3-4 weeks tenant-placement turnaround); lower-income renter base — watch delinquency; 8,308 units permitted in Bexar County in 2024 (2,506 in 5+ unit buildings).
Forward outlook
- In year one you build about $10k of equity ($622 loan paydown + $9k appreciation (10.0% local appreciation)).
- Bexar County population projected at +50% by 2050 — long-run rental-demand tailwind backs the buy-and-hold thesis.
- At projected returns (10.0% appreciation + 7.7% rent growth), your $25k cash investment doubles in ~2 years — after that, you're playing with house money.
- By year 4, paydown + projected appreciation supports a ~$34k cash-out refi (75% LTV) — recoverable capital for the next deal without selling this one.
Negotiation context
- It's been on market 305 days — a 12% lower offer ($79k) is reasonable based on typical stale-listing flexibility.
- 7 sale attempts since 6y ago; this cycle's ask has dropped $30k (25%) from the opening price — seller is motivated, your offer sets the floor, not the list.
- Current owner paid $41k; list at $90k implies a 120% gain — meaningful room to come down on a strong offer.
Risks & watch-outs
- Watch-outs: property tax is 4.5% of price; flood insurance adds $427/mo; built in 1935 — expect roof / HVAC / electrical / plumbing capex.
- Climate carrying-cost: in FEMA flood zone AE (mandatory federal flood insurance); major wind risk, 77% chance of damaging wind over 30y; extreme-heat days projected 7→22/yr by 2055 (HVAC capex compounding) — expect insurance premiums to compound above CPI over the hold.
Questions for the listing agent
- It's been on market 305 days. Have you received any prior offers? Is the seller open to a 12% concession, seller financing, or rate buy-down credit?
- Built in 1935 — when were the roof, HVAC, electrical panel, plumbing, and water heater last replaced?
- Property tax is high relative to price — has the assessment been appealed recently, and will the sale trigger a re-assessment?
- What's the actual annual flood-insurance premium (NFIP or private), and is the property in a SFHA with mandatory coverage?
- Why hasn't it sold? Are there any deal-killer items the seller is aware of (foundation, flood, title, zoning, code violations)?
- Is there a deadline driving the sale (1031 exchange, divorce, estate, relocation)? That informs how much negotiation room exists.
- Crime grade is F in this area — have there been break-ins, vandalism, or insurance claims at this property in the last 3 years? What carrier currently insures it and at what premium?
- What's the average days-on-market for RENTAL listings here right now (not sales)? A rising rental-DOM trend means longer vacancies and softer asking-rent achievability than the comps imply.
- What's the recent tenant-quality profile in this submarket — average credit score on applications, eviction rate, late-payment / NSF rate, and stable-employment percentage? A property-management company in the area should have these aggregated.
- How much new for-sale + rental construction is in the pipeline within 1–3 miles? Heavy new supply typically softens prices + rents 12–24 months out; constrained supply supports both.
Investment metrics
- 1% rule
- 2.26% ✓
- Cap rate
- 16.41%
- Cash-on-cash
- 36.14%
- DSCR
- 2.61
- GRM
- 3.7
CMA / ARV
- ARV (median comp)
- $122,243
- List price
- $89,900
- Delta
- -26.46%
- Verdict
- UNDERPRICED
- Comps
- 20 within 1.0 mi
Show comp detail 2 sales within ~0.75 mi
| Address | Dist | Beds/Ba | Sqft | Sold | Price | $/sf | Match |
|---|---|---|---|---|---|---|---|
| 1111 Perez St | 0.45mi | 4/2.0 (-1) | 1,312 (-8%) | 14mo | $175,000 | $133 | 49 |
| 3222 W Martin St | 0.42mi | 6/1.0 (+1) | 1,218 (-15%) | 7mo | $59,000 | $48 | 41 |
Match score weights: distance 35% · size 25% · config 20% · recency 20%. Top-matched comps best support the ARV.
Projected returns pro-forma
10.0% appreciation · 7.73% rent growth · sell at horizon
- IRR
- 40.1%
- Equity multiple
- 4.20×
- Total profit
- $80,631
- Equity at exit
- $80,989
- IRR
- 37.5%
- Equity multiple
- 10.79×
- Total profit
- $246,506
- Equity at exit
- $174,656
Cash invested: $25,172 (down + closing). Projections, not guarantees.
Landlord ↔ Tenant lean methodology
- Overall (STATE)
- 87 Strongly Landlord-Friendly
- State Texas
- 87 Strongly Landlord-Friendly · R+5
- County
- — inherits STATE
- City
- — inherits STATE
ZIP-level market 78207
- Home prices YoY
- 15.2%
- Rents YoY
- 7.7%
- Active inventory
- 164
- Price-to-rent
- 3.7×
Monthly cashflow live
- Estimated rent
- $2,030 high interval (Pro) →
- Mortgage (P&I)
- −$471
- Tax from tax record
- −$337 /mo · $4,039/yr
- Insurance
- −$37
- Flood insurance flood zone
- −$427 /mo · $5,118/yr
- HOA
- −$0
- Vacancy / Maint / Mgmt
- −$426
- Net cashflow
- $332
Break-even live
Sensitivity live
| Price | -10% $382 | -5% $357 | +0% $332 | +5% $306 | +10% $281 |
|---|---|---|---|---|---|
| Rent | -10% $171 | -5% $251 | +0% $332 | +5% $412 | +10% $492 |
| Rate | -1.0pp $377 | -0.5pp $354 | base $332 | +0.5pp $308 | +1.0pp $285 |
UW: 25.0% down · 7.5% · 30yr · 1.5% tax · 5.0% vac · 8.0% maint · 8.0% mgmt
Financing live
Cash to close
- Down payment
- $22,475
- Closing costs
- $2,697
- Reserves months
- —
- Total cash needed
- —
Loan-product check · same deal, 3 products live
Conventional
25% down · 7.5% · 30yr
- Down + closing
- —
- Monthly P&I
- —
- Monthly cashflow
- —
- DSCR
- —
- Eligible?
- —
Personal DTI + credit; lowest rate.
DSCR
20% down · 8.5% · 30yr
- Down + closing
- —
- Monthly P&I
- —
- Monthly cashflow
- —
- DSCR
- —
- Eligible?
- —
No personal income docs; deal must DSCR.
Hard money
10% down · 12.0% · 12mo
- Down + closing
- —
- Monthly P&I
- —
- Monthly cashflow
- —
- DSCR
- —
- Eligible?
- —
Short-term bridge; refi at stabilization.
Rent comps 5 comps
| Address | Beds | Baths | Sqft | Rent | $/sqft | DOM | Units | Dist |
|---|---|---|---|---|---|---|---|---|
| 2246 W Houston St San Antonio, TX | 4.0 | 3.0 | 1654 | $2,100 | $1.27 | 12d | 1 | 0.51mi |
| 2811 Buena Vista St San Antonio, TX | 4.0 | 2.0 | 1750 | $2,350 | $1.34 | 25d | 1 | 0.66mi |
| 1623 W Ashby Pl San Antonio, TX | 4.0 | 2.0 | 1556 | $1,900 | $1.22 | 25d | 1 | 1.08mi |
| 210 Cadwallader St San Antonio, TX | 4.0 | 2.5 | 1396 | $1,975 | $1.41 | 45d | 1 | 1.27mi |
| 155 N Josephine Tobin Dr San Antonio, TX | 4.0 | 3.0 | 1782 | $1,900 | $1.07 | 16d | 1 | 1.36mi |
Listing history 50 events
-
2026-06-21days on market $89,900 Active 305 DOM
-
2026-06-18days on market $89,900 Active 302 DOM
-
2026-06-17days on market $89,900 Active 301 DOM
-
2026-06-16days on market $89,900 Active 300 DOM
-
2026-06-15days on market $89,900 Active 299 DOM
-
2026-06-13days on market $89,900 Active 297 DOM
-
2026-06-09days on market $89,900 Active 293 DOM
-
2026-06-08days on market $89,900 Active 292 DOM
-
2026-06-07days on market $89,900 Active 291 DOM
-
2026-06-04days on market $89,900 Active 288 DOM
-
2026-06-03days on market $89,900 Active 287 DOM
-
2026-06-02days on market $89,900 Active 286 DOM
-
2026-06-01days on market $89,900 Active 285 DOM
-
2026-05-31days on market $89,900 Active 284 DOM
-
2026-02-04price $89,900 405-char remark
Show marketing remark (405 chars)
This fantastic West Side Home, has many fine features that you will enjoy. On the exterior it has an inviting front porch, with a fenced back yard. Sits on a secluded low traffic street. Inside this quaint home features laminate flooring throughout and 2 full baths. The best feature by far is the attached separate living space that features a large living area with a separate bedroom and full bath.
-
2025-12-06price $99,000 405-char remark
Show marketing remark (405 chars)
This fantastic West Side Home, has many fine features that you will enjoy. On the exterior it has an inviting front porch, with a fenced back yard. Sits on a secluded low traffic street. Inside this quaint home features laminate flooring throughout and 2 full baths. The best feature by far is the attached separate living space that features a large living area with a separate bedroom and full bath.
-
2025-08-20$119,900 New 405-char remark
Show marketing remark (405 chars)
This fantastic West Side Home, has many fine features that you will enjoy. On the exterior it has an inviting front porch, with a fenced back yard. Sits on a secluded low traffic street. Inside this quaint home features laminate flooring throughout and 2 full baths. The best feature by far is the attached separate living space that features a large living area with a separate bedroom and full bath.
-
2025-05-07historical
-
2025-04-24price $160,000
-
2025-04-17price $165,000
-
2025-04-03price $169,999
-
2025-03-18price $170,000
-
2025-02-04price $180,000
-
2025-01-27price $190,000
-
2025-01-21price $204,999
-
2025-01-09price $205,000
-
2024-12-17price $210,000
-
2024-11-21$215,000 New
-
2023-12-13soldstatus
-
2023-12-11soldstatus Sold
-
2023-11-20historical Active Option
-
2023-10-21price $175,000
-
2023-10-12price $190,000
-
2023-10-06status Back on Market
-
2023-09-25historical
-
2023-09-09price $195,000
-
2023-07-02price $165,000
-
2023-05-19price $180,000
-
2023-04-13price $190,000
-
2023-03-25$210,000 New
-
2020-10-13soldstatus Sold
-
2020-10-13soldstatus
-
2020-09-21status Pending
-
2020-09-13historical Active Option
-
2020-07-21price $103,000
-
2020-07-17status Back on Market
-
2020-07-14historical Active Option
-
2020-07-12price $115,000
-
2020-07-01status Back on Market
-
2020-06-27historical Active Option
ⓘ Source: listings_history table (triggers on properties + properties_extension) + one-shot
backfill from property_details.listing_events for pre-trigger history.
Tax reassessment forecast TX · Resets to sale price
- Current annual tax
- $4,039 · $337/mo
- Projected year-2 tax
- $4,039 · $337/mo
- Expected delta
- $0/yr ($0/mo · 0.0%)
ⓘ Screening estimate from a state-policy table — verify with the county assessor before closing.
Climate risk First Street
- Flood 9/10 Extreme FEMA zone AE · 99% chance over 30 yrs
- Wildfire 1/10 Low
- Heat 8/10 Severe 7 d/yr ≥109°F today · 22 d/yr by 30 yrs out
- Wind 6/10 Major 77% chance of damaging wind over 30 yrs
- Air quality 2/10 Low 1 unhealthy d/yr today · 2 by 30 yrs out
Nearby sold comps map
Loading sold comps map…
Walkable amenities ~0.75 mi
Loading nearby amenities…
Taxation est. · year 1
- Rental income
- $24,358
- − Mortgage interest
- −$5,036
- − Property taxes
- −$4,039
- − Insurance
- −$5,568
- − Repairs & maintenance
- −$1,949
- − Management
- −$1,949
- − Depreciation
- −$2,615
- Taxable income
- $3,203
- Est. tax owed @ 24.0%
- −$769
- After-tax cash flow
- $3,210/yr
For passive investors: Depreciation is non-cash, so a rental often shows a tax loss while cash-flowing — sheltering income. Rental losses are passive: they offset passive income freely, and up to $25,000/yr can offset ordinary (W-2) income if you actively participate and your MAGI is under $100k (phasing out to $0 by $150k); unused losses carry forward. On sale, claimed depreciation is recaptured at up to 25%, and gains may owe capital-gains tax (a 1031 exchange can defer both). Figures are a year-1 estimate at your 24.0% rate — not tax advice; consult a CPA.
Schools (NCES district)
- District
- San Antonio ISD
- NCES district ID
- 4838730
- Math proficiency
- 12% ▼ -21.00%
- Reading proficiency
- 22% ▼ -7.00%
- Median HH income
- $30,952
- Composite
- 13.57/100
- National rank
- #9512
- State rank
- #805 of 826 in TX
Livability — San Antonio
- Score
- 80/100
- State rank
- #31
- US rank
- #1616
Category grades
Schools grade is shown separately in the Schools card above.
Census & demographics
- Census place
- San Antonio, TX
- County
- Bexar County · 1,990,555 people
- City population
- 1,806,925
- Metro
- San Antonio-New Braunfels, TX
- Population (ZIP)
- 55,474
- Household income
- $32,472
- Rent vs Own
- Severe rent burden
- 2789.0
Population outlook (Bexar County) Hauer SSP2
- Today (2025)
- 2,336,851 people
- By 2030
- 2,560,728 · +9.6%
- By 2040
- 3,020,569 · +29.3%
- By 2050
- 3,493,522 · +49.5%
- By 2075
- 4,668,459 · +99.8%
- By 2100
- 5,533,242 · +136.8%
Race, ethnicity, and origin ACS 2023
- Neighborhood character
- Predominantly Hispanic (88%)
- Race & ethnicity
- Hispanic / Latino 88% Two or more races 41% White 6% Black 5% Native American 2%
- Hispanic origin (detail)
- Mexican 79%
- Foreign-born
- 19% · Canada
- Languages at home
- 39% English-only · Spanish 60%
Political lean MEDSL · Bexar
- 2024 margin
- Lean D (+9.8) · D 54.3% · R 44.6% · Other 1.1%
- 2008→2024 swing
- +4.2pp toward D · 2008: 5.6pp · 2024: 9.8pp
- All cycles
- 2024: D+9.8 2020: D+18.2 2016: D+13.5 2012: D+4.6 2008: D+5.6
Not yet ingested
- Civics
- —
Market trends
- HPI YoY
- ▲ 34.92%
- Current HPI
- 264.7559
- Rent YoY
- ▲ 7.73%
- Metro
- San Antonio-New Braunfels, TX
- State GDP YoY
- ▲ 3.95%
- F500 in state
- 110
Industry mix (Fortune 500 HQ in TX)
| Industry | F500 HQs | Revenue |
|---|---|---|
| Energy | 16 | $1,198B |
|
||
| Technology | 5 | $198B |
|
||
| Engineering / Construction | 4 | $72B |
|
||
| Energy Services | 3 | $60B |
|
||
| Utilities | 3 | $41B |
|
||
| Healthcare | 2 | $330B |
|
||
Price history
+120.4% since first listed39 events — show timeline
- 2026-02-04 Price Changed $89,900 LERA
- 2025-12-06 Price Changed $99,000 LERA
- 2025-08-20 Listed $119,900 LERA
- 2025-05-07 Listing Removed — LERA
- 2025-04-24 Price Changed $160,000 LERA
- 2025-04-17 Price Changed $165,000 LERA
- 2025-04-03 Price Changed $169,999 LERA
- 2025-03-18 Price Changed $170,000 LERA
- 2025-02-04 Price Changed $180,000 LERA
- 2025-01-27 Price Changed $190,000 LERA
- 2025-01-21 Price Changed $204,999 LERA
- 2025-01-09 Price Changed $205,000 LERA
- 2024-12-17 Price Changed $210,000 LERA
- 2024-11-21 Listed $215,000 LERA
- 2023-12-13 Sold (Public Records) — Public Records
- 2023-12-11 Sold (MLS) — LERA
- 2023-11-20 Contingent — LERA
- 2023-10-21 Price Changed $175,000 LERA
- 2023-10-12 Price Changed $190,000 LERA
- 2023-10-06 Relisted — LERA
- 2023-09-25 Listing Removed — LERA
- 2023-09-09 Price Changed $195,000 LERA
- 2023-07-02 Price Changed $165,000 LERA
- 2023-05-19 Price Changed $180,000 LERA
- 2023-04-13 Price Changed $190,000 LERA
- 2023-03-25 Listed $210,000 LERA
- 2020-10-13 Sold (MLS) — LERA
- 2020-10-13 Sold (Public Records) — Public Records
- 2020-09-21 Pending — LERA
- 2020-09-13 Contingent — LERA
- 2020-07-21 Price Changed $103,000 LERA
- 2020-07-17 Relisted — LERA
- 2020-07-14 Contingent — LERA
- 2020-07-12 Price Changed $115,000 LERA
- 2020-07-01 Relisted — LERA
- 2020-06-27 Contingent — LERA
- 2020-05-25 Listed $120,000 LERA
- 1997-08-14 Sold (Public Records) $40,791 Public Records
- 1996-05-01 Sold (Public Records) — Public Records
Property tax history
+13.7%/yrLatest (2025): $4,039 · +0.0% YoY. Source: county tax records.
Cash-flow waterfall
monthlySold comps — $/sqft
last 12 mo · ≤1 miLoading sold comps…