1111 Wooding St · Houston, TX
Flood risk 4/10 · Minor
- FEMA flood zone
- X (unshaded)
- Chance of flooding over 30 yrs
- 0.21%
- Est. flood insurance / yr
- $507 – $1,088
Fire risk 1/10 · Minimal
- Est. fire insurance / yr
- $1,222 – $2,270
Heat risk 9/10 · Severe
- Hot days now (above 110°F)
- 7 days/yr
- Hot days in 30 yrs
- 24 days/yr
Wind risk 9/10 · Severe
- Chance of severe wind over 30 yrs
- 99.0%
Air-quality risk 2/10 · Minimal
- Unhealthy air days now
- 2 days/yr
- Unhealthy air days in 30 yrs
- 2 days/yr
Risk factors via First Street. Map © Google.
Why this score? — see what drove the D- grade
The composite is a weighted blend of 9 inputs, each scored 0–100. Each bar is that input's sub-score; the figure is the points it added to the 100-point composite (weight × sub-score).
- Appreciation +10.0/10.0
- ARV discount +6.8/15.0
- Cash flow +6.1/30.0
- Livability +3.7/5.0
- Schools +2.7/10.0
- Condition / age +2.5/5.0
- 1% rule +2.2/10.0
- Rent growth +1.8/5.0
- DSCR +0.4/10.0
$189,900
🖨 Deal sheet 📄 Offer letter ✓ Due diligence
Listing remarks
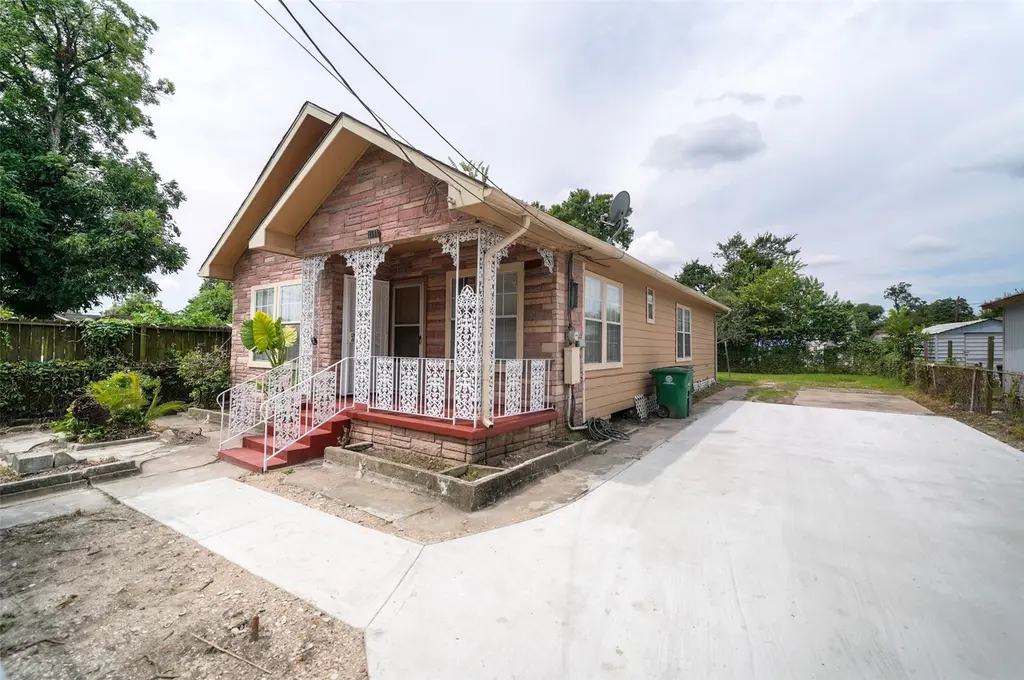
This traditional, fully fenced home is located in the revitalized East End area, just minutes from Downtown and a short drive to the Medical Center. The property features a welcoming covered front porch and a spacious side parking area. Inside, the home offers three bedrooms and two bathrooms, with mostly laminate flooring throughout. The kitchen is equipped with a gas stove, granite countertops, and tile flooring. The main bathroom includes a tub/shower combination with tile finishes. The backyard provides a small covered patio along with a storage shed for added convenience. Additional highlights include central A/C and separate living and dining areas. Affordable and well-located, this h
Key facts
- Covered front porch
- Small covered patio
- Gas stove
Tags
Property features AI
Exterior
- Utilities: Public water; Public sewer
- Home design: Residential property; Built in 1930; Single-story entry
- Construction: Cement siding; Wood siding; Block foundation; Composition roof
- Exterior features: Deck; Patio; Private yard; Fully fenced yard; Storage shed
Interior
- Kitchen: Free-standing range; Gas oven
- Flooring: Laminate flooring; Tile flooring
- Bathrooms: 2 full bathrooms
- Heating & cooling: Central heating (gas); Central electric air conditioning
- Interior features: Granite counters; Tub with shower; Ceiling fans; No fireplaces; Seven total rooms
- Laundry & utility: Washer hookup; Electric dryer hookup
Neighborhood map
What this means for you Summary
Snapshot
- This is a 2-bed/1.0-bath single-family listed at $190k.
Deal economics
- At list price, monthly cash flow is $-354 ($-4k/yr) — negative.
- To cash-flow at today's rent, offer at most $127k (32.9% below list).
- To meet the 1% rule (rent ≥ 1% of price), the offer needs to be $136k (28.4% below list).
- Recommended offer: $127k (32.9% below list) — sets the bar for cash-flow.
- Cap rate 4.1% vs local median 3.2% in Houston — meaningfully above typical; check what's discounted (condition, days-on-market, listing class) to confirm the premium yield is real.
Location & tenants
- Location reads 74/100 on livability (#184 in TX, #4,771 nationally) — a middle-class / working-renter tenant base. Strengths: amenities A+, cost of living A+, housing A+; Watch: crime F.
- Houston ISD (urban): math 27% / reading 35% proficiency, ranked #593 of 826 in TX (top 72%) — families likely to look elsewhere, expect single-tenant / working-renter base with shorter leases; 71% free/reduced lunch — lower-income household profile, screen leases tightly.
- Zoned schools: Edison Middle (math 12% / reading 16%, grade F, #1,596 of 1,662 statewide, top 96%, 460 students, 96% FRL); Austin H S (math 9% / reading 18%, grade F, #1,530 of 1,632 statewide, top 94%, 1,448 students, 97% FRL) — zoned schools average 97% FRL vs 71% district-wide (25 pts higher); higher-poverty schools than district average — tighter screening recommended.
- Zoned-school proficiency averages 14% at this address vs 31% district-wide (-17 pts) — the specific schools serving this property underperform the Houston ISD average; the district grade overstates school quality for this exact location.
- Market conditions: Rents soft (-2.9%/yr); 161 active listings in the ZIP; 40 comparable units currently listed for rent nearby; rentals at typical pace (median 22d on market — plan ~3-4 weeks tenant-placement turnaround); 42% of comp listings sitting > 30 days — soft ceiling on asking rent; 29,883 units permitted in Harris County in 2024 (8,621 in 5+ unit buildings).
- This rent runs 33% of the median local income ($50k/yr) — at the standard rent-burdened threshold; future hikes will face affordability resistance.
Forward outlook
- In year one you build about $20k of equity ($1k loan paydown + $19k appreciation (10.0% local appreciation)).
- Harris County population projected at +47% by 2050 — long-run rental-demand tailwind backs the buy-and-hold thesis.
- By year 2, paydown + projected appreciation supports a ~$33k cash-out refi (75% LTV) — recoverable capital for the next deal without selling this one.
Negotiation context
- It's been on market 51 days — a 3% lower offer ($184k) is reasonable based on typical stale-listing flexibility.
Risks & watch-outs
- Watch-outs: built in 1930 — expect roof / HVAC / electrical / plumbing capex.
- Climate carrying-cost: severe wind risk, 99% chance of damaging wind over 30y; extreme-heat days projected 7→24/yr by 2055 (HVAC capex compounding) — expect insurance premiums to compound above CPI over the hold.
Questions for the listing agent
- What do current leases actually rent for vs. the listed asking? Can we see a recent rent roll and the last 12 months of T-12 income?
- It's been on market 51 days. Have you received any prior offers? Is the seller open to a 33% concession, seller financing, or rate buy-down credit?
- Built in 1930 — when were the roof, HVAC, electrical panel, plumbing, and water heater last replaced?
- Is there a deadline driving the sale (1031 exchange, divorce, estate, relocation)? That informs how much negotiation room exists.
- Schools are D-rated, which usually means shorter tenancies and higher turnover. Who's the typical renter profile here, and what's been the actual vacancy rate?
- Crime grade is F in this area — have there been break-ins, vandalism, or insurance claims at this property in the last 3 years? What carrier currently insures it and at what premium?
- The area grade is low — what's the realistic commute time and amenity access for the typical tenant pool here? Any planned neighborhood developments (good or bad) we should know about?
- What's the average days-on-market for RENTAL listings here right now (not sales)? A rising rental-DOM trend means longer vacancies and softer asking-rent achievability than the comps imply.
- What's the recent tenant-quality profile in this submarket — average credit score on applications, eviction rate, late-payment / NSF rate, and stable-employment percentage? A property-management company in the area should have these aggregated.
- How much new for-sale + rental construction is in the pipeline within 1–3 miles? Heavy new supply typically softens prices + rents 12–24 months out; constrained supply supports both.
Investment metrics
- 1% rule
- 0.72% ✗
- Cap rate
- 4.06%
- Cash-on-cash
- -7.98%
- DSCR
- 0.64
- GRM
- 11.6
CMA / ARV
- ARV (median comp)
- $186,866
- List price
- $189,900
- Delta
- 1.62%
- Verdict
- FAIR
- Comps
- 20 within 1.0 mi
Show comp detail 12 sales within ~0.75 mi
| Address | Dist | Beds/Ba | Sqft | Sold | Price | $/sf | Match |
|---|---|---|---|---|---|---|---|
| 7002 Avenue O | 0.15mi | 2/1.0 | 1,142 (-1%) | 1mo | $165,000 | $144 | 91 |
| 7201 Avenue I | 0.26mi | 2/1.0 | 1,066 (-8%) | 9mo | $181,999 | $171 | 68 |
| 7204 Avenue E | 0.43mi | 3/2.0 (+1) | 1,139 (-1%) | 9mo | $234,900 | $206 | 62 |
| 7337 Avenue I | 0.44mi | 2/2.0 | 1,101 (-5%) | 10mo | $299,000 | $272 | 60 |
| 1605 W Hedrick St | 0.30mi | 3/2.0 (+1) | 1,068 (-8%) | 7mo | $227,500 | $213 | 59 |
| 7409 Avenue K | 0.49mi | 2/2.0 | 1,232 (+7%) | 6mo | $239,500 | $194 | 57 |
| 6602 Avenue F | 0.63mi | 2/2.0 | 1,200 (+4%) | 5mo | $289,000 | $241 | 56 |
| 6813 Avenue U | 0.54mi | 2/2.5 | 1,092 (-5%) | 11mo | $234,500 | $215 | 51 |
| 6526 Sherman St | 0.71mi | 2/1.5 | 1,217 (+6%) | 9mo | $265,950 | $219 | 48 |
| 706 72nd St | 0.31mi | 3/2.0 (+1) | 1,300 (+13%) | 9mo | $260,000 | $200 | 48 |
| 6619 Avenue Unit Q | 0.59mi | 3/1.0 (+1) | 1,056 (-8%) | 7mo | $135,000 | $128 | 48 |
| 6515 Avenue F | 0.67mi | 3/2.0 (+1) | 1,228 (+6%) | 5mo | $285,000 | $232 | 45 |
Match score weights: distance 35% · size 25% · config 20% · recency 20%. Top-matched comps best support the ARV.
Projected returns pro-forma
10.0% appreciation · 0.0% rent growth · sell at horizon
- IRR
- 17.8%
- Equity multiple
- 2.45×
- Total profit
- $76,999
- Equity at exit
- $171,077
- IRR
- 16.2%
- Equity multiple
- 5.47×
- Total profit
- $237,517
- Equity at exit
- $368,934
Cash invested: $53,172 (down + closing). Projections, not guarantees.
Landlord ↔ Tenant lean methodology
- Overall (STATE)
- 87 Strongly Landlord-Friendly
- State Texas
- 87 Strongly Landlord-Friendly · R+5
- County
- — inherits STATE
- City
- — inherits STATE
ZIP-level market 77011
- Home prices YoY
- 30.1%
- Rents YoY
- -2.9%
- Active inventory
- 161
- Price-to-rent
- 11.6×
Monthly cashflow live
- Estimated rent
- $1,360 high interval (Pro) →
- Mortgage (P&I)
- −$996
- Tax from tax record
- −$353 /mo · $4,234/yr
- Insurance
- −$79
- HOA
- −$0
- Vacancy / Maint / Mgmt
- −$286
- Net cashflow
- $-354
Break-even live
UW: 25.0% down · 7.5% · 30yr · 1.5% tax · 5.0% vac · 8.0% maint · 8.0% mgmt
Financing live
Cash to close
- Down payment
- $47,475
- Closing costs
- $5,697
- Reserves months
- —
- Total cash needed
- —
Loan-product check · same deal, 3 products live
Conventional
25% down · 7.5% · 30yr
- Down + closing
- —
- Monthly P&I
- —
- Monthly cashflow
- —
- DSCR
- —
- Eligible?
- —
Personal DTI + credit; lowest rate.
DSCR
20% down · 8.5% · 30yr
- Down + closing
- —
- Monthly P&I
- —
- Monthly cashflow
- —
- DSCR
- —
- Eligible?
- —
No personal income docs; deal must DSCR.
Hard money
10% down · 12.0% · 12mo
- Down + closing
- —
- Monthly P&I
- —
- Monthly cashflow
- —
- DSCR
- —
- Eligible?
- —
Short-term bridge; refi at stabilization.
Rent comps 40 comps
| Address | Beds | Baths | Sqft | Rent | $/sqft | DOM | Units | Dist |
|---|---|---|---|---|---|---|---|---|
| 7043 Avenue L Houston, TX | 3.0 | 2.0 | 999 | $1,845 | $1.85 | 43d | 1 | 0.06mi |
| 812 Maltby St Houston, TX | 2.0 | 1.0 | 860 | $600 | $0.70 | 43d | 1 | 0.17mi |
| 7046 Avenue F Unit F Houston, TX | 1.0 | 1.0 | 700 | $800 | $1.14 | 43d | 1 | 0.33mi |
| 507 N 71st St Unit D Houston, TX | 1.0 | 1.0 | 700 | $800 | $1.14 | 43d | 1 | 0.34mi |
| 505 N 71st St Unit B Houston, TX | 1.0 | 1.0 | 700 | $800 | $1.14 | 43d | 1 | 0.35mi |
| 503 71st St Houston, TX | 1.0 | 1.0 | 700 | $850 | $1.21 | 43d | 1 | 0.35mi |
| 217 N 72nd St Houston, TX | 2.0 | 2.0 | 1017 | $1,525 | $1.50 | 43d | 1 | 0.52mi |
| 6707 Avenue F Unit F Houston, TX | 1.0 | 1.0 | 714 | $1,250 | $1.75 | 43d | 1 | 0.52mi |
| 7250 Avenue C Houston, TX | 1.0–3.0 | 1.0–2.0 | 886 | $1,415 | $1.60 | 1d | 14 | 0.56mi |
| 7310 Sherman St Houston, TX | 1.0–3.0 | 1.0–2.0 | 879 | $1,299 | $1.48 | 2d | 7 | 0.61mi |
| 6602 Avenue R Unit D Houston, TX | 2.0 | 1.0 | 830 | $1,235 | $1.49 | 7d | 1 | 0.64mi |
| 7530 Canal St Unit 12 Houston, TX | 2.0 | 1.0 | 825 | $1,025 | $1.24 | 4d | 1 | 0.70mi |
| 7530 Canal St Houston, TX | 2.0 | 1.0 | 825 | $938 | $1.14 | 18d | 2 | 0.70mi |
| 7530 Canal St Houston, TX | 2.0 | 1.0 | 825 | $988 | $1.20 | 12d | 2 | 0.70mi |
| 7520 Avenue C Houston, TX | 1.0–2.0 | 1.0–2.0 | 745 | $1,313 | $1.76 | 43d | 31 | 0.77mi |
| 6403 Avenue C Unit 1019625P Houston, TX | 2.0–8.0 | 1.0–4.0 | 1232 | $2,478 | $2.01 | 2d | 2 | 0.85mi |
| 5601 Canal St Unit 1148 Houston, TX | 1.0 | 1.0 | 777 | $1,342 | $1.73 | 3d | 1 | 1.15mi |
| 5601 Canal St Unit 1162 Houston, TX | 1.0 | 1.0 | 777 | $1,345 | $1.73 | 5d | 1 | 1.15mi |
| 5601 Canal St Unit 2148 Houston, TX | 2.0 | 2.0 | 943 | $1,532 | $1.62 | 3d | 1 | 1.15mi |
| 5601 Canal St Unit 424 Houston, TX | 2.0 | 2.0 | 943 | $1,540 | $1.63 | 7d | 1 | 1.17mi |
| 5601 Canal St Unit 1174 Houston, TX | 1.0 | 1.0 | 777 | $1,334 | $1.72 | 12d | 1 | 1.17mi |
| 5601 Canal St Unit 2174 Houston, TX | 2.0 | 2.0 | 943 | $1,575 | $1.67 | 12d | 1 | 1.17mi |
| 5601 Canal St Unit 5616 Houston, TX | 1.0 | 1.0 | 777 | $1,384 | $1.78 | 10d | 1 | 1.17mi |
| 5601 Canal St Unit 5622 Houston, TX | 1.0 | 1.0 | 777 | $1,375 | $1.77 | 43d | 1 | 1.17mi |
| 5601 Canal St Unit 324 Houston, TX | 1.0 | 1.0 | 777 | $1,345 | $1.73 | 7d | 1 | 1.17mi |
| 5601 Canal St Unit 5616 Houston, TX | 1.0 | 1.0 | 777 | $1,380 | $1.78 | 14d | 1 | 1.17mi |
| 5601 Canal St Unit 5658 Houston, TX | 2.0 | 2.0 | 943 | $1,564 | $1.66 | 10d | 1 | 1.17mi |
| 6526 Jamail Dr Houston, TX | 2.0 | 2.0 | 1025 | $1,449 | $1.41 | 43d | 1 | 1.20mi |
| 6520 Jamail Dr Houston, TX | 2.0 | 2.0 | 1025 | $1,504 | $1.47 | 2d | 4 | 1.23mi |
| 2203 Pearl St Houston, TX | 3.0 | 2.0 | 1298 | $1,570 | $1.21 | 14d | 1 | 1.23mi |
| 956 Villa De Matel Rd Houston, TX | 2.0 | 1.0 | 928 | $1,039 | $1.12 | 22d | 1 | 1.26mi |
| 956 Villa De Matel Rd Houston, TX | 1.0 | 1.0 | 736 | $899 | $1.22 | 43d | 1 | 1.26mi |
| 956 Villa De Matel Rd Houston, TX | 2.0 | 1.0 | 928 | $1,039 | $1.12 | 24d | 1 | 1.26mi |
| 956 Villa De Matel Rd Houston, TX | 1.0 | 1.0 | 736 | $899 | $1.22 | 18d | 1 | 1.26mi |
| 960 Villa De Matel Rd Houston, TX | 2.0 | 1.0 | 1056 | $1,129 | $1.07 | 24d | 1 | 1.29mi |
| 1016 S Wayside Dr Houston, TX | 3.0 | 2.0 | 1021 | $1,425 | $1.40 | 43d | 1 | 1.33mi |
| 1010 S Wayside Dr Houston, TX | 1.0 | 1.0 | 700 | $1,255 | $1.79 | 43d | 1 | 1.34mi |
| 1010 S Wayside Dr Unit 504 Houston, TX | 2.0 | 1.0 | 844 | $1,398 | $1.66 | 43d | 1 | 1.34mi |
| 1010 S Wayside Dr Unit 505 Houston, TX | 2.0 | 1.0 | 844 | $1,602 | $1.90 | 43d | 1 | 1.34mi |
| 1010 S Wayside Dr Unit 402 Houston, TX | 2.0 | 2.0 | 950 | $1,659 | $1.75 | 43d | 1 | 1.34mi |
Listing history 14 events
-
2026-06-18days on market $189,900 Active 51 DOM
-
2026-06-17days on market $189,900 Active 50 DOM
-
2026-06-16days on market $189,900 Active 49 DOM
-
2026-06-15days on market $189,900 Active 48 DOM
-
2026-06-13days on market $189,900 Active 46 DOM
-
2026-06-10days on market $189,900 Active 42 DOM
-
2026-06-08days on market $189,900 Active 41 DOM
-
2026-06-07days on market $189,900 Active 40 DOM
-
2026-06-04days on market $189,900 Active 37 DOM
-
2026-06-01days on market $189,900 Active 34 DOM
-
2026-05-31days on market $189,900 Active 33 DOM
-
2026-04-28$195,000 Active 773-char remark
-
2019-02-04soldstatus
-
1988-01-02soldstatus
ⓘ Source: listings_history table (triggers on properties + properties_extension) + one-shot
backfill from property_details.listing_events for pre-trigger history.
Tax reassessment forecast TX · Resets to sale price
- Current annual tax
- $4,234 · $353/mo
- Projected year-2 tax
- $4,234 · $353/mo
- Expected delta
- $0/yr ($0/mo · 0.0%)
ⓘ Screening estimate from a state-policy table — verify with the county assessor before closing.
Climate risk First Street
- Flood 4/10 Moderate FEMA zone X (unshaded) · 21% chance over 30 yrs
- Wildfire 1/10 Low
- Heat 9/10 Extreme 7 d/yr ≥110°F today · 24 d/yr by 30 yrs out
- Wind 9/10 Extreme 99% chance of damaging wind over 30 yrs
- Air quality 2/10 Low 2 unhealthy d/yr today · 2 by 30 yrs out
Nearby sold comps map
Loading sold comps map…
Walkable amenities ~0.75 mi
Loading nearby amenities…
Taxation est. · year 1
- Rental income
- $16,315
- − Mortgage interest
- −$10,637
- − Property taxes
- −$4,234
- − Insurance
- −$950
- − Repairs & maintenance
- −$1,305
- − Management
- −$1,305
- − Depreciation
- −$5,524
- Taxable loss
- −$7,641
- Est. tax savings @ 24.0%
- +$1,834
- After-tax cash flow
- $-2,411/yr
For passive investors: Depreciation is non-cash, so a rental often shows a tax loss while cash-flowing — sheltering income. Rental losses are passive: they offset passive income freely, and up to $25,000/yr can offset ordinary (W-2) income if you actively participate and your MAGI is under $100k (phasing out to $0 by $150k); unused losses carry forward. On sale, claimed depreciation is recaptured at up to 25%, and gains may owe capital-gains tax (a 1031 exchange can defer both). Figures are a year-1 estimate at your 24.0% rate — not tax advice; consult a CPA.
Schools (NCES district)
- District
- Houston ISD
- NCES district ID
- 4823640
- Math proficiency
- 27% ▼ -18.00%
- Reading proficiency
- 35% ▼ -6.00%
- Median HH income
- $46,054
- Composite
- 26.63/100
- National rank
- #7173
- State rank
- #593 of 826 in TX
Livability — Houston
- Score
- 74/100
- State rank
- #184
- US rank
- #4771
Category grades
Schools grade is shown separately in the Schools card above.
Census & demographics
- Census place
- Houston, TX
- County
- Harris County · 4,702,590 people
- City population
- 3,226,434
- Metro
- Houston-The Woodlands-Sugar Land, TX
- Population (ZIP)
- 14,940
- Household income
- $50,133
- Rent vs Own
- Severe rent burden
- 655.0
Population outlook (Harris County) Hauer SSP2
- Today (2025)
- 5,571,493 people
- By 2030
- 6,089,821 · +9.3%
- By 2040
- 7,142,806 · +28.2%
- By 2050
- 8,185,864 · +46.9%
- By 2075
- 10,574,329 · +89.8%
- By 2100
- 12,109,958 · +117.4%
Race, ethnicity, and origin ACS 2023
- Neighborhood character
- Predominantly Hispanic (88%)
- Race & ethnicity
- Hispanic / Latino 88% Two or more races 29% White 7% Black 3%
- Hispanic origin (detail)
- Mexican 81%
- Foreign-born
- 33% · Canada
- Languages at home
- 24% English-only · Spanish 76%
Political lean MEDSL · Harris
- 2024 margin
- Lean D (+5.5) · D 52.0% · R 46.4% · Other 1.6%
- 2008→2024 swing
- +3.9pp toward D · 2008: 1.6pp · 2024: 5.5pp
- All cycles
- 2024: D+5.5 2020: D+13.3 2016: D+12.4 2012: D+0.1 2008: D+1.6
Not yet ingested
- Civics
- —
Market trends
- HPI YoY
- ▲ 68.18%
- Current HPI
- 295.1198
- Rent YoY
- ▼ -2.93%
- Metro
- Houston-The Woodlands-Sugar Land, TX
- State GDP YoY
- ▲ 3.95%
- F500 in state
- 110
Industry mix (Fortune 500 HQ in TX)
| Industry | F500 HQs | Revenue |
|---|---|---|
| Energy | 16 | $1,198B |
|
||
| Technology | 5 | $198B |
|
||
| Engineering / Construction | 4 | $72B |
|
||
| Energy Services | 3 | $60B |
|
||
| Utilities | 3 | $41B |
|
||
| Healthcare | 2 | $330B |
|
||
Price history
-2.6% since first listed4 events — show timeline
- 2026-05-22 Price Changed $189,900 HARMLS
- 2026-04-28 Listed $195,000 HARMLS
- 2019-02-04 Sold (Public Records) — Public Records
- 1988-01-02 Sold (Public Records) — Public Records
Property tax history
+5.9%/yrLatest (2025): $4,234 · +14.6% YoY. Source: county tax records.
Cash-flow waterfall
monthlySold comps — $/sqft
last 12 mo · ≤1 miLoading sold comps…