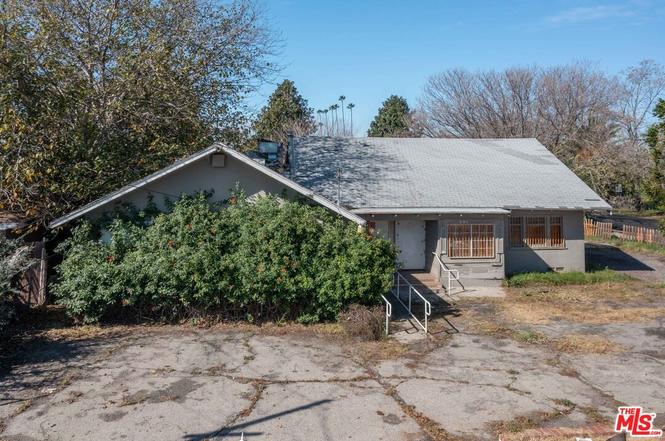
291 N Yale St · Hemet, CA
Flood risk 6/10 · Moderate
- FEMA flood zone
- AH
- Chance of flooding over 30 yrs
- 0.74%
- Est. flood insurance / yr
- $1,142 – $2,507
Fire risk 2/10 · Minimal
- Est. fire insurance / yr
- $659 – $1,223
Heat risk 8/10 · Major
- Hot days now (above 104°F)
- 7 days/yr
- Hot days in 30 yrs
- 21 days/yr
Wind risk 1/10 · Minimal
- Chance of severe wind over 30 yrs
- —
Air-quality risk 6/10 · Moderate
- Unhealthy air days now
- 12 days/yr
- Unhealthy air days in 30 yrs
- 14 days/yr
Risk factors via First Street. Map © Google.
Why this score? — see what drove the C- grade
The composite is a weighted blend of 9 inputs, each scored 0–100. Each bar is that input's sub-score; the figure is the points it added to the 100-point composite (weight × sub-score).
- Cash flow +16.3/30.0
- ARV discount +15.0/15.0
- DSCR +5.0/10.0
- 1% rule +4.4/10.0
- Rent growth +3.7/5.0
- Livability +2.6/5.0
- Schools +2.5/10.0
- Condition / age +2.5/5.0
- Appreciation +0.0/10.0
$325,000
🖨 Deal sheet (PDF) 📄 Offer letter ✓ Due diligence
Listing remarks MLS
Opportunity Knocks! Investors dream property located in Hemet! 291 N Yale St offers a rare and unique opportunity with endless potential to renovate or completely remodel - perfect for an owner/user or investor! Per title - the property is comprised of 2,820 sqft and features 4 bedrooms, 4 bathrooms and is situated on a large 12,632 sqft corner lot with possible ADU potential. This property has everything you need to inspire your dream renovation, nearby trendy shops, cafes, restaurants, and schools!
Key facts
- New interior framing
- Rehab and resale
- 0.29 acre lot
Tags
Property features AI
Finance
- Other: Assessor parcel number 445-202-033; Possession at close of escrow
Exterior
- Parking: Driveway
- Home design: Single-family detached home; One level
- Construction: Detached/no common walls
- Exterior features: Other detached structures; R1 zoning
Interior
- Flooring: Other flooring
- Bathrooms: 4 full bathrooms
- Heating & cooling: No heating; No cooling
- Interior features: Additional room; As-is condition (Lender Owned/REO)
- Laundry & utility: Laundry inside
Neighborhood map
What this means for you Summary
Snapshot
- This is a 4-bed/4.0-bath single-family listed at $325k.
Deal economics
- At list price, monthly cash flow is $24 ($292/yr) — positive.
- The deal already cash-flows at list — no discount required.
- To meet the 1% rule (rent ≥ 1% of price), the offer needs to be $305k (6.1% below list).
- Recommended offer: $305k (6.1% below list) — sets the bar for 1% rule.
- Cap rate 6.9% vs local median 4.9% in Hemet — top-decile yield for the area; either an underpriced asset or a hidden risk that comps aren't pricing in. Stress-test before assuming the spread holds.
Location & tenants
- Location reads 51/100 on livability (#1,056 in CA) — a working-class tenant base; expect higher turnover. Strengths: housing A+; Watch: crime D+, schools F, amenities F.
- Hemet Unified (suburban): math 19% / reading 41% proficiency, ranked #360 of 517 in CA (top 70%) — families likely to look elsewhere, expect single-tenant / working-renter base with shorter leases; 66% free/reduced lunch — lower-income household profile, screen leases tightly.
- Market conditions: Rents rising fast (+4.9%/yr); 323 active listings in the ZIP; 7 comparable units currently listed for rent nearby; rentals at typical pace (median 25d on market — plan ~3-4 weeks tenant-placement turnaround); 43% of comp listings sitting > 30 days — soft ceiling on asking rent; 9,195 units permitted in Riverside County in 2024 (1,512 in 5+ unit buildings).
- At $3,052/mo this rent would consume 50% of the median local household income ($74k/yr) (locally 1518% of renters already pay >50% of income on rent) — very limited rent-growth headroom before tenants either downsize or default.
Forward outlook
- Local home prices are declining (-3.0%/yr); year-one equity from $2k of loan paydown is wiped out by about $10k of value loss. Plan a longer hold.
- Riverside County population projected at +22% by 2050 — long-run rental-demand tailwind backs the buy-and-hold thesis.
Negotiation context
- It's been on market 84 days — a 6% lower offer ($306k) is reasonable based on typical stale-listing flexibility.
- 7 sale attempts since 10y ago with the ask held roughly flat each time — persistent listings suggest the price (not the market) is what's stuck; bring a comps-based counter.
Risks & watch-outs
- Watch-outs: flood insurance adds $152/mo; built in 1947 — expect roof / HVAC / electrical / plumbing capex.
- Climate carrying-cost: in FEMA flood zone AH (mandatory federal flood insurance); extreme-heat days projected 7→21/yr by 2055 (HVAC capex compounding) — expect insurance premiums to compound above CPI over the hold.
Questions for the listing agent
- It's been on market 84 days. Have you received any prior offers? Is the seller open to a 6% concession, seller financing, or rate buy-down credit?
- Built in 1947 — when were the roof, HVAC, electrical panel, plumbing, and water heater last replaced?
- What's the actual annual flood-insurance premium (NFIP or private), and is the property in a SFHA with mandatory coverage?
- Why hasn't it sold? Are there any deal-killer items the seller is aware of (foundation, flood, title, zoning, code violations)?
- Is there a deadline driving the sale (1031 exchange, divorce, estate, relocation)? That informs how much negotiation room exists.
- Schools are F-rated, which usually means shorter tenancies and higher turnover. Who's the typical renter profile here, and what's been the actual vacancy rate?
- Crime grade is D in this area — have there been break-ins, vandalism, or insurance claims at this property in the last 3 years? What carrier currently insures it and at what premium?
- What's the average days-on-market for RENTAL listings here right now (not sales)? A rising rental-DOM trend means longer vacancies and softer asking-rent achievability than the comps imply.
- What's the recent tenant-quality profile in this submarket — average credit score on applications, eviction rate, late-payment / NSF rate, and stable-employment percentage? A property-management company in the area should have these aggregated.
- How much new for-sale + rental construction is in the pipeline within 1–3 miles? Heavy new supply typically softens prices + rents 12–24 months out; constrained supply supports both.
Investment metrics
- 1% rule
- 0.94% ✗
- Cap rate
- 6.94%
- Cash-on-cash
- 2.33%
- DSCR
- 1.10
- GRM
- 8.9
CMA / ARV
- ARV (on-the-fly)
- $583,740
- Comps found
- 2
Show comp detail 2 sales within ~0.75 mi
| Address | Dist | Beds/Ba | Sqft | Sold | Price | $/sf | Match |
|---|---|---|---|---|---|---|---|
| 3260 Vista Way | 0.74mi | 4/2.5 | 2,592 (-8%) | 7mo | $520,000 | $201 | 40 |
| 2906 Mockingbird Ln | 0.55mi | 3/2.5 (-1) | 2,421 (-14%) | 14mo | $500,000 | $207 | 28 |
Match score weights: distance 35% · size 25% · config 20% · recency 20%. Top-matched comps best support the ARV.
Projected returns pro-forma
-3.0% appreciation · 4.9% rent growth · sell at horizon
- IRR
- -13.5%
- Equity multiple
- 0.51×
- Total profit
- $-45,038
- Equity at exit
- $48,459
- IRR
- -1.7%
- Equity multiple
- 0.88×
- Total profit
- $-11,326
- Equity at exit
- $28,100
Cash invested: $91,000 (down + closing). Projections, not guarantees.
Landlord ↔ Tenant lean methodology
- Overall (STATE)
- 18 Strongly Tenant-Friendly
- State California
- 18 Strongly Tenant-Friendly · D+13
- County
- — inherits STATE
- City
- — inherits STATE
ZIP-level market 92544
- Rents YoY
- 4.9%
- Active inventory
- 323
- Price-to-rent
- 8.9×
Monthly cashflow live
- Estimated rent
- $3,052 high interval (Pro) →
- Mortgage (P&I)
- −$1,704
- Tax from tax record
- −$395 /mo · $4,738/yr
- Insurance
- −$135
- Flood insurance flood zone
- −$152 /mo · $1,824/yr
- HOA
- −$0
- Vacancy / Maint / Mgmt
- −$641
- Net cashflow
- $24
Break-even live
Sensitivity live
| Price | -10% $208 | -5% $116 | +0% $24 | +5% $-68 | +10% $-160 |
|---|---|---|---|---|---|
| Rent | -10% $-217 | -5% $-96 | +0% $24 | +5% $145 | +10% $265 |
| Rate | -1.0pp $188 | -0.5pp $107 | base $24 | +0.5pp $-60 | +1.0pp $-146 |
UW: 25.0% down · 7.5% · 30yr · 1.5% tax · 5.0% vac · 8.0% maint · 8.0% mgmt
Financing live
Cash to close
- Down payment
- $81,250
- Closing costs
- $9,750
- Reserves months
- —
- Total cash needed
- —
Loan-product check · same deal, 3 products live
Conventional
25% down · 7.5% · 30yr
- Down + closing
- —
- Monthly P&I
- —
- Monthly cashflow
- —
- DSCR
- —
- Eligible?
- —
Personal DTI + credit; lowest rate.
DSCR
20% down · 8.5% · 30yr
- Down + closing
- —
- Monthly P&I
- —
- Monthly cashflow
- —
- DSCR
- —
- Eligible?
- —
No personal income docs; deal must DSCR.
Hard money
10% down · 12.0% · 12mo
- Down + closing
- —
- Monthly P&I
- —
- Monthly cashflow
- —
- DSCR
- —
- Eligible?
- —
Short-term bridge; refi at stabilization.
Rent comps 7 comps
| Address | Beds | Baths | Sqft | Rent | $/sqft | DOM | Units | Dist |
|---|---|---|---|---|---|---|---|---|
| 1288 E Agape Ave San Jacinto, CA | 4.0 | 3.0 | 2144 | $2,800 | $1.31 | 44d | 1 | 0.93mi |
| 2143 Wente Ct San Jacinto, CA | 4.0 | 2.5 | 1992 | $3,000 | $1.51 | 25d | 1 | 1.09mi |
| 310 S Carmalita St Hemet, CA | 3.0 | 2.0 | 2100 | $3,200 | $1.52 | 44d | 1 | 1.22mi |
| 1745 Gooseberry Ln San Jacinto, CA | 5.0 | 3.0 | 2403 | $3,500 | $1.46 | 44d | 1 | 1.30mi |
| 727 Chardonnay Pl Hemet, CA | 4.0 | 2.0 | 2328 | $2,850 | $1.22 | 0d | 1 | 1.30mi |
| 739 Chardonnay Pl Hemet, CA | 4.0 | 2.0 | 2399 | $2,850 | $1.19 | 0d | 1 | 1.31mi |
| 1873 Villines Ave San Jacinto, CA | 4.0 | 2.0 | 2553 | $2,850 | $1.12 | 5d | 1 | 1.41mi |
Listing history 23 events
-
2026-05-11status Pending
-
2026-04-22historical Backup Offers Accepted
-
2026-02-16$325,000 Active
-
2023-01-26soldstatus $300,000 Sold 505-char remark
Show marketing remark (505 chars)
Opportunity Knocks! Investors dream property located in Hemet! 291 N Yale St offers a rare and unique opportunity with endless potential to renovate or completely remodel - perfect for an owner/user or investor! Per title - the property is comprised of 2,820 sqft and features 4 bedrooms, 4 bathrooms and is situated on a large 12,632 sqft corner lot with possible ADU potential. This property has everything you need to inspire your dream renovation, nearby trendy shops, cafes, restaurants, and schools!
-
2022-11-03historical Backup Offers Accepted 505-char remark
Show marketing remark (505 chars)
Opportunity Knocks! Investors dream property located in Hemet! 291 N Yale St offers a rare and unique opportunity with endless potential to renovate or completely remodel - perfect for an owner/user or investor! Per title - the property is comprised of 2,820 sqft and features 4 bedrooms, 4 bathrooms and is situated on a large 12,632 sqft corner lot with possible ADU potential. This property has everything you need to inspire your dream renovation, nearby trendy shops, cafes, restaurants, and schools!
-
2022-08-23price $370,000 505-char remark
Show marketing remark (505 chars)
Opportunity Knocks! Investors dream property located in Hemet! 291 N Yale St offers a rare and unique opportunity with endless potential to renovate or completely remodel - perfect for an owner/user or investor! Per title - the property is comprised of 2,820 sqft and features 4 bedrooms, 4 bathrooms and is situated on a large 12,632 sqft corner lot with possible ADU potential. This property has everything you need to inspire your dream renovation, nearby trendy shops, cafes, restaurants, and schools!
-
2022-06-09$399,000 Active 505-char remark
Show marketing remark (505 chars)
Opportunity Knocks! Investors dream property located in Hemet! 291 N Yale St offers a rare and unique opportunity with endless potential to renovate or completely remodel - perfect for an owner/user or investor! Per title - the property is comprised of 2,820 sqft and features 4 bedrooms, 4 bathrooms and is situated on a large 12,632 sqft corner lot with possible ADU potential. This property has everything you need to inspire your dream renovation, nearby trendy shops, cafes, restaurants, and schools!
-
2019-02-21status Pending Sale
-
2019-02-21historical
-
2019-02-12$190,000 Active
-
2017-05-25soldstatus $175,000 Closed Sale
-
2017-05-24soldstatus $175,000
-
2017-03-30status Active Under Contract
-
2017-03-29historical Hold Do Not Show
-
2017-03-28status Active
-
2017-03-24$180,000 Active
-
2017-03-23historical Hold Do Not Show
-
2016-12-31historical
-
2016-12-06price $245,000
-
2016-10-08$259,000 Active
-
1998-09-28soldstatus $112,000
-
1995-07-12soldstatus $39,000
-
1981-06-17soldstatus $235,000
ⓘ Source: listings_history table (triggers on properties + properties_extension) + one-shot
backfill from property_details.listing_events for pre-trigger history.
Tax reassessment forecast CA · Resets to sale price
- Current annual tax
- $4,738 · $395/mo
- Projected year-2 tax
- $4,738 · $395/mo
- Expected delta
- $0/yr ($0/mo · 0.0%)
ⓘ Screening estimate from a state-policy table — verify with the county assessor before closing.
Climate risk First Street
- Flood 6/10 Major FEMA zone AH · 74% chance over 30 yrs
- Wildfire 2/10 Low
- Heat 8/10 Severe 7 d/yr ≥104°F today · 21 d/yr by 30 yrs out
- Wind 1/10 Low
- Air quality 6/10 Major 12 unhealthy d/yr today · 14 by 30 yrs out
Nearby sold comps map
Loading sold comps map…
Walkable amenities ~0.75 mi
Loading nearby amenities…
Taxation est. · year 1
- Rental income
- $36,621
- − Mortgage interest
- −$18,205
- − Property taxes
- −$4,738
- − Insurance
- −$3,450
- − Repairs & maintenance
- −$2,930
- − Management
- −$2,930
- − Depreciation
- −$9,455
- Taxable loss
- −$5,085
- Est. tax savings @ 24.0%
- +$1,220
- After-tax cash flow
- $1,512/yr
For passive investors: Depreciation is non-cash, so a rental often shows a tax loss while cash-flowing — sheltering income. Rental losses are passive: they offset passive income freely, and up to $25,000/yr can offset ordinary (W-2) income if you actively participate and your MAGI is under $100k (phasing out to $0 by $150k); unused losses carry forward. On sale, claimed depreciation is recaptured at up to 25%, and gains may owe capital-gains tax (a 1031 exchange can defer both). Figures are a year-1 estimate at your 24.0% rate — not tax advice; consult a CPA.
Schools (NCES district)
- District
- Hemet Unified
- NCES district ID
- 0616920
- Math proficiency
- 19% ▼ -3.00%
- Reading proficiency
- 41% ▲ 4.00%
- Median HH income
- $39,962
- Composite
- 25.16/100
- National rank
- #7517
- State rank
- #360 of 517 in CA
Livability — Hemet
- Score
- 51/100
- State rank
- #1056
- US rank
- #25208
Category grades
Schools grade is shown separately in the Schools card above.
Census & demographics
- Census place
- Hemet, CA
- County
- Riverside County · 2,287,001 people
- City population
- 137,670
- Metro
- Riverside-San Bernardino-Ontario, CA
- Population (ZIP)
- 51,751
- Household income
- $73,596
- Rent vs Own
- Severe rent burden
- 1518.0
Population outlook (Riverside County) Hauer SSP2
- Today (2025)
- 2,664,475 people
- By 2030
- 2,802,692 · +5.2%
- By 2040
- 3,050,904 · +14.5%
- By 2050
- 3,256,783 · +22.2%
- By 2075
- 3,655,058 · +37.2%
- By 2100
- 3,766,594 · +41.4%
Race, ethnicity, and origin ACS 2023
- Neighborhood character
- Diverse neighborhood (Simpson 0.59)
- Race & ethnicity
- Hispanic / Latino 49% White 40% Two or more races 18% Black 5% Asian 3% Native American 2%
- Hispanic origin (detail)
- Mexican 43% Puerto Rican 1%
- Common ancestry
- Slovak 2% Italian 2% Portuguese 2%
- Foreign-born
- 15% · Canada, China
- Languages at home
- 70% English-only · Spanish 27% Other Asian/Pacific 1% Other Indo-European 1%
Political lean MEDSL · Riverside
- 2024 margin
- Toss-up / Even · D 48.0% · R 49.3% · Other 2.6%
- 2008→2024 swing
- -3.6pp toward R · 2008: 2.3pp · 2024: -1.3pp
- All cycles
- 2024: R+1.3 2020: D+8.0 2016: D+4.3 2012: R+0.4 2008: D+2.3
Not yet ingested
- Civics
- —
Market trends
- HPI YoY
- ▼ -219.06%
- Current HPI
- 391.972
- Rent YoY
- ▲ 4.90%
- Metro
- Riverside-San Bernardino-Ontario, CA
- State GDP YoY
- ▲ 3.21%
- F500 in state
- 116
Industry mix (Fortune 500 HQ in CA)
| Industry | F500 HQs | Revenue |
|---|---|---|
| Technology | 27 | $1,492B |
|
||
| Financial Services | 3 | $174B |
|
||
| Retail | 3 | $44B |
|
||
| Insurance | 3 | $26B |
|
||
| Media / Entertainment | 2 | $115B |
|
||
| Pharmaceuticals / Biotech | 2 | $62B |
|
||
Price history
+38.3% since first listed23 events — show timeline
- 2026-05-11 Pending — TheMLS
- 2026-04-22 Contingent — TheMLS
- 2026-02-16 Listed $325,000 TheMLS
- 2023-01-26 Sold (MLS) $300,000 TheMLS
- 2022-11-03 Contingent — TheMLS
- 2022-08-23 Price Changed $370,000 TheMLS
- 2022-06-09 Listed $399,000 TheMLS
- 2019-02-21 Pending — CRMLS
- 2019-02-21 Listing Removed — CRMLS
- 2019-02-12 Listed $190,000 CRMLS
- 2017-05-25 Sold (MLS) $175,000 CRMLS
- 2017-05-24 Sold (Public Records) $175,000 Public Records
- 2017-03-30 Relisted — CRMLS
- 2017-03-29 Delisted — CRMLS
- 2017-03-28 Relisted — CRMLS
- 2017-03-24 Listed $180,000 CRMLS
- 2017-03-23 Delisted — CRMLS
- 2016-12-31 Listing Removed — CRMLS
- 2016-12-06 Price Changed $245,000 CRMLS
- 2016-10-08 Listed $259,000 CRMLS
- 1998-09-28 Sold (Public Records) $112,000 Public Records
- 1995-07-12 Sold (Public Records) $39,000 Public Records
- 1981-06-17 Sold (Public Records) $235,000 Public Records
Property tax history
+4.8%/yrLatest (2025): $4,738 · +2.0% YoY. Source: county tax records.
Cash-flow waterfall
monthlySold comps — $/sqft
last 12 mo · ≤1 miLoading sold comps…