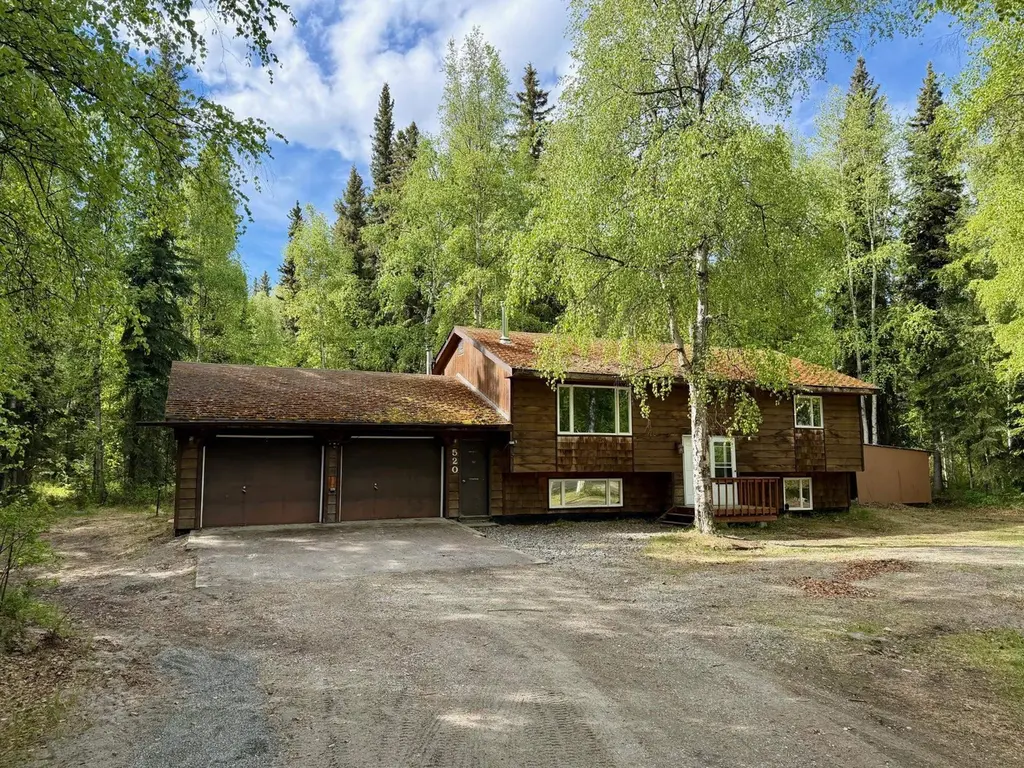
520 S Evolyn Dr · North Pole, AK
Flood risk 1/10 · Minimal
- FEMA flood zone
- X (unshaded)
- Chance of flooding over 30 yrs
- 0.0%
- Est. flood insurance / yr
- $473 – $860
Fire risk No data
- Est. fire insurance / yr
- —
Heat risk No data
- Hot days now (above threshold)
- —
- Hot days in 30 yrs
- —
Wind risk No data
- Chance of severe wind over 30 yrs
- —
Air-quality risk 1/10 · Minimal
- Unhealthy air days now
- —
- Unhealthy air days in 30 yrs
- —
Risk factors via First Street. Map © Google.
Why this score? — see what drove the C+ grade
The composite is a weighted blend of 9 inputs, each scored 0–100. Each bar is that input's sub-score; the figure is the points it added to the 100-point composite (weight × sub-score).
- Cash flow +20.8/30.0
- ARV discount +15.0/15.0
- DSCR +6.6/10.0
- 1% rule +5.5/10.0
- Rent growth +3.8/5.0
- Schools +3.6/10.0
- Livability +3.4/5.0
- Condition / age +2.5/5.0
- Appreciation +0.0/10.0
$295,000
🖨 Deal sheet 📄 Offer letter ✓ Due diligence
Listing remarks
Sweat equity alert! Incredible opportunity to turn this 5 bedroom, 2 bath, 2 car garage home in an established, desirable North Pole neighborhood into your dream home. Home is 2x6 construction, has a concrete block foundation and vinyl windows. Heating system is relatively newer and is functioning. Home is sold AS-IS, no repairs will be done. Home will not qualify for FHA or VA. Cash buyers strongly preferred. Home sale is part of a 1031 tax-deferred exchange.
Key facts
- 0.93 acre lot
- 2 garage spots
- Built 1979
Property features AI
Exterior
- Parking: Attached 2-car garage
- Utilities: Private well water
- Home design: Residential single-family home; Zoned for two-family residential district
- Exterior features: Shingle roof
Interior
- Kitchen: Dishwasher; Oven; Range; Refrigerator
- Flooring: Laminate flooring
- Bathrooms: 2 full bathrooms
- Heating & cooling: Oil heating; Baseboard heating
- Interior features: Dishwasher; Oven; Range; Refrigerator
Neighborhood map
What this means for you Summary
Snapshot
- This is a 5-bed/2.0-bath single-family listed at $295k.
Deal economics
- At list price, monthly cash flow is $404 ($5k/yr) — positive.
- The deal already cash-flows at list — no discount required.
- Meets the 1% rule at list price ($3k rent vs $295k).
- Recommended offer: $291k (1.5% below list) — sets the bar for market timing.
- Cap rate 7.9% vs local median 3.7% in North Pole — top-decile yield for the area; either an underpriced asset or a hidden risk that comps aren't pricing in. Stress-test before assuming the spread holds.
Location & tenants
- Location reads 67/100 on livability (#22 in AK) — a middle-class / working-renter tenant base. Strengths: housing A+, employment A-, health & safety A-; Watch: amenities F, commute F.
- Fairbanks North Star Borough School District (urban): math 33% / reading 45% proficiency, ranked #10 of 21 in AK (top 48%) — families likely to look elsewhere, expect single-tenant / working-renter base with shorter leases.
- Zoned schools: North Pole Elementary (math 32% / reading 37%, grade F, #93 of 156 statewide, top 66%, 347 students, 37% FRL); North Pole Middle School (math 25% / reading 45%, grade F, #21 of 36 statewide, top 57%, 531 students, 39% FRL); North Pole High School (math 32% / reading 32%, grade F, #33 of 61 statewide, top 57%, 617 students, 29% FRL).
- Market conditions: Rents rising fast (+5.1%/yr); 248 active listings in the ZIP; 1 comparable units currently listed for rent nearby; solid renter incomes; 1 units permitted in Fairbanks North Star Borough in 2024 (0 in 5+ unit buildings).
- This rent runs 38% of the median local income ($97k/yr) — at the standard rent-burdened threshold; future hikes will face affordability resistance.
Forward outlook
- Local home prices are declining (-3.0%/yr); year-one equity from $2k of loan paydown is wiped out by about $9k of value loss. Plan a longer hold.
- Fairbanks North Star County population projected at +6% by 2050 — modest demand growth; plan on rents tracking national, not racing it.
Negotiation context
- It's been on market 16 days — a 2% lower offer ($291k) is reasonable based on typical stale-listing flexibility.
Questions for the listing agent
- Built in 1979 — when were the roof, HVAC, electrical panel, plumbing, and water heater last replaced?
- Is there a deadline driving the sale (1031 exchange, divorce, estate, relocation)? That informs how much negotiation room exists.
- Schools are D-rated, which usually means shorter tenancies and higher turnover. Who's the typical renter profile here, and what's been the actual vacancy rate?
- What's the average days-on-market for RENTAL listings here right now (not sales)? A rising rental-DOM trend means longer vacancies and softer asking-rent achievability than the comps imply.
- What's the recent tenant-quality profile in this submarket — average credit score on applications, eviction rate, late-payment / NSF rate, and stable-employment percentage? A property-management company in the area should have these aggregated.
- How much new for-sale + rental construction is in the pipeline within 1–3 miles? Heavy new supply typically softens prices + rents 12–24 months out; constrained supply supports both.
Investment metrics
- 1% rule
- 1.05% ✓
- Cap rate
- 7.94%
- Cash-on-cash
- 5.87%
- DSCR
- 1.26
- GRM
- 7.9
CMA / ARV
- ARV (on-the-fly)
- $417,900
- Comps found
- 9
Show comp detail 9 sales within ~0.75 mi
| Address | Dist | Beds/Ba | Sqft | Sold | Price | $/sf | Match |
|---|---|---|---|---|---|---|---|
| 1001 Blanket Blvd | 0.10mi | 4/2.0 (-1) | 2,190 (+4%) | 14mo | $450,000 | $205 | 71 |
| 1003 Shirley Turnaround | 0.35mi | 4/2.0 (-1) | 2,232 (+6%) | 4mo | $444,900 | $199 | 65 |
| 545 Beaver Blvd | 0.35mi | 4/2.0 (-1) | 2,080 (-1%) | 23mo | $350,000 | $168 | 58 |
| 1224 North Star Dr | 0.57mi | 4/3.0 (-1) | 1,920 (-9%) | 2mo | $400,000 | $208 | 48 |
| 3053 Psalms Blvd | 0.66mi | 4/2.5 (-1) | 2,236 (+6%) | 6mo | $529,900 | $237 | 46 |
| 2590 Lana Turnabout | 0.72mi | 5/2.0 | 2,262 (+8%) | 10mo | $415,000 | $183 | 46 |
| 3191 Kris Kringle Dr | 0.56mi | 4/2.5 (-1) | 2,272 (+8%) | 10mo | $424,900 | $187 | 45 |
| 3210 Wyatt Rd | 0.72mi | 4/3.0 (-1) | 1,862 (-11%) | 1mo | $426,200 | $229 | 38 |
| 3210 Kris Kringle Dr | 0.62mi | 5/2.0 | 2,352 (+12%) | 18mo | $399,900 | $170 | 35 |
Match score weights: distance 35% · size 25% · config 20% · recency 20%. Top-matched comps best support the ARV.
Projected returns pro-forma
-3.0% appreciation · 5.08% rent growth · sell at horizon
- IRR
- -4.9%
- Equity multiple
- 0.81×
- Total profit
- $-15,358
- Equity at exit
- $43,985
- IRR
- 7.1%
- Equity multiple
- 1.59×
- Total profit
- $48,438
- Equity at exit
- $25,506
Cash invested: $82,600 (down + closing). Projections, not guarantees.
Landlord ↔ Tenant lean methodology
- Overall (STATE)
- 80 Strongly Landlord-Friendly
- State Alaska
- 80 Strongly Landlord-Friendly · R+8
- County
- — inherits STATE
- City
- — inherits STATE
ZIP-level market 99705
- Home prices YoY
- -21.2%
- Rents YoY
- 5.1%
- Active inventory
- 248
- Price-to-rent
- 7.9×
Monthly cashflow live
- Estimated rent
- $3,108 medium interval (Pro) →
- Mortgage (P&I)
- −$1,547
- Tax from tax record
- −$381 /mo · $4,578/yr
- Insurance
- −$123
- HOA
- −$0
- Vacancy / Maint / Mgmt
- −$653
- Net cashflow
- $404
Break-even live
UW: 25.0% down · 7.5% · 30yr · 1.5% tax · 5.0% vac · 8.0% maint · 8.0% mgmt
Financing live
Cash to close
- Down payment
- $73,750
- Closing costs
- $8,850
- Reserves months
- —
- Total cash needed
- —
Loan-product check · same deal, 3 products live
Conventional
25% down · 7.5% · 30yr
- Down + closing
- —
- Monthly P&I
- —
- Monthly cashflow
- —
- DSCR
- —
- Eligible?
- —
Personal DTI + credit; lowest rate.
DSCR
20% down · 8.5% · 30yr
- Down + closing
- —
- Monthly P&I
- —
- Monthly cashflow
- —
- DSCR
- —
- Eligible?
- —
No personal income docs; deal must DSCR.
Hard money
10% down · 12.0% · 12mo
- Down + closing
- —
- Monthly P&I
- —
- Monthly cashflow
- —
- DSCR
- —
- Eligible?
- —
Short-term bridge; refi at stabilization.
Rent comps 1 comps
| Address | Beds | Baths | Sqft | Rent | $/sqft | DOM | Units | Dist |
|---|---|---|---|---|---|---|---|---|
| 3041 Timberbrook Dr North Pole, AK | 5.0 | 3.0 | 2220 | $3,600 | $1.62 | 43d | 1 | 1.26mi |
Listing history 12 events
-
2026-06-19days on market $295,000 Active 16 DOM
-
2026-06-18days on market $295,000 Active 15 DOM
-
2026-06-17days on market $295,000 Active 14 DOM
-
2026-06-16days on market $295,000 Active 13 DOM
-
2026-06-15days on market $295,000 Active 12 DOM
-
2026-06-14days on market $295,000 Active 10 DOM
-
2026-06-13days on market $295,000 Active 9 DOM
-
2026-06-10days on market $295,000 Active 7 DOM
-
2026-06-09days on market $295,000 Active 6 DOM
-
2026-06-08days on market $295,000 Active 5 DOM
-
2026-06-03remarks 465-char remark
-
2026-06-03$295,000 Active 1 DOM
ⓘ Source: listings_history table (triggers on properties + properties_extension) + one-shot
backfill from property_details.listing_events for pre-trigger history.
Tax reassessment forecast AK · Partial reset (capped growth)
- Current annual tax
- $4,578 · $381/mo
- Projected year-2 tax
- $4,578 · $381/mo
- Expected delta
- $0/yr ($0/mo · 0.0%)
ⓘ Screening estimate from a state-policy table — verify with the county assessor before closing.
Climate risk First Street
- Flood 1/10 Low FEMA zone X (unshaded) · 0% chance over 30 yrs
- Air quality 1/10 Low
Nearby sold comps map
Loading sold comps map…
Walkable amenities ~0.75 mi
Loading nearby amenities…
Taxation est. · year 1
- Rental income
- $37,302
- − Mortgage interest
- −$16,525
- − Property taxes
- −$4,578
- − Insurance
- −$1,475
- − Repairs & maintenance
- −$2,984
- − Management
- −$2,984
- − Depreciation
- −$8,582
- Taxable income
- $174
- Est. tax owed @ 24.0%
- −$42
- After-tax cash flow
- $4,810/yr
For passive investors: Depreciation is non-cash, so a rental often shows a tax loss while cash-flowing — sheltering income. Rental losses are passive: they offset passive income freely, and up to $25,000/yr can offset ordinary (W-2) income if you actively participate and your MAGI is under $100k (phasing out to $0 by $150k); unused losses carry forward. On sale, claimed depreciation is recaptured at up to 25%, and gains may owe capital-gains tax (a 1031 exchange can defer both). Figures are a year-1 estimate at your 24.0% rate — not tax advice; consult a CPA.
Schools (NCES district)
- District
- Fairbanks North Star Borough School District
- NCES district ID
- 0200600
- Math proficiency
- 33% ▼ -6.00%
- Reading proficiency
- 45% ▲ 3.00%
- Median HH income
- $69,697
- Composite
- 35.5/100
- National rank
- #4915
- State rank
- #10 of 21 in AK
Livability — North Pole
- Score
- 67/100
- State rank
- #22
- US rank
- #10245
Category grades
Schools grade is shown separately in the Schools card above.
Census & demographics
- Census place
- North Pole, AK
- County
- Fairbanks North Star Borough · 69,381 people
- City population
- 21,769
- Metro
- Fairbanks, AK
- Population (ZIP)
- 21,769
- Household income
- $96,964
- Rent vs Own
- Severe rent burden
- 237.0
Population outlook (Fairbanks North Star County) Hauer SSP2
- Today (2025)
- 101,607 people
- By 2030
- 102,796 · +1.2%
- By 2040
- 104,748 · +3.1%
- By 2050
- 107,598 · +5.9%
- By 2075
- 118,829 · +16.9%
- By 2100
- 127,151 · +25.1%
Race, ethnicity, and origin ACS 2023
- Neighborhood character
- Predominantly White (75%)
- Race & ethnicity
- White 75% Two or more races 12% Hispanic / Latino 7% Native American 4% Black 1% Asian 1%
- Hispanic origin (detail)
- Mexican 5% Puerto Rican 1%
- Common ancestry
- Italian 4% Portuguese 3% Scottish 3%
- Foreign-born
- 4% · Canada, South Korea
- Languages at home
- 93% English-only · French/Haitian/Cajun 1% Spanish 1% Tagalog/Filipino 1%
Political lean MEDSL · Fairbanks North Star
- 2016 margin
- R (+15.2) · D 37.7% · R 52.9% · Other 9.4%
- All cycles
- 2016: R+15.2
Not yet ingested
- Civics
- —
Market trends
- HPI YoY
- ▼ -42.32%
- Current HPI
- 157.102
- Rent YoY
- ▲ 5.08%
- Metro
- Fairbanks, AK
- State GDP YoY
- —
- F500 in state
- 0
Price history
2 events — show timeline
- 2026-06-03 Listed $295,000 GFBR
- 2007-05-31 Sold (Public Records) — Public Records
Property tax history
+3.7%/yrLatest (2025): $4,578 · +4.9% YoY. Source: county tax records.
Cash-flow waterfall
monthlySold comps — $/sqft
last 12 mo · ≤1 miLoading sold comps…