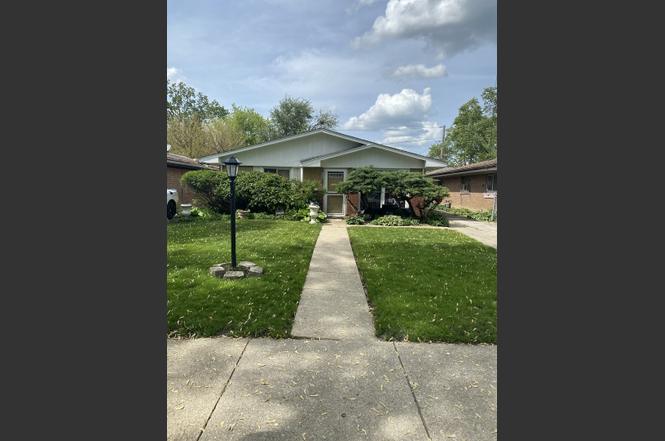
1521 E 13th Pl · Ford Heights, IL
Flood risk 1/10 · Minimal
- FEMA flood zone
- X (unshaded)
- Chance of flooding over 30 yrs
- 0.0%
- Est. flood insurance / yr
- $473 – $860
Fire risk 1/10 · Minimal
- Est. fire insurance / yr
- $804 – $1,492
Heat risk 3/10 · Minor
- Hot days now (above 101°F)
- 7 days/yr
- Hot days in 30 yrs
- 15 days/yr
Wind risk 2/10 · Minimal
- Chance of severe wind over 30 yrs
- 0.0%
Air-quality risk 2/10 · Minimal
- Unhealthy air days now
- 2 days/yr
- Unhealthy air days in 30 yrs
- 2 days/yr
Risk factors via First Street. Map © Google.
Why this score? — see what drove the B+ grade
The composite is a weighted blend of 9 inputs, each scored 0–100. Each bar is that input's sub-score; the figure is the points it added to the 100-point composite (weight × sub-score).
- Cash flow +30.0/30.0
- ARV discount +15.0/15.0
- 1% rule +10.0/10.0
- DSCR +10.0/10.0
- Rent growth +4.1/5.0
- Livability +3.2/5.0
- Condition / age +2.5/5.0
- Schools +0.7/10.0
- Appreciation +0.0/10.0
$99,500
🖨 Deal sheet 📄 Offer letter ✓ Due diligence
Listing remarks
COME ON! Take a LOOK! Very affordable Solid all brick 3 bd, 1 ba RANCH HOUSE. The bathroom needs to be refreshed and updated. Some rooms are freshly painted, bedrooms are newly carpeted and new vinyl flooring in the living room. New bedroom doors. Spacious front and back yard with shed for storage (no garage). House is 5 min. away from IL HWY 394 for fast and convenient commute. The house is on the outskirts of the village. The seller made some repairs. SOLD AS-IS. Please present PRE-APPROVED BUYERS /INVESTORS ONLY! Seller is VERY MOTIVATED. This one is cheaper than rent. Could be a great investment property with a good ROI.
Key facts
- Shed for storage
- All brick
- 0.36 acre lot
Tags
Property features AI
Finance
- Other: School bus service and commuter bus access
- HOA & community: No master association fee required
Exterior
- Parking: Two parking spaces total; Side driveway and driveway parking
- Utilities: Public water; Public sewer
- Home design: Detached single-family home; One-story; Fee simple ownership
- Construction: Brick construction; Asphalt roof; Concrete perimeter foundation; Built 51–60 years ago; Built before 1978
- Exterior features: Fenced yard; Park nearby; Paved streets
Interior
- Kitchen: Main-level kitchen (approx. 10 x 10)
- Bedrooms: Three bedrooms on the main level (approx. 10 x 11; 10 x 12; 10 x 10)
- Flooring: Carpet in living room
- Bathrooms: One full bathroom
- Heating & cooling: Natural gas heat; Central air conditioning
- Interior features: Five total rooms; Living room (main level)
- Laundry & utility: Main-level laundry closet (approx. 6 x 8)
Neighborhood map
What this means for you Summary
Snapshot
- This is a 3-bed/1.0-bath single-family listed at $100k.
Deal economics
- At list price, monthly cash flow is $607 ($7k/yr) — positive.
- The deal already cash-flows at list — no discount required.
- Meets the 1% rule at list price ($2k rent vs $100k).
- Recommended offer: $88k (12.0% below list) — sets the bar for market timing.
Location & tenants
- Location reads 64/100 on livability (#685 in IL) — a middle-class / working-renter tenant base. Strengths: commute A+, cost of living A+, crime A-; Watch: schools F, amenities F, employment F.
- Bloom Twp Hsd 206 (suburban): math 8% / reading 9% proficiency, ranked #591 of 620 in IL (top 95%) — low school quality limits family demand, transient renter base, plan for 1-2y turnover.
- Market conditions: Rents rising fast (+6.5%/yr); 222 active listings in the ZIP; 3 comparable units currently listed for rent nearby; rentals leasing fast (median 2d on market — plan ~1-2 weeks tenant-placement turnaround); 6,272 units permitted in Cook County in 2024 (4,658 in 5+ unit buildings).
- This rent runs 33% of the median local income ($62k/yr) — at the standard rent-burdened threshold; future hikes will face affordability resistance.
Forward outlook
- Local home prices are declining (-3.0%/yr); year-one equity from $688 of loan paydown is wiped out by about $3k of value loss. Plan a longer hold.
- At projected returns (-3.0% appreciation + 6.5% rent growth), your $28k cash investment doubles in ~5 years — after that, you're playing with house money.
Negotiation context
- It's been on market 216 days — a 12% lower offer ($88k) is reasonable based on typical stale-listing flexibility.
- 6 sale attempts; this cycle's ask is 4% above the opening price — seller raised mid-cycle; expect resistance to lowballs.
Questions for the listing agent
- It's been on market 216 days. Have you received any prior offers? Is the seller open to a 12% concession, seller financing, or rate buy-down credit?
- Built in 1970 — when were the roof, HVAC, electrical panel, plumbing, and water heater last replaced?
- Why hasn't it sold? Are there any deal-killer items the seller is aware of (foundation, flood, title, zoning, code violations)?
- Is there a deadline driving the sale (1031 exchange, divorce, estate, relocation)? That informs how much negotiation room exists.
- Schools are F-rated, which usually means shorter tenancies and higher turnover. Who's the typical renter profile here, and what's been the actual vacancy rate?
- What's the average days-on-market for RENTAL listings here right now (not sales)? A rising rental-DOM trend means longer vacancies and softer asking-rent achievability than the comps imply.
- What's the recent tenant-quality profile in this submarket — average credit score on applications, eviction rate, late-payment / NSF rate, and stable-employment percentage? A property-management company in the area should have these aggregated.
- How much new for-sale + rental construction is in the pipeline within 1–3 miles? Heavy new supply typically softens prices + rents 12–24 months out; constrained supply supports both.
Investment metrics
- 1% rule
- 1.73% ✓
- Cap rate
- 13.61%
- Cash-on-cash
- 26.14%
- DSCR
- 2.16
- GRM
- 4.8
CMA / ARV
- ARV (on-the-fly)
- $128,139
- Comps found
- 8
Show comp detail 8 sales within ~0.75 mi
| Address | Dist | Beds/Ba | Sqft | Sold | Price | $/sf | Match |
|---|---|---|---|---|---|---|---|
| 1444 Park Ln | 0.22mi | 4/1.5 (+1) | 1,100 (+4%) | 11mo | $155,000 | $141 | 67 |
| 1420 E 15th St | 0.28mi | 3/1.0 | 936 (-12%) | 1mo | $44,000 | $47 | 66 |
| 1403 15th St | 0.31mi | 3/2.0 | 1,144 (+8%) | 6mo | $138,000 | $121 | 63 |
| 1449 Park Ln | 0.19mi | 4/1.5 (+1) | 1,150 (+9%) | 11mo | $172,000 | $150 | 61 |
| 1529 Ambassador Ln | 0.29mi | 4/2.0 (+1) | 1,000 (-6%) | 10mo | $152,000 | $152 | 60 |
| 1407 E 15th St | 0.34mi | 2/1.5 (-1) | 1,036 (-2%) | 18mo | $70,000 | $68 | 59 |
| 1124 Seeley Ave | 0.61mi | 2/1.0 (-1) | 1,146 (+8%) | 7mo | $35,000 | $31 | 47 |
| 1126 Seeley Ave | 0.61mi | 3/1.0 | 1,202 (+14%) | 24mo | $95,000 | $79 | 29 |
Match score weights: distance 35% · size 25% · config 20% · recency 20%. Top-matched comps best support the ARV.
Projected returns pro-forma
-3.0% appreciation · 6.48% rent growth · sell at horizon
- IRR
- 24.0%
- Equity multiple
- 2.04×
- Total profit
- $28,854
- Equity at exit
- $14,836
- IRR
- 34.1%
- Equity multiple
- 4.69×
- Total profit
- $102,750
- Equity at exit
- $8,603
Cash invested: $27,860 (down + closing). Projections, not guarantees.
Landlord ↔ Tenant lean methodology
- Overall (STATE)
- 43 Moderately Tenant-Leaning
- State Illinois
- 43 Moderately Tenant-Leaning · D+7
- County
- — inherits STATE
- City
- — inherits STATE
ZIP-level market 60411
- Home prices YoY
- -33.9%
- Rents YoY
- 6.5%
- Active inventory
- 222
- Price-to-rent
- 4.8×
Monthly cashflow live
- Estimated rent
- $1,726 medium interval (Pro) →
- Mortgage (P&I)
- −$522
- Tax from tax record
- −$194 /mo · $2,322/yr
- Insurance
- −$41
- HOA
- −$0
- Vacancy / Maint / Mgmt
- −$362
- Net cashflow
- $607
Break-even live
UW: 25.0% down · 7.5% · 30yr · 1.5% tax · 5.0% vac · 8.0% maint · 8.0% mgmt
Financing live
Cash to close
- Down payment
- $24,875
- Closing costs
- $2,985
- Reserves months
- —
- Total cash needed
- —
Loan-product check · same deal, 3 products live
Conventional
25% down · 7.5% · 30yr
- Down + closing
- —
- Monthly P&I
- —
- Monthly cashflow
- —
- DSCR
- —
- Eligible?
- —
Personal DTI + credit; lowest rate.
DSCR
20% down · 8.5% · 30yr
- Down + closing
- —
- Monthly P&I
- —
- Monthly cashflow
- —
- DSCR
- —
- Eligible?
- —
No personal income docs; deal must DSCR.
Hard money
10% down · 12.0% · 12mo
- Down + closing
- —
- Monthly P&I
- —
- Monthly cashflow
- —
- DSCR
- —
- Eligible?
- —
Short-term bridge; refi at stabilization.
Rent comps 3 comps
| Address | Beds | Baths | Sqft | Rent | $/sqft | DOM | Units | Dist |
|---|---|---|---|---|---|---|---|---|
| 2241 Astor St Unit Labs Sauk Village, IL | 2.0 | 2.0 | 1000 | $1,650 | $1.65 | 2d | 1 | 1.01mi |
| 21538 Gailine Ave Chicago Heights, IL | 3.0 | 1.0 | 1031 | $1,600 | $1.55 | 3d | 1 | 1.08mi |
| 1154 Barry Ln Sauk Village, IL | 2.0 | 2.0 | 960 | $1,550 | $1.61 | 1d | 1 | 1.09mi |
Listing history 28 events
-
2026-06-18days on market $99,500 Active 216 DOM
-
2026-06-17days on market $99,500 Active 215 DOM
-
2026-06-16days on market $99,500 Active 214 DOM
-
2026-06-15days on market $99,500 Active 213 DOM
-
2026-06-13remarks 634-char remark
-
2026-06-13days on market $99,500 Active 211 DOM
-
2026-06-13days on market $99,500 Active 210 DOM
-
2026-06-09days on market $99,500 Active 207 DOM
-
2026-06-08days on market $99,500 Active 206 DOM
-
2026-06-07days on market $99,500 Active 205 DOM
-
2026-06-04days on market $99,500 Active 202 DOM
-
2026-06-03days on market $99,500 Active 201 DOM
-
2026-06-02days on market $99,500 Active 200 DOM
-
2026-06-01days on market $99,500 Active 199 DOM
-
2026-05-31days on market $99,500 Active 198 DOM
-
2026-04-21price $105,000
-
2026-02-09status Active
-
2026-02-04status Temporarily No Showings
-
2026-02-02historical
-
2025-12-10historical
-
2025-12-09status Temporarily No Showings
-
2025-12-03historical
-
2025-12-03status Temporarily No Showings
-
2025-05-24historical
-
2025-04-26price $89,900
-
2025-03-23status Active
-
2025-02-15historical
-
2025-01-20$95,900 Active
ⓘ Source: listings_history table (triggers on properties + properties_extension) + one-shot
backfill from property_details.listing_events for pre-trigger history.
Tax reassessment forecast IL · Partial reset (capped growth)
- Current annual tax
- $2,322 · $194/mo
- Projected year-2 tax
- $2,322 · $194/mo
- Expected delta
- $0/yr ($0/mo · 0.0%)
ⓘ Screening estimate from a state-policy table — verify with the county assessor before closing.
Climate risk First Street
- Flood 1/10 Low FEMA zone X (unshaded) · 0% chance over 30 yrs
- Wildfire 1/10 Low
- Heat 3/10 Moderate 7 d/yr ≥101°F today · 15 d/yr by 30 yrs out
- Wind 2/10 Low 0% chance of damaging wind over 30 yrs
- Air quality 2/10 Low 2 unhealthy d/yr today · 2 by 30 yrs out
Nearby sold comps map
Loading sold comps map…
Walkable amenities ~0.75 mi
Loading nearby amenities…
Taxation est. · year 1
- Rental income
- $20,714
- − Mortgage interest
- −$5,574
- − Property taxes
- −$2,322
- − Insurance
- −$498
- − Repairs & maintenance
- −$1,657
- − Management
- −$1,657
- − Depreciation
- −$2,895
- Taxable income
- $6,112
- Est. tax owed @ 24.0%
- −$1,467
- After-tax cash flow
- $5,816/yr
For passive investors: Depreciation is non-cash, so a rental often shows a tax loss while cash-flowing — sheltering income. Rental losses are passive: they offset passive income freely, and up to $25,000/yr can offset ordinary (W-2) income if you actively participate and your MAGI is under $100k (phasing out to $0 by $150k); unused losses carry forward. On sale, claimed depreciation is recaptured at up to 25%, and gains may owe capital-gains tax (a 1031 exchange can defer both). Figures are a year-1 estimate at your 24.0% rate — not tax advice; consult a CPA.
Schools (NCES district)
- District
- Bloom Twp Hsd 206
- NCES district ID
- 1706420
- Math proficiency
- 8% ▼ -3.00%
- Reading proficiency
- 9% ▼ -8.00%
- Median HH income
- $39,795
- Composite
- 7.4/100
- National rank
- #9952
- State rank
- #591 of 620 in IL
Livability — Ford Heights
- Score
- 64/100
- State rank
- #685
- US rank
- #13999
Category grades
Schools grade is shown separately in the Schools card above.
Census & demographics
- Census place
- Ford Heights, IL
- County
- Cook County · 4,486,803 people
- City population
- 52,395
- Metro
- Chicago-Naperville-Elgin, IL-IN-WI
- Population (ZIP)
- 52,175
- Household income
- $62,073
- Rent vs Own
- Severe rent burden
- 1714.0
Population outlook (Cook County) Hauer SSP2
- Today (2025)
- 5,347,519 people
- By 2030
- 5,357,703 · +0.2%
- By 2040
- 5,324,924 · -0.4%
- By 2050
- 5,230,762 · -2.2%
- By 2075
- 4,785,735 · -10.5%
- By 2100
- 4,188,836 · -21.7%
Race, ethnicity, and origin ACS 2023
- Neighborhood character
- Diverse neighborhood (Simpson 0.66)
- Race & ethnicity
- Black 49% Hispanic / Latino 26% White 19% Two or more races 11%
- Hispanic origin (detail)
- Mexican 22% Puerto Rican 2%
- Common ancestry
- Romanian 4% Portuguese 1% Lithuanian 1%
- Foreign-born
- 12% · Canada
- Languages at home
- 76% English-only · Spanish 21% Russian/Polish/Slavic 1% Other Indo-European 1%
Political lean MEDSL · Cook
- 2024 margin
- Solid D (+42.0) · D 70.4% · R 28.4% · Other 1.2%
- 2008→2024 swing
- -11.4pp toward R · 2008: 53.4pp · 2024: 42.0pp
- All cycles
- 2024: D+42.0 2020: D+50.3 2016: D+53.0 2012: D+49.4 2008: D+53.4
Not yet ingested
- Civics
- —
Market trends
- HPI YoY
- ▼ -108.75%
- Current HPI
- 212.4058
- Rent YoY
- ▲ 6.48%
- Metro
- Chicago-Naperville-Elgin, IL-IN-WI
- State GDP YoY
- ▲ 1.59%
- F500 in state
- 60
Industry mix (Fortune 500 HQ in IL)
| Industry | F500 HQs | Revenue |
|---|---|---|
| Insurance | 4 | $201B |
|
||
| Consumer Goods | 4 | $87B |
|
||
| Industrial Machinery | 3 | $64B |
|
||
| Healthcare | 2 | $55B |
|
||
| Retail / Pharmacy | 1 | $148B |
|
||
| Agriculture / Food | 1 | $86B |
|
||
Price history
+9.5% since first listed13 events — show timeline
- 2026-04-21 Price Changed $105,000 MRED as Distributed by MLS Grid
- 2026-02-09 Relisted — MRED as Distributed by MLS Grid
- 2026-02-04 Relisted — MRED as Distributed by MLS Grid
- 2026-02-02 Listing Removed — MRED as Distributed by MLS Grid
- 2025-12-10 Listing Removed — MRED as Distributed by MLS Grid
- 2025-12-09 Relisted — MRED as Distributed by MLS Grid
- 2025-12-03 Listing Removed — MRED as Distributed by MLS Grid
- 2025-12-03 Relisted — MRED as Distributed by MLS Grid
- 2025-05-24 Listing Removed — MRED as Distributed by MLS Grid
- 2025-04-26 Price Changed $89,900 MRED as Distributed by MLS Grid
- 2025-03-23 Relisted — MRED as Distributed by MLS Grid
- 2025-02-15 Listing Removed — MRED as Distributed by MLS Grid
- 2025-01-20 Listed $95,900 MRED as Distributed by MLS Grid
Property tax history
+9.7%/yrLatest (2022): $2,322 · +7.1% YoY. Source: county tax records.
Cash-flow waterfall
monthlySold comps — $/sqft
last 12 mo · ≤1 miLoading sold comps…