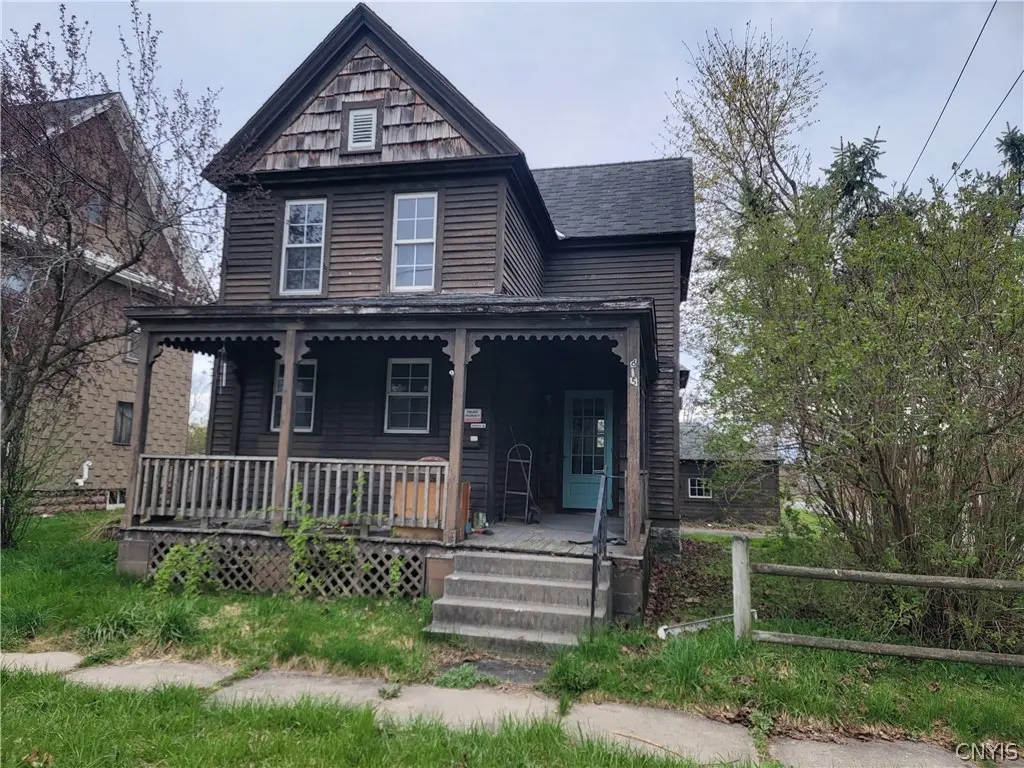
815 Anne St · Watertown, NY
Flood risk 10/10 · Severe
- FEMA flood zone
- X
- Chance of flooding over 30 yrs
- 0.99%
- Est. flood insurance / yr
- $473 – $860
Fire risk 3/10 · Minor
- Est. fire insurance / yr
- $691 – $1,283
Heat risk 2/10 · Minimal
- Hot days now (above 92°F)
- 7 days/yr
- Hot days in 30 yrs
- 15 days/yr
Wind risk 1/10 · Minimal
- Chance of severe wind over 30 yrs
- 0.0%
Air-quality risk 2/10 · Minimal
- Unhealthy air days now
- 1 days/yr
- Unhealthy air days in 30 yrs
- 1 days/yr
Risk factors via First Street. Map © Google.
Why this score? — see what drove the B+ grade
The composite is a weighted blend of 9 inputs, each scored 0–100. Each bar is that input's sub-score; the figure is the points it added to the 100-point composite (weight × sub-score).
- Cash flow +30.0/30.0
- ARV discount +15.0/15.0
- 1% rule +10.0/10.0
- DSCR +10.0/10.0
- Rent growth +5.0/5.0
- Schools +3.7/10.0
- Livability +3.4/5.0
- Condition / age +2.5/5.0
- Appreciation +0.0/10.0
$110,000
🖨 Deal sheet (PDF) 📄 Offer letter ✓ Due diligence
Listing remarks
Spacious Home with Renovation Potential – Opportunity to complete and customize this large home to suit your needs. Several updates have already been completed and many have been started, offering a solid foundation for finishing touches and improvements. The property includes three bedrooms boasting beautiful hardwood flooring and the potential for two full bathrooms. A first-floor full bath and laundry area are partially completed, while a second-floor bathroom has been taken down to the studs and is ready for redesign. Cabinets are on site and ready for installation in the large kitchen showcasing an immaculate tin ceiling. Additional features include a formal dining room with
Key facts
- 5,310 sq ft lot
- 2 garage spots
- Built 1900
Property features AI
Exterior
- Parking: Detached garage; 2-car garage
- Utilities: Public water connected; Sewer connected
- Home design: Two-story home; Existing construction
- Construction: Shake siding; Wood siding; Asphalt roof; Stone foundation
- Exterior features: Blacktop driveway; Near public transit; Rectangular residential lot; City street frontage
Interior
- Bedrooms: One bedroom on the main level
- Flooring: Hardwood flooring; Luxury vinyl flooring; Varied flooring types
- Bathrooms: Two full bathrooms; One full bathroom on the main level
- Heating & cooling: Gas forced-air heating
- Interior features: Den; Bathroom rough-in; Other interior features (see remarks); Bedroom on main level; Full basement
- Laundry & utility: Main-level laundry
Neighborhood map
What this means for you Summary
Snapshot
- This is a 4-bed/1.0-bath single-family listed at $110k.
Deal economics
- At list price, monthly cash flow is $578 ($7k/yr) — positive.
- The deal already cash-flows at list — no discount required.
- Meets the 1% rule at list price ($2k rent vs $110k).
- Recommended offer: $107k (3.0% below list) — sets the bar for market timing.
- Cap rate 13.2% vs local median 6.2% in Watertown — top-decile yield for the area; either an underpriced asset or a hidden risk that comps aren't pricing in. Stress-test before assuming the spread holds.
Location & tenants
- Location reads 68/100 on livability (#540 in NY) — a middle-class / working-renter tenant base. Strengths: health & safety A+, cost of living A-, housing A-; Watch: amenities C-, schools D, crime F.
- Watertown City School District (urban): math 34% / reading 54% proficiency, ranked #481 of 590 in NY (top 82%) — families likely to look elsewhere, expect single-tenant / working-renter base with shorter leases.
- Market conditions: Rents rising fast (+10.0%/yr); 223 active listings in the ZIP; 5 comparable units currently listed for rent nearby; rentals lingering (median 45d on market — plan ~5-8 weeks vacancy on turnover, expect pricing pressure); 100% of comp listings sitting > 30 days — soft ceiling on asking rent; 196 units permitted in Jefferson County in 2024 (0 in 5+ unit buildings).
- This rent runs 35% of the median local income ($59k/yr) — at the standard rent-burdened threshold; future hikes will face affordability resistance.
Forward outlook
- Local home prices are declining (-3.0%/yr); year-one equity from $761 of loan paydown is wiped out by about $3k of value loss. Plan a longer hold.
- Jefferson County population projected at -12% by 2050 — secular population decline; favor cash flow + early exit over multi-decade hold.
- At projected returns (-3.0% appreciation + 8.0% rent growth), your $31k cash investment doubles in ~5 years — after that, you're playing with house money.
Negotiation context
- It's been on market 46 days — a 3% lower offer ($107k) is reasonable based on typical stale-listing flexibility.
Risks & watch-outs
- Watch-outs: flood insurance adds $56/mo; built in 1900 — expect roof / HVAC / electrical / plumbing capex.
- Climate carrying-cost: severe flood risk — expect insurance premiums to compound above CPI over the hold.
Questions for the listing agent
- It's been on market 46 days. Have you received any prior offers? Is the seller open to a 3% concession, seller financing, or rate buy-down credit?
- Built in 1900 — when were the roof, HVAC, electrical panel, plumbing, and water heater last replaced?
- What's the actual annual flood-insurance premium (NFIP or private), and is the property in a SFHA with mandatory coverage?
- Is there a deadline driving the sale (1031 exchange, divorce, estate, relocation)? That informs how much negotiation room exists.
- Schools are D-rated, which usually means shorter tenancies and higher turnover. Who's the typical renter profile here, and what's been the actual vacancy rate?
- Crime grade is F in this area — have there been break-ins, vandalism, or insurance claims at this property in the last 3 years? What carrier currently insures it and at what premium?
- What's the average days-on-market for RENTAL listings here right now (not sales)? A rising rental-DOM trend means longer vacancies and softer asking-rent achievability than the comps imply.
- What's the recent tenant-quality profile in this submarket — average credit score on applications, eviction rate, late-payment / NSF rate, and stable-employment percentage? A property-management company in the area should have these aggregated.
- How much new for-sale + rental construction is in the pipeline within 1–3 miles? Heavy new supply typically softens prices + rents 12–24 months out; constrained supply supports both.
Investment metrics
- 1% rule
- 1.57% ✓
- Cap rate
- 13.20%
- Cash-on-cash
- 24.68%
- DSCR
- 2.10
- GRM
- 5.3
CMA / ARV
- ARV (median comp)
- $160,725
- List price
- $110,000
- Delta
- -31.56%
- Verdict
- UNDERPRICED
- Comps
- 20 within 1.0 mi
Show comp detail 12 sales within ~0.75 mi
| Address | Dist | Beds/Ba | Sqft | Sold | Price | $/sf | Match |
|---|---|---|---|---|---|---|---|
| 158 Cedar St | 0.44mi | 3/1.0 (-1) | 1,374 (-1%) | 1mo | $155,000 | $113 | 71 |
| 522 Frontenac St | 0.16mi | 3/1.0 (-1) | 1,296 (-7%) | 6mo | $142,500 | $110 | 71 |
| 509 Plum Ave | 0.11mi | 4/1.5 | 1,200 (-14%) | 4mo | $102,500 | $85 | 67 |
| 137 N Orchard St | 0.48mi | 3/1.0 (-1) | 1,410 (+1%) | 7mo | $153,700 | $109 | 65 |
| 660 Cooper St | 0.66mi | 4/1.0 | 1,417 (+2%) | 3mo | $132,900 | $94 | 64 |
| 857 Superior St | 0.21mi | 3/1.0 (-1) | 1,194 (-14%) | 1mo | $175,000 | $147 | 60 |
| 646 Cooper St | 0.66mi | 4/1.0 | 1,519 (+9%) | 2mo | $195,000 | $128 | 53 |
| 327 W Lynde St | 0.50mi | 3/2.0 (-1) | 1,295 (-7%) | 6mo | $232,000 | $179 | 51 |
| 114 Gale St | 0.70mi | 3/2.0 (-1) | 1,300 (-7%) | 6mo | $80,000 | $62 | 42 |
| 211 W Lynde St | 0.63mi | 3/2.0 (-1) | 1,554 (+12%) | 1mo | $190,000 | $122 | 42 |
| 131 Cedar St | 0.51mi | 3/1.5 (-1) | 1,586 (+14%) | 6mo | $245,000 | $154 | 41 |
| 212 S Meadow | 0.68mi | 3/2.0 (-1) | 1,240 (-11%) | 6mo | $100,000 | $81 | 36 |
Match score weights: distance 35% · size 25% · config 20% · recency 20%. Top-matched comps best support the ARV.
Projected returns pro-forma
-3.0% appreciation · 8.0% rent growth · sell at horizon
- IRR
- 21.0%
- Equity multiple
- 1.91×
- Total profit
- $28,160
- Equity at exit
- $16,401
- IRR
- 32.4%
- Equity multiple
- 4.69×
- Total profit
- $113,664
- Equity at exit
- $9,511
Cash invested: $30,800 (down + closing). Projections, not guarantees.
Landlord ↔ Tenant lean methodology
- Overall (STATE)
- 15 Strongly Tenant-Friendly
- State New York
- 15 Strongly Tenant-Friendly · D+10
- County
- — inherits STATE
- City
- — inherits STATE
ZIP-level market 13601
- Home prices YoY
- -5.6%
- Rents YoY
- 10.0%
- Active inventory
- 223
- Price-to-rent
- 5.3×
Monthly cashflow live
- Estimated rent
- $1,728 high interval (Pro) →
- Mortgage (P&I)
- −$577
- Tax from tax record
- −$109 /mo · $1,310/yr
- Insurance
- −$46
- Flood insurance flood zone
- −$56 /mo · $666/yr
- HOA
- −$0
- Vacancy / Maint / Mgmt
- −$363
- Net cashflow
- $578
Break-even live
Sensitivity live
| Price | -10% $640 | -5% $609 | +0% $578 | +5% $547 | +10% $516 |
|---|---|---|---|---|---|
| Rent | -10% $441 | -5% $510 | +0% $578 | +5% $646 | +10% $714 |
| Rate | -1.0pp $633 | -0.5pp $606 | base $578 | +0.5pp $549 | +1.0pp $520 |
UW: 25.0% down · 7.5% · 30yr · 1.5% tax · 5.0% vac · 8.0% maint · 8.0% mgmt
Financing live
Cash to close
- Down payment
- $27,500
- Closing costs
- $3,300
- Reserves months
- —
- Total cash needed
- —
Loan-product check · same deal, 3 products live
Conventional
25% down · 7.5% · 30yr
- Down + closing
- —
- Monthly P&I
- —
- Monthly cashflow
- —
- DSCR
- —
- Eligible?
- —
Personal DTI + credit; lowest rate.
DSCR
20% down · 8.5% · 30yr
- Down + closing
- —
- Monthly P&I
- —
- Monthly cashflow
- —
- DSCR
- —
- Eligible?
- —
No personal income docs; deal must DSCR.
Hard money
10% down · 12.0% · 12mo
- Down + closing
- —
- Monthly P&I
- —
- Monthly cashflow
- —
- DSCR
- —
- Eligible?
- —
Short-term bridge; refi at stabilization.
Rent comps 5 comps
| Address | Beds | Baths | Sqft | Rent | $/sqft | DOM | Units | Dist |
|---|---|---|---|---|---|---|---|---|
| 611 Cooper St Watertown, NY | 3.0 | 1.0 | 1190 | $1,495 | $1.26 | 44d | 1 | 0.64mi |
| 207 Wealtha Ave Watertown, NY | 2.0–4.0 | 1.0–2.5 | 1435 | $1,695 | $1.18 | 44d | 9 | 0.82mi |
| 328 Clay St Unit 3 Watertown, NY | 3.0 | 2.0 | 1500 | $1,650 | $1.10 | 44d | 1 | 1.14mi |
| 123 State Pl Watertown, NY | 3.0 | 1.5 | 1500 | $1,750 | $1.17 | 44d | 1 | 1.28mi |
| 621 Academy St Watertown, NY | 3.0 | 2.0 | 1652 | $1,600 | $0.97 | 44d | 1 | 1.36mi |
Listing history 17 events
-
2026-06-19days on market $110,000 Active 46 DOM
-
2026-06-18days on market $110,000 Active 45 DOM
-
2026-06-17days on market $110,000 Active 44 DOM
-
2026-06-16days on market $110,000 Active 43 DOM
-
2026-06-15days on market $110,000 Active 42 DOM
-
2026-06-14days on market $110,000 Active 40 DOM
-
2026-06-12days on market $110,000 Active 39 DOM
-
2026-06-09days on market $110,000 Active 36 DOM
-
2026-06-08days on market $110,000 Active 35 DOM
-
2026-06-07days on market $110,000 Active 34 DOM
-
2026-06-05days on market $110,000 Active 31 DOM
-
2026-06-03days on market $110,000 Active 30 DOM
-
2026-06-02days on market $110,000 Active 29 DOM
-
2026-06-01days on market $110,000 Active 28 DOM
-
2026-05-31days on market $110,000 Active 27 DOM
-
2026-05-30days on market $110,000 Active 26 DOM
-
2026-05-04$122,900 Active 1311-char remark
ⓘ Source: listings_history table (triggers on properties + properties_extension) + one-shot
backfill from property_details.listing_events for pre-trigger history.
Tax reassessment forecast NY · Partial reset (capped growth)
- Current annual tax
- $1,310 · $109/mo
- Projected year-2 tax
- $1,585 · $132/mo
- Expected delta
- +$274/yr (+$23/mo · 20.9%)
ⓘ Screening estimate from a state-policy table — verify with the county assessor before closing.
Climate risk First Street
- Flood 10/10 Extreme FEMA zone X · 99% chance over 30 yrs
- Wildfire 3/10 Moderate
- Heat 2/10 Low 7 d/yr ≥92°F today · 15 d/yr by 30 yrs out
- Wind 1/10 Low 0% chance of damaging wind over 30 yrs
- Air quality 2/10 Low 1 unhealthy d/yr today · 1 by 30 yrs out
Nearby sold comps map
Loading sold comps map…
Walkable amenities ~0.75 mi
Loading nearby amenities…
Taxation est. · year 1
- Rental income
- $20,740
- − Mortgage interest
- −$6,162
- − Property taxes
- −$1,310
- − Insurance
- −$1,216
- − Repairs & maintenance
- −$1,659
- − Management
- −$1,659
- − Depreciation
- −$3,200
- Taxable income
- $5,533
- Est. tax owed @ 24.0%
- −$1,328
- After-tax cash flow
- $5,607/yr
For passive investors: Depreciation is non-cash, so a rental often shows a tax loss while cash-flowing — sheltering income. Rental losses are passive: they offset passive income freely, and up to $25,000/yr can offset ordinary (W-2) income if you actively participate and your MAGI is under $100k (phasing out to $0 by $150k); unused losses carry forward. On sale, claimed depreciation is recaptured at up to 25%, and gains may owe capital-gains tax (a 1031 exchange can defer both). Figures are a year-1 estimate at your 24.0% rate — not tax advice; consult a CPA.
Schools (NCES district)
- District
- Watertown City School District
- NCES district ID
- 3630120
- Math proficiency
- 34% ▼ -10.00%
- Reading proficiency
- 54% ▲ 12.00%
- Median HH income
- $40,919
- Composite
- 36.86/100
- National rank
- #4551
- State rank
- #481 of 590 in NY
Livability — Watertown
- Score
- 68/100
- State rank
- #540
- US rank
- #9700
Category grades
Schools grade is shown separately in the Schools card above.
Census & demographics
- Census place
- Watertown, NY
- County
- Jefferson County · 47,417 people
- City population
- 36,839
- Metro
- Watertown-Fort Drum, NY
- Population (ZIP)
- 36,839
- Household income
- $58,791
- Rent vs Own
- Severe rent burden
- 1634.0
Population outlook (Jefferson County) Hauer SSP2
- Today (2025)
- 111,748 people
- By 2030
- 109,370 · -2.1%
- By 2040
- 103,828 · -7.1%
- By 2050
- 98,523 · -11.8%
- By 2075
- 91,422 · -18.2%
- By 2100
- 78,214 · -30.0%
Race, ethnicity, and origin ACS 2023
- Neighborhood character
- Predominantly White (82%)
- Race & ethnicity
- White 82% Two or more races 7% Hispanic / Latino 6% Black 4% Asian 2%
- Hispanic origin (detail)
- Mexican 2% Puerto Rican 2%
- Common ancestry
- Lithuanian 7% Romanian 3% Slovak 2%
- Foreign-born
- 4% · Canada
- Languages at home
- 94% English-only · Spanish 3% Other Indo-European 1% German/W. Germanic 1%
Political lean MEDSL · Jefferson
- 2024 margin
- Strong R (+23.6) · D 38.2% · R 61.8%
- 2008→2024 swing
- -18.3pp toward R · 2008: -5.3pp · 2024: -23.6pp
- All cycles
- 2024: R+23.6 2020: R+19.0 2016: R+22.4 2012: R+2.9 2008: R+5.3
Not yet ingested
- Civics
- —
Market trends
- HPI YoY
- ▼ -18.86%
- Current HPI
- 316.636
- Rent YoY
- ▲ 9.96%
- Metro
- Watertown-Fort Drum, NY
- State GDP YoY
- ▲ 2.60%
- F500 in state
- 92
Industry mix (Fortune 500 HQ in NY)
| Industry | F500 HQs | Revenue |
|---|---|---|
| Financial Services | 10 | $950B |
|
||
| Consumer Goods | 9 | $162B |
|
||
| Insurance | 4 | $225B |
|
||
| Telecommunications | 2 | $144B |
|
||
| Pharmaceuticals | 2 | $112B |
|
||
| Media / Entertainment | 2 | $69B |
|
||
Price history
-10.5% since first listed2 events — show timeline
- 2026-05-19 Price Changed $110,000 CNYIS
- 2026-05-04 Listed $122,900 CNYIS
Property tax history
+18.7%/yrLatest (2025): $1,310 · +3.9% YoY. Source: county tax records.
Cash-flow waterfall
monthlySold comps — $/sqft
last 12 mo · ≤1 miLoading sold comps…