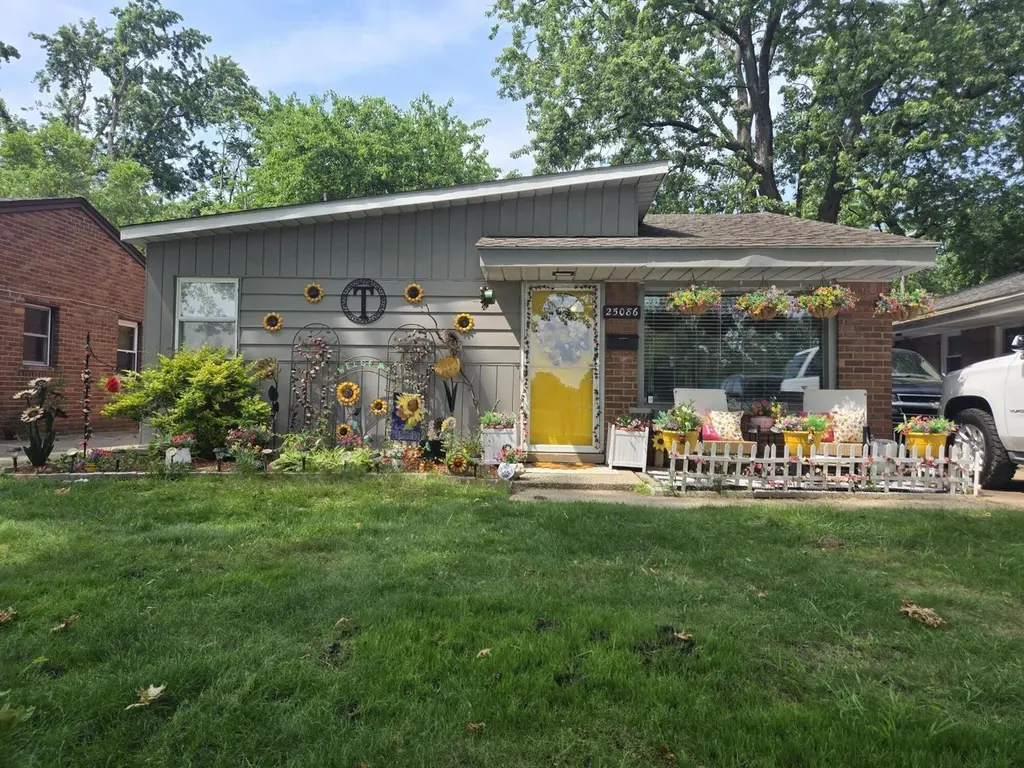
25086 Annapolis St · Dearborn Heights, MI
Flood risk No data
- FEMA flood zone
- —
- Chance of flooding over 30 yrs
- —
- Est. flood insurance / yr
- —
Fire risk No data
- Est. fire insurance / yr
- —
Heat risk No data
- Hot days now (above threshold)
- —
- Hot days in 30 yrs
- —
Wind risk No data
- Chance of severe wind over 30 yrs
- —
Air-quality risk No data
- Unhealthy air days now
- —
- Unhealthy air days in 30 yrs
- —
Risk factors via First Street. Map © Google.
Why this score? — see what drove the B- grade
The composite is a weighted blend of 9 inputs, each scored 0–100. Each bar is that input's sub-score; the figure is the points it added to the 100-point composite (weight × sub-score).
- Cash flow +27.3/30.0
- ARV discount +12.3/15.0
- DSCR +9.5/10.0
- 1% rule +7.0/10.0
- Livability +4.0/5.0
- Rent growth +3.0/5.0
- Condition / age +2.5/5.0
- Schools +0.7/10.0
- Appreciation +0.0/10.0
$115,000
🖨 Deal sheet 📄 Offer letter ✓ Due diligence
Listing remarks MLS
Welcome to this charming and well-manicured 2-bedroom home in Dearborn Heights. Newly painted vaulted ceilings invite plenty of natural light into the mainly open layout, creating an airy and spacious feel. The kitchen and dining room offer a warm, inviting space for conversation and meals. With two closets in each bedroom, you'll have plenty of room to expand your wardrobe. The bathroom has been recently remodeled with an elegant, modern aesthetic. Outside, the intimate yard provides plenty of space to unwind, and the built-in gas grill makes it ready for entertaining. Don't miss the chance to make this lovely home yours!
Key facts
- Two closets
- Built-in gas grill
- Open layout
Tags
Property features AI
Exterior
- Utilities: Public water; Natural gas water heater
- Home design: Ranch-style single family residence; Built in 1954
- Construction: Brick construction; Shingle roof; Slab basement
- Exterior features: Sidewalk; Shed(s)
Interior
- Kitchen: Dishwasher; Microwave; Oven; Range; Refrigerator
- Bedrooms: Primary bedroom; Second bedroom
- Bathrooms: 1 full bathroom
- Heating & cooling: Forced air heating; Has cooling
- Interior features: Insulated windows; Total of 4 rooms
- Laundry & utility: Washer; Dryer
Neighborhood map
What this means for you Summary
Snapshot
- This is a 2-bed/1.0-bath single-family listed at $115k.
Deal economics
- At list price, monthly cash flow is $333 ($4k/yr) — positive.
- The deal already cash-flows at list — no discount required.
- Meets the 1% rule at list price ($1k rent vs $115k).
- Cap rate 9.8% vs local median 5.5% in Dearborn Heights — top-decile yield for the area; either an underpriced asset or a hidden risk that comps aren't pricing in. Stress-test before assuming the spread holds.
Location & tenants
- Location reads 79/100 on livability (#82 in MI, #1,885 nationally) — a middle-class / working-renter tenant base. Strengths: commute A+, cost of living A+, housing A+; Watch: schools C-, crime D+, employment D+.
- Westwood Community School District (suburban): math 6% / reading 11% proficiency, ranked #529 of 540 in MI (top 98%) — low school quality limits family demand, transient renter base, plan for 1-2y turnover; 81% free/reduced lunch — lower-income household profile, screen leases tightly.
- Market conditions: Rents rising (+2.0%/yr); 137 active listings in the ZIP; 24 comparable units currently listed for rent nearby; rentals at typical pace (median 18d on market — plan ~3-4 weeks tenant-placement turnaround); 2,639 units permitted in Wayne County in 2024 (1,216 in 5+ unit buildings).
Forward outlook
- Local home prices are declining (-3.0%/yr); year-one equity from $795 of loan paydown is wiped out by about $3k of value loss. Plan a longer hold.
- Wayne County population projected at -17% by 2050 — secular population decline; favor cash flow + early exit over multi-decade hold.
Negotiation context
- Only 2 days on market — expect competitive offers; lowballing is unlikely to land.
- 5 sale attempts since 30y ago with the ask held roughly flat each time — persistent listings suggest the price (not the market) is what's stuck; bring a comps-based counter.
- Current owner paid $49k; list at $115k implies a 133% gain — meaningful room to come down on a strong offer.
Risks & watch-outs
- Watch-outs: built in 1954 — expect roof / HVAC / electrical / plumbing capex.
Questions for the listing agent
- Built in 1954 — when were the roof, HVAC, electrical panel, plumbing, and water heater last replaced?
- Is there a deadline driving the sale (1031 exchange, divorce, estate, relocation)? That informs how much negotiation room exists.
- Crime grade is D in this area — have there been break-ins, vandalism, or insurance claims at this property in the last 3 years? What carrier currently insures it and at what premium?
- What's the average days-on-market for RENTAL listings here right now (not sales)? A rising rental-DOM trend means longer vacancies and softer asking-rent achievability than the comps imply.
- What's the recent tenant-quality profile in this submarket — average credit score on applications, eviction rate, late-payment / NSF rate, and stable-employment percentage? A property-management company in the area should have these aggregated.
- How much new for-sale + rental construction is in the pipeline within 1–3 miles? Heavy new supply typically softens prices + rents 12–24 months out; constrained supply supports both.
Investment metrics
- 1% rule
- 1.20% ✓
- Cap rate
- 9.77%
- Cash-on-cash
- 12.41%
- DSCR
- 1.55
- GRM
- 6.9
CMA / ARV
- ARV (on-the-fly)
- $128,673
- Comps found
- 12
Show comp detail 12 sales within ~0.75 mi
| Address | Dist | Beds/Ba | Sqft | Sold | Price | $/sf | Match |
|---|---|---|---|---|---|---|---|
| 25038 Annapolis St | 0.05mi | 2/1.0 | 841 (0%) | 1mo | $125,000 | $149 | 97 |
| 25007 Hopkins St | 0.08mi | 2/1.0 | 841 (0%) | 4mo | $129,000 | $153 | 93 |
| 25037 Hopkins St | 0.06mi | 2/1.0 | 812 (-3%) | 2mo | $159,900 | $197 | 90 |
| 24301 Stanford St | 0.46mi | 2/1.0 | 824 (-2%) | 2mo | $155,000 | $188 | 74 |
| 25046 Andover Dr | 0.31mi | 3/1.0 (+1) | 910 (+8%) | 3mo | $140,000 | $154 | 64 |
| 24443 Powers Ave | 0.41mi | 3/1.0 (+1) | 892 (+6%) | 4mo | $125,000 | $140 | 62 |
| 25036 Colgate St | 0.25mi | 3/1.0 (+1) | 945 (+12%) | 1mo | $85,000 | $90 | 62 |
| 4165 Westpoint St | 0.69mi | 3/1.0 (+1) | 847 (+1%) | 1mo | $170,000 | $201 | 61 |
| 24304 Carlysle St | 0.66mi | 2/1.0 | 895 (+6%) | 2mo | $137,000 | $153 | 57 |
| 24337 Ross St | 0.57mi | 2/1.0 | 780 (-7%) | 7mo | $178,000 | $228 | 56 |
| 25885 Currier St | 0.57mi | 3/1.0 (+1) | 936 (+11%) | 5mo | $117,000 | $125 | 46 |
| 26076 Colgate St | 0.62mi | 3/1.0 (+1) | 950 (+13%) | 6mo | $111,610 | $117 | 40 |
Match score weights: distance 35% · size 25% · config 20% · recency 20%. Top-matched comps best support the ARV.
Projected returns pro-forma
-3.0% appreciation · 2.03% rent growth · sell at horizon
- IRR
- 1.0%
- Equity multiple
- 1.04×
- Total profit
- $1,244
- Equity at exit
- $17,147
- IRR
- 9.7%
- Equity multiple
- 1.71×
- Total profit
- $23,018
- Equity at exit
- $9,943
Cash invested: $32,200 (down + closing). Projections, not guarantees.
Landlord ↔ Tenant lean methodology
- Overall (STATE)
- 62 Landlord-Friendly
- State Michigan
- 62 Landlord-Friendly · EVEN
- County
- — inherits STATE
- City
- — inherits STATE
ZIP-level market 48125
- Rents YoY
- 2.0%
- Active inventory
- 137
- Price-to-rent
- 6.9×
Monthly cashflow live
- Estimated rent
- $1,384 high interval (Pro) →
- Mortgage (P&I)
- −$603
- Tax from tax record
- −$109 /mo · $1,313/yr
- Insurance
- −$48
- HOA
- −$0
- Vacancy / Maint / Mgmt
- −$291
- Net cashflow
- $333
Break-even live
UW: 25.0% down · 7.5% · 30yr · 1.5% tax · 5.0% vac · 8.0% maint · 8.0% mgmt
Financing live
Cash to close
- Down payment
- $28,750
- Closing costs
- $3,450
- Reserves months
- —
- Total cash needed
- —
Loan-product check · same deal, 3 products live
Conventional
25% down · 7.5% · 30yr
- Down + closing
- —
- Monthly P&I
- —
- Monthly cashflow
- —
- DSCR
- —
- Eligible?
- —
Personal DTI + credit; lowest rate.
DSCR
20% down · 8.5% · 30yr
- Down + closing
- —
- Monthly P&I
- —
- Monthly cashflow
- —
- DSCR
- —
- Eligible?
- —
No personal income docs; deal must DSCR.
Hard money
10% down · 12.0% · 12mo
- Down + closing
- —
- Monthly P&I
- —
- Monthly cashflow
- —
- DSCR
- —
- Eligible?
- —
Short-term bridge; refi at stabilization.
Rent comps 24 comps
| Address | Beds | Baths | Sqft | Rent | $/sqft | DOM | Units | Dist |
|---|---|---|---|---|---|---|---|---|
| 25016 Lehigh St Dearborn Heights, MI | 2.0 | 1.0 | 1000 | $1,400 | $1.40 | 4d | 1 | 0.16mi |
| 3809 Heritage Pkwy Dearborn, MI | 2.0 | 1.5 | 1035 | $1,400 | $1.35 | 43d | 1 | 0.40mi |
| 24601 Andover Dr Dearborn Heights, MI | 3.0 | 1.5 | 1092 | $1,700 | $1.56 | 1d | 1 | 0.41mi |
| 3755 Heritage Pkwy Dearborn, MI | 2.0 | 1.0 | 830 | $1,450 | $1.75 | 43d | 1 | 0.42mi |
| 3763 Heritage Pkwy Dearborn, MI | 2.0 | 1.5 | 1035 | $1,450 | $1.40 | 43d | 1 | 0.46mi |
| 5845 Michael St Taylor, MI | 2.0 | 1.0 | 618 | $1,325 | $2.14 | 4d | 1 | 0.56mi |
| 26089 Lehigh St Inkster, MI | 2.0 | 1.0 | 900 | $1,295 | $1.44 | 17d | 1 | 0.58mi |
| 24154 Dartmouth St Dearborn, MI | 2.0 | 1.0 | 950 | $1,275 | $1.34 | 14d | 1 | 0.60mi |
| 25722 Carlysle St Dearborn Heights, MI | 3.0 | 1.0 | 1040 | $1,450 | $1.39 | 17d | 1 | 0.62mi |
| 24442 Union St Dearborn, MI | 3.0 | 1.5 | 1000 | $1,900 | $1.90 | 1d | 1 | 0.67mi |
| 4481 Westpoint St Dearborn Heights, MI | 3.0 | 2.0 | 768 | $1,549 | $2.02 | 14d | 1 | 0.68mi |
| 26382 Colgate St Inkster, MI | 2.0 | 1.0 | 850 | $935 | $1.10 | 24d | 1 | 0.88mi |
| 25745 Princeton St Dearborn Heights, MI | 3.0 | 1.0 | 1080 | $1,500 | $1.39 | 10d | 1 | 1.05mi |
| 26707 Penn St Inkster, MI | 3.0 | 1.0 | 900 | $1,400 | $1.56 | 5d | 1 | 1.16mi |
| 26742 Penn St Inkster, MI | 3.0 | 1.0 | 1000 | $1,300 | $1.30 | 16d | 1 | 1.19mi |
| 6477 Westpoint St Taylor, MI | 1.0 | 1.0 | 650 | $900 | $1.38 | 5d | 1 | 1.20mi |
| 5640 Pardee Ave Unit 7 Dearborn Heights, MI | 1.0 | 1.0 | 799 | $999 | $1.25 | 2d | 1 | 1.33mi |
| 5680 Pardee Ave Unit 3 Dearborn Heights, MI | 1.0 | 1.0 | 750 | $999 | $1.33 | 18d | 1 | 1.33mi |
| 5680 Pardee Ave Dearborn Heights, MI | 1.0 | 1.0 | 750 | $999 | $1.33 | 24d | 1 | 1.33mi |
| 5640 Pardee Ave Dearborn Heights, MI | 1.0 | 1.0 | 799 | $999 | $1.25 | 24d | 1 | 1.37mi |
| 27139 Penn St Inkster, MI | 3.0 | 1.0 | 832 | $675 | $0.81 | 17d | 1 | 1.39mi |
| 27149 Penn St Inkster, MI | 1.0 | 1.0 | 846 | $650 | $0.77 | 17d | 1 | 1.40mi |
| 4934 McKinley St Dearborn Heights, MI | 3.0 | 1.0 | 1051 | $1,700 | $1.62 | 1d | 1 | 1.46mi |
| 2825 Queen St Dearborn, MI | 2.0 | 1.0 | 1000 | $1,299 | $1.30 | 43d | 1 | 1.49mi |
Listing history 3 events
-
2026-06-13statusdays on market $115,000 Pending 2 DOM
-
2026-06-10remarks 630-char remark
-
2026-06-10$115,000 Active 1 DOM
ⓘ Source: listings_history table (triggers on properties + properties_extension) + one-shot
backfill from property_details.listing_events for pre-trigger history.
Tax reassessment forecast MI · Partial reset (capped growth)
- Current annual tax
- $1,313 · $109/mo
- Projected year-2 tax
- $1,542 · $129/mo
- Expected delta
- +$229/yr (+$19/mo · 17.4%)
ⓘ Screening estimate from a state-policy table — verify with the county assessor before closing.
Nearby sold comps map
Loading sold comps map…
Walkable amenities ~0.75 mi
Loading nearby amenities…
Taxation est. · year 1
- Rental income
- $16,611
- − Mortgage interest
- −$6,442
- − Property taxes
- −$1,313
- − Insurance
- −$575
- − Repairs & maintenance
- −$1,329
- − Management
- −$1,329
- − Depreciation
- −$3,345
- Taxable income
- $2,278
- Est. tax owed @ 24.0%
- −$547
- After-tax cash flow
- $3,451/yr
For passive investors: Depreciation is non-cash, so a rental often shows a tax loss while cash-flowing — sheltering income. Rental losses are passive: they offset passive income freely, and up to $25,000/yr can offset ordinary (W-2) income if you actively participate and your MAGI is under $100k (phasing out to $0 by $150k); unused losses carry forward. On sale, claimed depreciation is recaptured at up to 25%, and gains may owe capital-gains tax (a 1031 exchange can defer both). Figures are a year-1 estimate at your 24.0% rate — not tax advice; consult a CPA.
Schools (NCES district)
- District
- Westwood Community School District
- NCES district ID
- 2611640
- Math proficiency
- 6% ▼ -6.00%
- Reading proficiency
- 11% ▼ -6.00%
- Median HH income
- $36,350
- Composite
- 7.06/100
- National rank
- #9967
- State rank
- #529 of 540 in MI
Livability — Dearborn Heights
- Score
- 79/100
- State rank
- #82
- US rank
- #1885
Category grades
Schools grade is shown separately in the Schools card above.
Census & demographics
- Census place
- Dearborn Heights, MI
- County
- Wayne County · 1,562,939 people
- City population
- 61,771
- Metro
- Detroit-Warren-Dearborn, MI
- Population (ZIP)
- 22,125
- Household income
- $60,195
- Rent vs Own
- Severe rent burden
- 654.0
Population outlook (Wayne County) Hauer SSP2
- Today (2025)
- 1,675,273 people
- By 2030
- 1,620,300 · -3.3%
- By 2040
- 1,502,341 · -10.3%
- By 2050
- 1,384,039 · -17.4%
- By 2075
- 1,124,592 · -32.9%
- By 2100
- 881,193 · -47.4%
Race, ethnicity, and origin ACS 2023
- Neighborhood character
- Predominantly White (76%)
- Race & ethnicity
- White 76% Black 10% Two or more races 9% Hispanic / Latino 9%
- Hispanic origin (detail)
- Mexican 6%
- Common ancestry
- Romanian 11% Arab 3% Slovak 2%
- Foreign-born
- 11% · Canada
- Languages at home
- 82% English-only · Arabic 13% Spanish 3% Russian/Polish/Slavic 1%
Political lean MEDSL · Wayne
- 2024 margin
- Strong D (+29.0) · D 62.7% · R 33.7% · Other 3.6%
- 2008→2024 swing
- -20.5pp toward R · 2008: 49.5pp · 2024: 29.0pp
- All cycles
- 2024: D+29.0 2020: D+38.1 2016: D+37.3 2012: D+46.9 2008: D+49.5
Not yet ingested
- Civics
- —
Market trends
- HPI YoY
- ▼ -214.70%
- Current HPI
- 218.4698
- Rent YoY
- ▲ 2.03%
- Metro
- Detroit-Warren-Dearborn, MI
- State GDP YoY
- ▲ 1.37%
- F500 in state
- 28
Industry mix (Fortune 500 HQ in MI)
| Industry | F500 HQs | Revenue |
|---|---|---|
| Automotive Parts | 3 | $48B |
|
||
| Automotive | 2 | $372B |
|
||
| Chemicals | 1 | $45B |
|
||
| Automotive Retail | 1 | $29B |
|
||
| Healthcare / Medical Devices | 1 | $23B |
|
||
| Automotive Technology | 1 | $20B |
|
||
Price history
+130.5% since first listed8 events — show timeline
- 2026-06-09 Listed $115,000 REALCOMP
- 2026-06-09 Listed $115,000 MiRealSource-MiMLS
- 2026-06-09 Listed $115,000 SW Michigan MLS
- 2005-12-29 Listing Removed — REALCOMP
- 2005-06-29 Listed $89,900 REALCOMP
- 1997-04-07 Sold (Public Records) $49,300 Public Records
- 1997-02-20 Sold (MLS) $49,300 REALCOMP
- 1996-12-04 Listed $49,900 REALCOMP
Property tax history
-4.0%/yrLatest (2025): $1,313 · +3.7% YoY. Source: county tax records.
Cash-flow waterfall
monthlySold comps — $/sqft
last 12 mo · ≤1 miLoading sold comps…