5410 Cedonia Ave · Baltimore, MD
Flood risk 1/10 · Minimal
- FEMA flood zone
- X (unshaded)
- Chance of flooding over 30 yrs
- 0.0%
- Est. flood insurance / yr
- $473 – $860
Fire risk 1/10 · Minimal
- Est. fire insurance / yr
- $755 – $1,403
Heat risk 8/10 · Major
- Hot days now (above 103°F)
- 7 days/yr
- Hot days in 30 yrs
- 15 days/yr
Wind risk 6/10 · Moderate
- Chance of severe wind over 30 yrs
- 27.0%
Air-quality risk 5/10 · Moderate
- Unhealthy air days now
- 6 days/yr
- Unhealthy air days in 30 yrs
- 8 days/yr
Risk factors via First Street. Map © Google.
Why this score? — see what drove the B grade
The composite is a weighted blend of 9 inputs, each scored 0–100. Each bar is that input's sub-score; the figure is the points it added to the 100-point composite (weight × sub-score).
- Cash flow +29.1/30.0
- ARV discount +15.0/15.0
- DSCR +10.0/10.0
- 1% rule +8.9/10.0
- Livability +3.8/5.0
- Rent growth +3.6/5.0
- Condition / age +2.5/5.0
- Schools +1.0/10.0
- Appreciation +0.0/10.0
$139,900
🖨 Deal sheet (PDF) 📄 Offer letter ✓ Due diligence
Listing remarks MLS
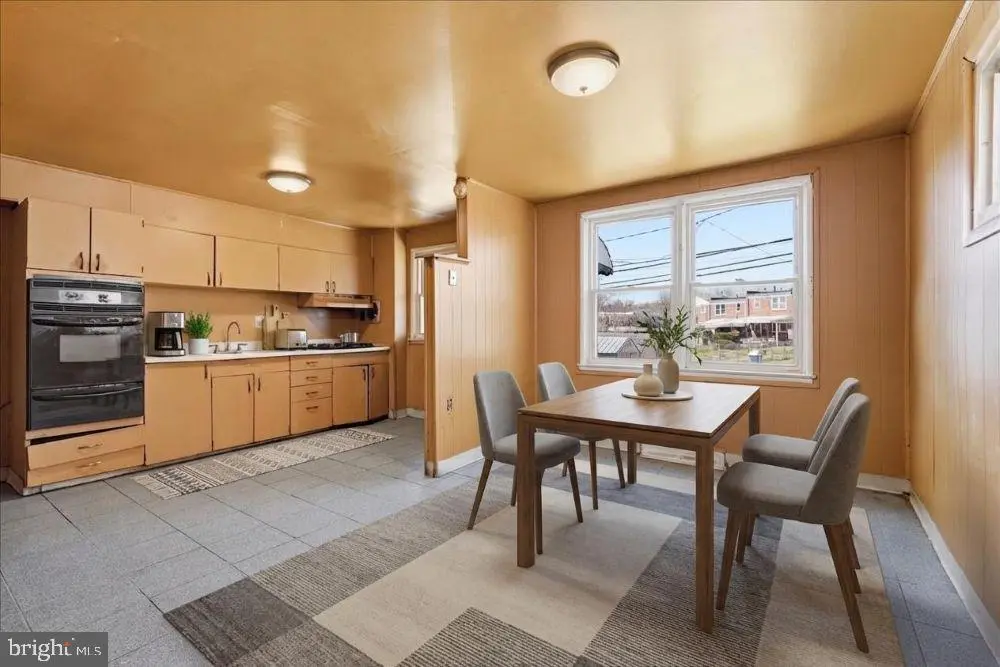
Solid Brick End Unit Rowhome Offering Classic Charm and Exceptional Potential. This Well-Built Home Features Hardwood Floors, a Finished Walk Out Basement Providing Additional Living Space, and a Covered Front Porch Perfect for Relaxing and Enjoying the Neighborhood Setting. The Fenced Backyard Offers Privacy and Room for Outdoor Entertaining, Gardening, or Pets. With Strong Bones and Desirable Features Already in Place, This Property is an Excellent Opportunity for Buyers or Investors Looking to Add Value Through Cosmetic Updates and Personal Touches. Don’t Miss the Chance to Transform this Home into Something Truly Special. Sold As-Is. .
Key facts
- Covered front porch
- Fenced backyard
- Built 1959
Tags
Neighborhood map
What this means for you Summary
Snapshot
- This is a 3-bed/1.0-bath townhouse listed at $140k.
Deal economics
- At list price, monthly cash flow is $484 ($6k/yr) — positive.
- The deal already cash-flows at list — no discount required.
- Meets the 1% rule at list price ($2k rent vs $140k).
- Recommended offer: $132k (6.0% below list) — sets the bar for market timing.
Location & tenants
- Location reads 76/100 on livability (#90 in MD, #3,396 nationally) — a middle-class / working-renter tenant base. Strengths: amenities A+, commute A+, housing A+; Watch: crime F.
- Baltimore City Public Schools (urban): math 7% / reading 16% proficiency, ranked #24 of 24 in MD (top 100%) — low school quality limits family demand, transient renter base, plan for 1-2y turnover; 79% free/reduced lunch — lower-income household profile, screen leases tightly.
- Zoned schools: Elmer A. Henderson: A Johns Hopkins Partnership (math 2% / reading 16%, grade F, #650 of 860 statewide, top 77%, 642 students, 80% FRL); Baltimore Polytechnic Institute (math 71% / reading 84%, grade A-, #22 of 222 statewide, top 10%, 1,555 students, 43% FRL) — zoned schools average 62% FRL vs 79% district-wide (17 pts lower); this property's tenant base skews higher-income than the district average.
- Zoned-school proficiency averages 43% at this address vs 12% district-wide (+32 pts) — the actual schools serving this property are materially stronger than the Baltimore City Public Schools average implies; a family-tenant draw the district grade alone would hide.
- Market conditions: Rents rising fast (+4.4%/yr); 180 active listings in the ZIP; 35 comparable units currently listed for rent nearby; rentals at typical pace (median 26d on market — plan ~3-4 weeks tenant-placement turnaround); 1,273 units permitted in Baltimore city in 2024 (1,104 in 5+ unit buildings).
Forward outlook
- Local home prices are declining (-3.0%/yr); year-one equity from $967 of loan paydown is wiped out by about $4k of value loss. Plan a longer hold.
- Baltimore County population projected to shrink 4% by 2050 — rents likely to lag national; underwrite the cash flow, not the appreciation.
- At projected returns (-3.0% appreciation + 4.4% rent growth), your $39k cash investment doubles in ~8 years — after that, you're playing with house money.
Negotiation context
- It's been on market 76 days — a 6% lower offer ($132k) is reasonable based on typical stale-listing flexibility.
- 2 sale attempts with the ask held roughly flat each time — persistent listings suggest the price (not the market) is what's stuck; bring a comps-based counter.
- Current owner paid $47k; list at $140k implies a 198% gain — meaningful room to come down on a strong offer.
Risks & watch-outs
- Watch-outs: built in 1959 — expect roof / HVAC / electrical / plumbing capex.
- Climate carrying-cost: major wind risk, 27% chance of damaging wind over 30y; extreme-heat days projected 7→15/yr by 2055 (HVAC capex compounding) — expect insurance premiums to compound above CPI over the hold.
Questions for the listing agent
- It's been on market 76 days. Have you received any prior offers? Is the seller open to a 6% concession, seller financing, or rate buy-down credit?
- Built in 1959 — when were the roof, HVAC, electrical panel, plumbing, and water heater last replaced?
- Why hasn't it sold? Are there any deal-killer items the seller is aware of (foundation, flood, title, zoning, code violations)?
- Is there a deadline driving the sale (1031 exchange, divorce, estate, relocation)? That informs how much negotiation room exists.
- Schools are D-rated, which usually means shorter tenancies and higher turnover. Who's the typical renter profile here, and what's been the actual vacancy rate?
- Crime grade is F in this area — have there been break-ins, vandalism, or insurance claims at this property in the last 3 years? What carrier currently insures it and at what premium?
- What's the average days-on-market for RENTAL listings here right now (not sales)? A rising rental-DOM trend means longer vacancies and softer asking-rent achievability than the comps imply.
- What's the recent tenant-quality profile in this submarket — average credit score on applications, eviction rate, late-payment / NSF rate, and stable-employment percentage? A property-management company in the area should have these aggregated.
- How much new for-sale + rental construction is in the pipeline within 1–3 miles? Heavy new supply typically softens prices + rents 12–24 months out; constrained supply supports both.
Investment metrics
- 1% rule
- 1.39% ✓
- Cap rate
- 10.44%
- Cash-on-cash
- 14.83%
- DSCR
- 1.66
- GRM
- 6.0
CMA / ARV
- ARV (median comp)
- $227,661
- List price
- $139,900
- Delta
- -38.55%
- Verdict
- UNDERPRICED
- Comps
- 20 within 1.0 mi
Show comp detail 12 sales within ~0.75 mi
| Address | Dist | Beds/Ba | Sqft | Sold | Price | $/sf | Match |
|---|---|---|---|---|---|---|---|
| 5454 Cedonia Ave | 0.09mi | 4/2.0 (+1) | 1,152 (0%) | 2mo | $215,000 | $187 | 86 |
| 5516 Seward Ave | 0.23mi | 3/1.5 | 1,164 (+1%) | 2mo | $140,000 | $120 | 84 |
| 5536 Whitby Rd | 0.30mi | 3/1.5 | 1,152 (0%) | 6mo | $137,500 | $119 | 79 |
| 6021 Arizona Ave | 0.34mi | 3/1.5 | 1,152 (0%) | 6mo | $164,900 | $143 | 77 |
| 8124 Bartholomew Ct | 0.65mi | 3/2.5 | 1,148 (-0%) | 6mo | $330,900 | $288 | 58 |
| 5327 Todd Ave | 0.31mi | 4/2.0 (+1) | 1,024 (-11%) | 1mo | $259,900 | $254 | 57 |
| 5907 Daywalt Ave | 0.13mi | 2/1.5 (-1) | 1,008 (-12%) | 11mo | $125,000 | $124 | 57 |
| 4843 Greencrest Rd | 0.60mi | 3/1.0 | 1,088 (-6%) | 8mo | $210,000 | $193 | 56 |
| 5006 Anntana Ave | 0.40mi | 3/2.5 | 1,024 (-11%) | 2mo | $260,000 | $254 | 55 |
| 4921 Greencrest Rd | 0.52mi | 3/1.5 | 1,280 (+11%) | 1mo | $112,500 | $88 | 54 |
| 4540 Hazelwood Ave | 0.66mi | 3/1.5 | 1,080 (-6%) | 10mo | $180,000 | $167 | 48 |
| 5437 Force Rd | 0.74mi | 3/2.0 | 1,024 (-11%) | 10mo | $212,500 | $208 | 35 |
Match score weights: distance 35% · size 25% · config 20% · recency 20%. Top-matched comps best support the ARV.
Projected returns pro-forma
-3.0% appreciation · 4.43% rent growth · sell at horizon
- IRR
- 7.1%
- Equity multiple
- 1.28×
- Total profit
- $11,071
- Equity at exit
- $20,860
- IRR
- 17.7%
- Equity multiple
- 2.57×
- Total profit
- $61,635
- Equity at exit
- $12,096
Cash invested: $39,172 (down + closing). Projections, not guarantees.
Landlord ↔ Tenant lean methodology
- Overall (CITY)
- 12 Strongly Tenant-Friendly
- State Maryland
- 27 Tenant-Leaning · D+14
- County
- — inherits STATE
- City Baltimore
- 12 Strongly Tenant-Friendly · D+58
ZIP-level market 21206
- Rents YoY
- 4.4%
- Active inventory
- 180
- Price-to-rent
- 6.0×
Monthly cashflow live
- Estimated rent
- $1,942 high interval (Pro) →
- Mortgage (P&I)
- −$734
- Tax from tax record
- −$258 /mo · $3,097/yr
- Insurance
- −$58
- HOA
- −$0
- Vacancy / Maint / Mgmt
- −$408
- Net cashflow
- $484
Break-even live
Sensitivity live
| Price | -10% $563 | -5% $524 | +0% $484 | +5% $444 | +10% $405 |
|---|---|---|---|---|---|
| Rent | -10% $331 | -5% $407 | +0% $484 | +5% $561 | +10% $637 |
| Rate | -1.0pp $554 | -0.5pp $520 | base $484 | +0.5pp $448 | +1.0pp $411 |
UW: 25.0% down · 7.5% · 30yr · 1.5% tax · 5.0% vac · 8.0% maint · 8.0% mgmt
Financing live
Cash to close
- Down payment
- $34,975
- Closing costs
- $4,197
- Reserves months
- —
- Total cash needed
- —
Loan-product check · same deal, 3 products live
Conventional
25% down · 7.5% · 30yr
- Down + closing
- —
- Monthly P&I
- —
- Monthly cashflow
- —
- DSCR
- —
- Eligible?
- —
Personal DTI + credit; lowest rate.
DSCR
20% down · 8.5% · 30yr
- Down + closing
- —
- Monthly P&I
- —
- Monthly cashflow
- —
- DSCR
- —
- Eligible?
- —
No personal income docs; deal must DSCR.
Hard money
10% down · 12.0% · 12mo
- Down + closing
- —
- Monthly P&I
- —
- Monthly cashflow
- —
- DSCR
- —
- Eligible?
- —
Short-term bridge; refi at stabilization.
Rent comps 35 comps
| Address | Beds | Baths | Sqft | Rent | $/sqft | DOM | Units | Dist |
|---|---|---|---|---|---|---|---|---|
| 5253 Cedgate Rd Unit 1 Baltimore, MD | 3.0 | 1.5 | 1152 | $2,200 | $1.91 | 45d | 1 | 0.21mi |
| 6042 Barstow Rd Baltimore, MD | 1.0–3.0 | 1.0 | 736 | $1,527 | $2.07 | 4d | 1 | 0.31mi |
| 5313 Todd Ave Baltimore, MD | 3.0 | 1.5 | 1280 | $1,800 | $1.41 | 18d | 1 | 0.34mi |
| 5904 Arizona Ave Unit B Baltimore, MD | 3.0 | 2.0 | 925 | $1,550 | $1.68 | 25d | 1 | 0.37mi |
| 4909 Hamilton Ave Baltimore, MD | 2.0–3.0 | 2.0 | 862 | $1,550 | $1.80 | 4d | 5 | 0.39mi |
| 4907 Hamilton Ave Unit B Baltimore, MD | 3.0 | 2.0 | 925 | $1,699 | $1.84 | 45d | 1 | 0.42mi |
| 4903 1/2 Hamilton Ave Apt B Baltimore, MD | 3.0 | 2.0 | 925 | $1,550 | $1.68 | 25d | 1 | 0.42mi |
| 4903 1/2 Hamilton Ave Unit A Baltimore, MD | 2.0 | 2.0 | 800 | $1,450 | $1.81 | 25d | 1 | 0.42mi |
| 4905 Hamilton Ave Apt B Baltimore, MD | 3.0 | 2.0 | 925 | $1,550 | $1.68 | 25d | 1 | 0.42mi |
| 4924 Frankford Ave Baltimore, MD | 4.0 | 2.0 | 1176 | $2,600 | $2.21 | 25d | 1 | 0.50mi |
| 5676 Utrecht Rd Baltimore, MD | 3.0 | 2.0 | 1334 | $2,195 | $1.65 | 0d | 1 | 0.51mi |
| 5738 Cedonia Ave Baltimore, MD | 2.0 | 1.0 | 797 | $1,372 | $1.72 | 0d | 2 | 0.56mi |
| 5611 Force Rd Baltimore, MD | 3.0 | 1.5 | 1296 | $1,850 | $1.43 | 45d | 1 | 0.68mi |
| 1732 Chesaco Ave Rosedale, MD | 3.0 | 1.0 | 1260 | $2,295 | $1.82 | 45d | 1 | 0.69mi |
| 4308 Hamilton Ave Baltimore, MD | 2.0 | 1.0 | 1110 | $1,416 | $1.28 | 25d | 1 | 0.89mi |
| 2009 Longview Ave Rosedale, MD | 3.0 | 2.0 | 1062 | $2,500 | $2.35 | 16d | 1 | 0.96mi |
| 4901 Gunther Ave Baltimore, MD | 1.0–3.0 | 1.0–2.0 | 742 | $1,463 | $1.97 | 4d | 1 | 1.00mi |
| 5305 Moravia Rd Baltimore, MD | 3.0 | 1.0 | 679 | $1,993 | $2.93 | 4d | 1 | 1.03mi |
| 5632 Belair Rd Baltimore, MD | 3.0 | 1.5 | 1260 | $2,100 | $1.67 | 25d | 1 | 1.05mi |
| 4517 Woodlea Ave Baltimore, MD | 2.0 | 2.0 | 1326 | $1,900 | $1.43 | 4d | 1 | 1.08mi |
| 5938 Clayton Ave Baltimore, MD | 4.0 | 2.0 | 1296 | $2,872 | $2.22 | 18d | 1 | 1.10mi |
| 6004 Amberwood Rd Baltimore, MD | 2.0 | 1.0 | 751 | $1,220 | $1.62 | 21d | 1 | 1.12mi |
| 4111 Century Rd Baltimore, MD | 3.0 | 1.5 | 1432 | $2,500 | $1.75 | 45d | 1 | 1.14mi |
| 8212 Dorset Ave Rosedale, MD | 4.0 | 1.5 | 1479 | $2,250 | $1.52 | 45d | 1 | 1.17mi |
| 5731 Denwood Ave Baltimore, MD | 3.0 | 1.5 | 1440 | $1,700 | $1.18 | 25d | 1 | 1.18mi |
| 5731 Denwood Ave Baltimore, MD | 3.0 | 1.5 | 1152 | $1,700 | $1.48 | 23d | 1 | 1.18mi |
| 5906 Benton Heights Ave Baltimore, MD | 2.0 | 1.0 | 780 | $1,350 | $1.73 | 45d | 1 | 1.21mi |
| 4007 Biddison Ln Apt 1 Baltimore, MD | 2.0 | 1.0 | 1000 | $1,279 | $1.28 | 19d | 1 | 1.25mi |
| 5424 Belle Vista Ave Baltimore, MD | 2.0 | 1.0 | 932 | $1,300 | $1.39 | 45d | 1 | 1.25mi |
| 4023 Belwood Ave Baltimore, MD | 3.0 | 1.0 | 1080 | $1,995 | $1.85 | 45d | 1 | 1.25mi |
| 4104 Parkwood Ave Baltimore, MD | 3.0 | 1.0 | 1224 | $2,800 | $2.29 | 25d | 1 | 1.25mi |
| 4409 Moravia Rd Baltimore, MD | 2.0 | 1.0 | 861 | $1,385 | $1.61 | 45d | 3 | 1.34mi |
| 3802 Biddison Ln Baltimore, MD | 4.0 | 1.5 | 1443 | $2,024 | $1.40 | 13d | 1 | 1.42mi |
| 5413 Pembroke Ave Baltimore, MD | 3.0 | 2.0 | 1350 | $1,895 | $1.40 | 0d | 1 | 1.42mi |
| 5926 Belle Vista Ave Baltimore, MD | 3.0 | 2.0 | 1248 | $2,250 | $1.80 | 0d | 1 | 1.45mi |
Listing history 18 events
-
2026-06-21days on market $139,900 Active 76 DOM
-
2026-06-18days on market $139,900 Active 73 DOM
-
2026-06-17days on market $139,900 Active 72 DOM
-
2026-06-16days on market $139,900 Active 71 DOM
-
2026-06-15days on market $139,900 Active 70 DOM
-
2026-06-13days on market $139,900 Active 68 DOM
-
2026-06-09days on market $139,900 Active 64 DOM
-
2026-06-08days on market $139,900 Active 63 DOM
-
2026-06-07days on market $139,900 Active 62 DOM
-
2026-06-04days on market $139,900 Active 59 DOM
-
2026-06-03days on market $139,900 Active 58 DOM
-
2026-06-02days on market $139,900 Active 57 DOM
-
2026-06-01days on market $139,900 Active 56 DOM
-
2026-05-31days on market $139,900 Active 55 DOM
-
2026-04-21status Active 653-char remark
Show marketing remark (653 chars)
Solid Brick End Unit Rowhome Offering Classic Charm and Exceptional Potential. This Well-Built Home Features Hardwood Floors, a Finished Walk Out Basement Providing Additional Living Space, and a Covered Front Porch Perfect for Relaxing and Enjoying the Neighborhood Setting. The Fenced Backyard Offers Privacy and Room for Outdoor Entertaining, Gardening, or Pets. With Strong Bones and Desirable Features Already in Place, This Property is an Excellent Opportunity for Buyers or Investors Looking to Add Value Through Cosmetic Updates and Personal Touches. Don’t Miss the Chance to Transform this Home into Something Truly Special. Sold As-Is. .
-
2026-04-11status Pending 653-char remark
Show marketing remark (653 chars)
Solid Brick End Unit Rowhome Offering Classic Charm and Exceptional Potential. This Well-Built Home Features Hardwood Floors, a Finished Walk Out Basement Providing Additional Living Space, and a Covered Front Porch Perfect for Relaxing and Enjoying the Neighborhood Setting. The Fenced Backyard Offers Privacy and Room for Outdoor Entertaining, Gardening, or Pets. With Strong Bones and Desirable Features Already in Place, This Property is an Excellent Opportunity for Buyers or Investors Looking to Add Value Through Cosmetic Updates and Personal Touches. Don’t Miss the Chance to Transform this Home into Something Truly Special. Sold As-Is. .
-
2026-03-27$139,900 Active 653-char remark
Show marketing remark (653 chars)
Solid Brick End Unit Rowhome Offering Classic Charm and Exceptional Potential. This Well-Built Home Features Hardwood Floors, a Finished Walk Out Basement Providing Additional Living Space, and a Covered Front Porch Perfect for Relaxing and Enjoying the Neighborhood Setting. The Fenced Backyard Offers Privacy and Room for Outdoor Entertaining, Gardening, or Pets. With Strong Bones and Desirable Features Already in Place, This Property is an Excellent Opportunity for Buyers or Investors Looking to Add Value Through Cosmetic Updates and Personal Touches. Don’t Miss the Chance to Transform this Home into Something Truly Special. Sold As-Is. .
-
1982-11-18soldstatus $46,900
ⓘ Source: listings_history table (triggers on properties + properties_extension) + one-shot
backfill from property_details.listing_events for pre-trigger history.
Tax reassessment forecast MD · Partial reset (capped growth)
- Current annual tax
- $3,097 · $258/mo
- Projected year-2 tax
- $3,097 · $258/mo
- Expected delta
- $0/yr ($0/mo · 0.0%)
ⓘ Screening estimate from a state-policy table — verify with the county assessor before closing.
Climate risk First Street
- Flood 1/10 Low FEMA zone X (unshaded) · 0% chance over 30 yrs
- Wildfire 1/10 Low
- Heat 8/10 Severe 7 d/yr ≥103°F today · 15 d/yr by 30 yrs out
- Wind 6/10 Major 27% chance of damaging wind over 30 yrs
- Air quality 5/10 Major 6 unhealthy d/yr today · 8 by 30 yrs out
Nearby sold comps map
Loading sold comps map…
Walkable amenities ~0.75 mi
Loading nearby amenities…
Taxation est. · year 1
- Rental income
- $23,302
- − Mortgage interest
- −$7,837
- − Property taxes
- −$3,097
- − Insurance
- −$700
- − Repairs & maintenance
- −$1,864
- − Management
- −$1,864
- − Depreciation
- −$4,070
- Taxable income
- $3,871
- Est. tax owed @ 24.0%
- −$929
- After-tax cash flow
- $4,879/yr
For passive investors: Depreciation is non-cash, so a rental often shows a tax loss while cash-flowing — sheltering income. Rental losses are passive: they offset passive income freely, and up to $25,000/yr can offset ordinary (W-2) income if you actively participate and your MAGI is under $100k (phasing out to $0 by $150k); unused losses carry forward. On sale, claimed depreciation is recaptured at up to 25%, and gains may owe capital-gains tax (a 1031 exchange can defer both). Figures are a year-1 estimate at your 24.0% rate — not tax advice; consult a CPA.
Schools (NCES district)
- District
- Baltimore City Public Schools
- NCES district ID
- 2400090
- Math proficiency
- 7% ▼ -9.00%
- Reading proficiency
- 16% ▼ -5.00%
- Median HH income
- $42,108
- Composite
- 10.08/100
- National rank
- #9805
- State rank
- #24 of 24 in MD
Livability — Baltimore
- Score
- 76/100
- State rank
- #90
- US rank
- #3396
Category grades
Schools grade is shown separately in the Schools card above.
Census & demographics
- Census place
- Baltimore, MD
- County
- Baltimore City · 558,601 people
- City population
- 588,727
- Metro
- Baltimore-Columbia-Towson, MD
- Population (ZIP)
- 48,902
- Household income
- $64,531
- Rent vs Own
- Severe rent burden
- 2317.0
Population outlook (Baltimore County) Hauer SSP2
- Today (2025)
- 624,249 people
- By 2030
- 621,541 · -0.4%
- By 2040
- 609,756 · -2.3%
- By 2050
- 597,249 · -4.3%
- By 2075
- 552,236 · -11.5%
- By 2100
- 513,934 · -17.7%
Race, ethnicity, and origin ACS 2023
- Neighborhood character
- Predominantly Black (73%)
- Race & ethnicity
- Black 73% White 20% Two or more races 3% Hispanic / Latino 3% Asian 2%
- Common ancestry
- Romanian 3% Ukrainian 1%
- Foreign-born
- 8% · Canada
- Languages at home
- 92% English-only · Spanish 2% Arabic 2% Other Indo-European 1%
Political lean MEDSL · Baltimore
- 2024 margin
- Solid D (+73.0) · D 85.2% · R 12.2% · Other 2.6%
- 2008→2024 swing
- -2.5pp toward R · 2008: 75.5pp · 2024: 73.0pp
- All cycles
- 2024: D+73.0 2020: D+76.6 2016: D+74.6 2012: D+76.4 2008: D+75.5
Not yet ingested
- Civics
- —
Market trends
- HPI YoY
- ▼ -191.83%
- Current HPI
- 284.5645
- Rent YoY
- ▲ 4.43%
- Metro
- Baltimore-Columbia-Towson, MD
- State GDP YoY
- ▲ 2.97%
- F500 in state
- 12
Industry mix (Fortune 500 HQ in MD)
| Industry | F500 HQs | Revenue |
|---|---|---|
| Aerospace / Defense | 1 | $71B |
|
||
| Utilities | 1 | $25B |
|
||
| Hotels | 1 | $24B |
|
||
| Consumer Goods | 1 | $7B |
|
||
| Real Estate | 1 | $6B |
|
||
| Chemicals | 1 | $2B |
|
||
Price history
+198.3% since first listed4 events — show timeline
- 2026-04-21 Relisted — BRIGHT MLS
- 2026-04-11 Pending — BRIGHT MLS
- 2026-03-27 Listed $139,900 BRIGHT MLS
- 1982-11-18 Sold (Public Records) $46,900 Public Records
Property tax history
+0.8%/yrLatest (2025): $3,097 · +7.6% YoY. Source: county tax records.
Cash-flow waterfall
monthlySold comps — $/sqft
last 12 mo · ≤1 miLoading sold comps…