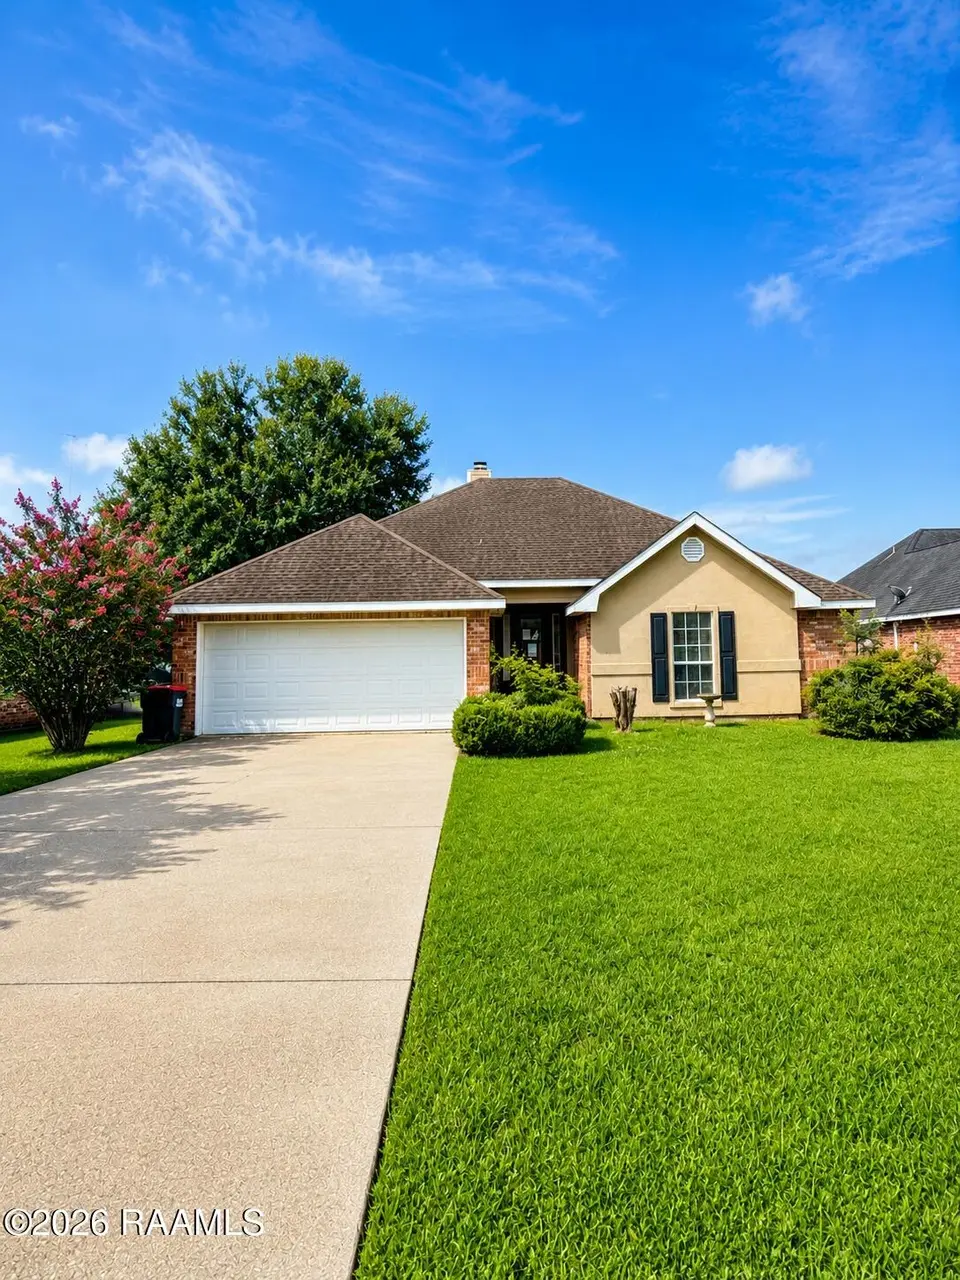
603 Emancipation Dr · Broussard, LA
Flood risk 1/10 · Minimal
- FEMA flood zone
- X (unshaded)
- Chance of flooding over 30 yrs
- 0.0%
- Est. flood insurance / yr
- $507 – $1,088
Fire risk 1/10 · Minimal
- Est. fire insurance / yr
- $1,269 – $2,357
Heat risk 9/10 · Severe
- Hot days now (above 108°F)
- 7 days/yr
- Hot days in 30 yrs
- 22 days/yr
Wind risk 9/10 · Severe
- Chance of severe wind over 30 yrs
- 99.0%
Air-quality risk 2/10 · Minimal
- Unhealthy air days now
- 1 days/yr
- Unhealthy air days in 30 yrs
- 1 days/yr
Risk factors via First Street. Map © Google.
Why this score? — see what drove the B- grade
The composite is a weighted blend of 9 inputs, each scored 0–100. Each bar is that input's sub-score; the figure is the points it added to the 100-point composite (weight × sub-score).
- Cash flow +25.9/30.0
- ARV discount +15.0/15.0
- DSCR +8.7/10.0
- 1% rule +6.2/10.0
- Schools +3.6/10.0
- Livability +3.6/5.0
- Rent growth +2.5/5.0
- Condition / age +2.5/5.0
- Appreciation +0.0/10.0
$190,000
🖨 Deal sheet 📄 Offer letter ✓ Due diligence
Listing remarks MLS
Sold Before listed
Key facts
- 9,147 sq ft lot
- 2 garage spots
- Built 1994
Property features AI
Exterior
- Parking: 2 covered parking spaces; 2 total parking spaces; 2-car garage
- Utilities: Gas service: Entergy; Electric service: SLEMCO; Public sewer
- Home design: Single family residence; City street frontage
- Construction: Brick veneer, stucco, vinyl siding and frame construction; Composition roof
- Exterior features: Covered patio/porch; Full wood fencing
Interior
- Kitchen: Dishwasher; Disposal; Electric cooktop; Electric stove
- Flooring: Tile; Wood laminate
- Bathrooms: 2 full bathrooms
- Heating & cooling: Central heating; Central air conditioning; Has heating and cooling
- Interior features: High ceilings; Separate shower; Living room; Granite tile counters; Window treatments; Wood window frames; Lighting
- Laundry & utility: Washer hookup
Neighborhood map
What this means for you Summary
Snapshot
- This is a 3-bed/2.0-bath single-family listed at $190k.
Deal economics
- At list price, monthly cash flow is $465 ($6k/yr) — positive.
- The deal already cash-flows at list — no discount required.
- Meets the 1% rule at list price ($2k rent vs $190k).
- Recommended offer: $187k (1.5% below list) — sets the bar for market timing.
- Cap rate 9.2% vs local median 4.7% in Broussard — top-decile yield for the area; either an underpriced asset or a hidden risk that comps aren't pricing in. Stress-test before assuming the spread holds.
Location & tenants
- Location reads 71/100 on livability (#49 in LA) — a middle-class / working-renter tenant base. Strengths: housing A+, cost of living A-, employment B+; Watch: amenities F, commute F, health & safety F.
- Lafayette Parish (urban): math 38% / reading 46% proficiency, ranked #19 of 98 in LA (top 19%) — families likely to look elsewhere, expect single-tenant / working-renter base with shorter leases.
- Zoned schools: Katharine Drexel Elementary School (math 34% / reading 57%, grade D-, #169 of 646 statewide, top 27%, 646 students, 69% FRL); Broussard Middle School (math 38% / reading 51%, grade D, #49 of 218 statewide, top 23%, 581 students, 60% FRL); O. Comeaux High School (math 38% / reading 40%, grade F, #86 of 265 statewide, top 33%, 1,098 students, 56% FRL).
- Market conditions: 339 active listings in the ZIP; 4 comparable units currently listed for rent nearby; rentals leasing fast (median 14d on market — plan ~1-2 weeks tenant-placement turnaround); solid renter incomes; 1,585 units permitted in Lafayette Parish in 2024 (10 in 5+ unit buildings).
Forward outlook
- Local home prices are declining (-3.0%/yr); year-one equity from $1k of loan paydown is wiped out by about $6k of value loss. Plan a longer hold.
- Lafayette County population projected at +34% by 2050 — long-run rental-demand tailwind backs the buy-and-hold thesis.
Negotiation context
- It's been on market 15 days — a 2% lower offer ($187k) is reasonable based on typical stale-listing flexibility.
- 3 sale attempts since 32y ago; this cycle's ask has dropped $15k (7%) from the opening price — seller is motivated, your offer sets the floor, not the list.
Risks & watch-outs
- Climate carrying-cost: severe wind risk, 99% chance of damaging wind over 30y; extreme-heat days projected 7→22/yr by 2055 (HVAC capex compounding) — expect insurance premiums to compound above CPI over the hold.
Questions for the listing agent
- Is there a deadline driving the sale (1031 exchange, divorce, estate, relocation)? That informs how much negotiation room exists.
- Schools are B-rated — typically a magnet for longer-tenancy family renters. What's the average tenant stay here, and is there a school-zone premium baked into asking?
- What's the average days-on-market for RENTAL listings here right now (not sales)? A rising rental-DOM trend means longer vacancies and softer asking-rent achievability than the comps imply.
- What's the recent tenant-quality profile in this submarket — average credit score on applications, eviction rate, late-payment / NSF rate, and stable-employment percentage? A property-management company in the area should have these aggregated.
- How much new for-sale + rental construction is in the pipeline within 1–3 miles? Heavy new supply typically softens prices + rents 12–24 months out; constrained supply supports both.
Investment metrics
- 1% rule
- 1.12% ✓
- Cap rate
- 9.23%
- Cash-on-cash
- 10.48%
- DSCR
- 1.47
- GRM
- 7.5
CMA / ARV
- ARV (on-the-fly)
- $234,900
- Comps found
- 12
Show comp detail 12 sales within ~0.75 mi
| Address | Dist | Beds/Ba | Sqft | Sold | Price | $/sf | Match |
|---|---|---|---|---|---|---|---|
| 713 Burlington Cir | 0.07mi | 3/2.0 | 1,625 (+0%) | 2mo | $233,000 | $143 | 95 |
| 200 Bull Run Cir | 0.19mi | 3/2.0 | 1,594 (-2%) | 6mo | $248,000 | $156 | 83 |
| 103 Chattanooga Pl | 0.17mi | 3/2.0 | 1,722 (+6%) | 3mo | $235,000 | $136 | 79 |
| 107 Gettysburg Dr | 0.21mi | 3/3.0 | 1,655 (+2%) | 9mo | $245,000 | $148 | 75 |
| 136 Lake Ridge Dr | 0.57mi | 3/2.0 | 1,616 (-0%) | 3mo | $249,000 | $154 | 71 |
| 104 Bull Run Cir | 0.19mi | 3/2.0 | 1,468 (-9%) | 9mo | $194,500 | $132 | 68 |
| 104 Chickamauga Pl | 0.26mi | 3/2.0 | 1,390 (-14%) | 9mo | $205,000 | $147 | 57 |
| 120 Lake Ridge Dr | 0.45mi | 3/2.0 | 1,836 (+13%) | 5mo | $251,000 | $137 | 53 |
| 123 Lake Ridge Dr | 0.67mi | 4/2.0 (+1) | 1,704 (+5%) | 6mo | $247,000 | $145 | 50 |
| 127 Lake Ridge Dr | 0.45mi | 4/2.0 (+1) | 1,836 (+13%) | 6mo | $251,000 | $137 | 47 |
| 121 Lake Ridge Dr | 0.67mi | 3/2.0 | 1,447 (-11%) | 9mo | $231,000 | $160 | 44 |
| 124 Lake Ridge Dr | 0.67mi | 4/2.0 (+1) | 1,786 (+10%) | 6mo | $250,500 | $140 | 42 |
Match score weights: distance 35% · size 25% · config 20% · recency 20%. Top-matched comps best support the ARV.
Projected returns pro-forma
-3.0% appreciation · 3.0% rent growth · sell at horizon
- IRR
- -0.6%
- Equity multiple
- 0.98×
- Total profit
- $-1,223
- Equity at exit
- $28,330
- IRR
- 9.1%
- Equity multiple
- 1.69×
- Total profit
- $36,923
- Equity at exit
- $16,428
Cash invested: $53,200 (down + closing). Projections, not guarantees.
Landlord ↔ Tenant lean methodology
- Overall (STATE)
- 90 Strongly Landlord-Friendly
- State Louisiana
- 90 Strongly Landlord-Friendly · R+12
- County
- — inherits STATE
- City
- — inherits STATE
ZIP-level market 70518
- Home prices YoY
- -16.0%
- Active inventory
- 339
- Price-to-rent
- 7.5×
Monthly cashflow live
- Estimated rent
- $2,123 medium interval (Pro) →
- Mortgage (P&I)
- −$996
- Tax from tax record
- −$137 /mo · $1,644/yr
- Insurance
- −$79
- HOA
- −$0
- Vacancy / Maint / Mgmt
- −$446
- Net cashflow
- $465
Break-even live
UW: 25.0% down · 7.5% · 30yr · 1.5% tax · 5.0% vac · 8.0% maint · 8.0% mgmt
Financing live
Cash to close
- Down payment
- $47,500
- Closing costs
- $5,700
- Reserves months
- —
- Total cash needed
- —
Loan-product check · same deal, 3 products live
Conventional
25% down · 7.5% · 30yr
- Down + closing
- —
- Monthly P&I
- —
- Monthly cashflow
- —
- DSCR
- —
- Eligible?
- —
Personal DTI + credit; lowest rate.
DSCR
20% down · 8.5% · 30yr
- Down + closing
- —
- Monthly P&I
- —
- Monthly cashflow
- —
- DSCR
- —
- Eligible?
- —
No personal income docs; deal must DSCR.
Hard money
10% down · 12.0% · 12mo
- Down + closing
- —
- Monthly P&I
- —
- Monthly cashflow
- —
- DSCR
- —
- Eligible?
- —
Short-term bridge; refi at stabilization.
Rent comps 4 comps
| Address | Beds | Baths | Sqft | Rent | $/sqft | DOM | Units | Dist |
|---|---|---|---|---|---|---|---|---|
| 105 Harvest Hill Dr Broussard, LA | 4.0 | 2.0 | 1706 | $2,250 | $1.32 | 13d | 1 | 1.16mi |
| 711 E Main St #100 Broussard, LA | 3.0 | 2.0 | 1644 | $2,750 | $1.67 | 43d | 1 | 1.29mi |
| 231 Saint Nazaire Rd Broussard, LA | 1.0–3.0 | 1.0–2.0 | 1080 | $1,715 | $1.59 | 13d | 27 | 1.34mi |
| 232 Saint Nazaire Rd Broussard, LA | 1.0–3.0 | 1.0–2.0 | 1080 | $1,715 | $1.59 | 13d | 9 | 1.41mi |
Listing history 26 events
-
2026-06-18days on market $190,000 Active 15 DOM
-
2026-06-17days on market $190,000 Active 14 DOM
-
2026-06-16days on market $190,000 Active 13 DOM
-
2026-06-15days on market $190,000 Active 12 DOM
-
2026-06-14days on market $190,000 Active 10 DOM
-
2026-06-13days on market $190,000 Active 9 DOM
-
2026-06-10days on market $190,000 Active 7 DOM
-
2026-06-09days on market $190,000 Active 6 DOM
-
2026-06-08days on market $190,000 Active 5 DOM
-
2026-06-07days on market $190,000 Active 4 DOM
-
2026-06-05statusdays on market $190,000 Active 1 DOM
-
2026-06-03days on market $190,000 Coming Soon 12 DOM
-
2026-06-03price $190,000 Coming Soon 11 DOM
-
2026-06-02days on market $230,000 Coming Soon 11 DOM
-
2026-06-01days on market $230,000 Coming Soon 10 DOM
-
2026-05-31days on market $230,000 Coming Soon 9 DOM
-
2026-05-30days on market $230,000 Coming Soon 8 DOM
-
2026-05-22historical $230,000
-
2022-03-21soldstatus $205,000
-
2022-03-18soldstatus $205,000 18-char remark
Show marketing remark (18 chars)
Sold Before listed
-
2022-03-18$205,000 18-char remark
Show marketing remark (18 chars)
Sold Before listed
-
2008-06-04soldstatus
-
2008-05-30soldstatus $164,500 272-char remark
Show marketing remark (272 chars)
Well kept split floor plan home located in Broussard's established subdivision only minutes from the new Home Depot and Wal-Mart. Home offers laminated wood floors, freshly painted interiors and exterior. Nice landscaped yard. Home shows well, clean and ready for a buyer.
-
2008-04-05$165,900 272-char remark
Show marketing remark (272 chars)
Well kept split floor plan home located in Broussard's established subdivision only minutes from the new Home Depot and Wal-Mart. Home offers laminated wood floors, freshly painted interiors and exterior. Nice landscaped yard. Home shows well, clean and ready for a buyer.
-
1995-02-23soldstatus $100,000
-
1994-12-02$100,900
ⓘ Source: listings_history table (triggers on properties + properties_extension) + one-shot
backfill from property_details.listing_events for pre-trigger history.
Tax reassessment forecast LA · Resets to sale price
- Current annual tax
- $1,644 · $137/mo
- Projected year-2 tax
- $1,644 · $137/mo
- Expected delta
- $0/yr ($0/mo · 0.0%)
ⓘ Screening estimate from a state-policy table — verify with the county assessor before closing.
Climate risk First Street
- Flood 1/10 Low FEMA zone X (unshaded) · 0% chance over 30 yrs
- Wildfire 1/10 Low
- Heat 9/10 Extreme 7 d/yr ≥108°F today · 22 d/yr by 30 yrs out
- Wind 9/10 Extreme 99% chance of damaging wind over 30 yrs
- Air quality 2/10 Low 1 unhealthy d/yr today · 1 by 30 yrs out
Nearby sold comps map
Loading sold comps map…
Walkable amenities ~0.75 mi
Loading nearby amenities…
Taxation est. · year 1
- Rental income
- $25,476
- − Mortgage interest
- −$10,643
- − Property taxes
- −$1,644
- − Insurance
- −$950
- − Repairs & maintenance
- −$2,038
- − Management
- −$2,038
- − Depreciation
- −$5,527
- Taxable income
- $2,636
- Est. tax owed @ 24.0%
- −$633
- After-tax cash flow
- $4,943/yr
For passive investors: Depreciation is non-cash, so a rental often shows a tax loss while cash-flowing — sheltering income. Rental losses are passive: they offset passive income freely, and up to $25,000/yr can offset ordinary (W-2) income if you actively participate and your MAGI is under $100k (phasing out to $0 by $150k); unused losses carry forward. On sale, claimed depreciation is recaptured at up to 25%, and gains may owe capital-gains tax (a 1031 exchange can defer both). Figures are a year-1 estimate at your 24.0% rate — not tax advice; consult a CPA.
Schools (NCES district)
- District
- Lafayette Parish
- NCES district ID
- 2200870
- Math proficiency
- 38% ▼ -32.00%
- Reading proficiency
- 46% ▼ -24.00%
- Median HH income
- $50,238
- Composite
- 36.15/100
- National rank
- #4741
- State rank
- #19 of 98 in LA
Livability — Broussard
- Score
- 71/100
- State rank
- #49
- US rank
- #7184
Category grades
Schools grade is shown separately in the Schools card above.
Census & demographics
- County
- Lafayette Parish · 207,544 people
- City population
- 17,263
- Metro
- Lafayette, LA
- Population (ZIP)
- 17,263
- Household income
- $106,710
- Rent vs Own
- Severe rent burden
- 117.0
Population outlook (Lafayette County) Hauer SSP2
- Today (2025)
- 280,930 people
- By 2030
- 301,092 · +7.2%
- By 2040
- 339,456 · +20.8%
- By 2050
- 375,156 · +33.5%
- By 2075
- 451,672 · +60.8%
- By 2100
- 497,203 · +77.0%
Race, ethnicity, and origin ACS 2023
- Neighborhood character
- Predominantly White (74%)
- Race & ethnicity
- White 74% Black 15% Two or more races 5% Hispanic / Latino 5% Asian 3%
- Hispanic origin (detail)
- Mexican 1%
- Common ancestry
- Lithuanian 20% Romanian 2% Portuguese 1%
- Foreign-born
- 4% · Canada
- Languages at home
- 93% English-only · Spanish 3% Other Asian/Pacific 2% French/Haitian/Cajun 1%
Political lean MEDSL · Lafayette
- 2024 margin
- Solid R (+31.4) · D 33.5% · R 64.8% · Other 1.7%
- 2008→2024 swing
- -0.1pp no change · 2008: -31.3pp · 2024: -31.4pp
- All cycles
- 2024: R+31.4 2020: R+28.7 2016: R+33.6 2012: R+33.7 2008: R+31.3
Not yet ingested
- Civics
- —
Market trends
- HPI YoY
- ▼ -30.65%
- Current HPI
- 160.4167
- Rent YoY
- —
- Metro
- Lafayette, LA
- State GDP YoY
- ▲ 3.29%
- F500 in state
- 10
Industry mix (Fortune 500 HQ in LA)
| Industry | F500 HQs | Revenue |
|---|---|---|
| Telecommunications | 2 | $23B |
|
||
| Utilities | 1 | $12B |
|
||
| Wholesale / Distribution | 1 | $5B |
|
||
| Advertising | 1 | $2B |
|
||
Price history
+127.9% since first listed9 events — show timeline
- 2026-05-22 Coming Soon $230,000 AcadianaMLS
- 2022-03-21 Sold (Public Records) $205,000 Public Records
- 2022-03-18 Listed $205,000 AcadianaMLS
- 2022-03-18 Sold (MLS) $205,000 AcadianaMLS
- 2008-06-04 Sold (Public Records) — Public Records
- 2008-05-30 Sold (MLS) $164,500 AcadianaMLS
- 2008-04-05 Listed $165,900 AcadianaMLS
- 1995-02-23 Sold (MLS) $100,000 AcadianaMLS
- 1994-12-02 Listed $100,900 AcadianaMLS
Property tax history
+6.8%/yrLatest (2025): $1,644 · -1.3% YoY. Source: county tax records.
Cash-flow waterfall
monthlySold comps — $/sqft
last 12 mo · ≤1 miLoading sold comps…