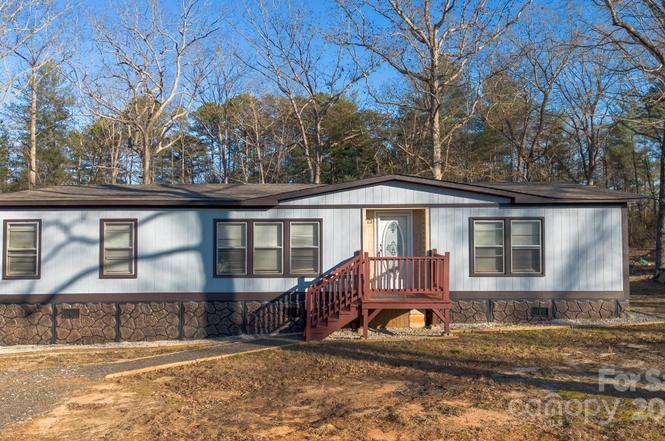
50 N Duncan Hill Ln · Bethlehem, NC
Flood risk 1/10 · Minimal
- FEMA flood zone
- X (unshaded)
- Chance of flooding over 30 yrs
- 0.0%
- Est. flood insurance / yr
- $507 – $1,088
Fire risk 5/10 · Moderate
- Est. fire insurance / yr
- $906 – $1,684
Heat risk 5/10 · Moderate
- Hot days now (above 102°F)
- 7 days/yr
- Hot days in 30 yrs
- 18 days/yr
Wind risk 2/10 · Minimal
- Chance of severe wind over 30 yrs
- 1.0%
Air-quality risk 2/10 · Minimal
- Unhealthy air days now
- 1 days/yr
- Unhealthy air days in 30 yrs
- 1 days/yr
Risk factors via First Street. Map © Google.
Why this score? — see what drove the C- grade
The composite is a weighted blend of 9 inputs, each scored 0–100. Each bar is that input's sub-score; the figure is the points it added to the 100-point composite (weight × sub-score).
- Cash flow +20.9/30.0
- ARV discount +7.5/15.0
- DSCR +6.6/10.0
- Schools +4.5/10.0
- 1% rule +4.3/10.0
- Livability +3.2/5.0
- Rent growth +2.5/5.0
- Condition / age +2.5/5.0
- Appreciation +0.0/10.0
$179,500
🖨 Deal sheet 📄 Offer letter ✓ Due diligence
Listing remarks
1031 Exchange Opportunity | Investment Property with Seller Financing Available. Investors seeking a 1031 exchange replacement property, rental investment, or portfolio addition near Hickory will want to explore 50 N Duncan Hill Ln in Taylorsville. This remodeled 3-bedroom, 2-bath home sits on over half an acre and offers flexible acquisition options rarely found at this price point. Conveniently located within a short drive of Hickory’s major medical facilities, shopping centers, and employment hubs, the property benefits from strong regional housing demand and accessibility—factors that support both long-term rental potential and resale value. Inside, the home features an open
Key facts
- Split-bedroom layout
- Large soaking tub
- 0.69 acre lot
Tags
Property features AI
Finance
- HOA & community: No HOA
Exterior
- Parking: Driveway
- Utilities: Public water; Septic installed
- Home design: Residential single-family manufactured doublewide; One level
- Construction: Manufactured construction; Vinyl exterior; Composition roof; Crawl space foundation; Built as a manufactured doublewide
- Exterior features: Cleared lot; Roads are dirt and paved; Publicly maintained road
Interior
- Kitchen: Oven; Refrigerator
- Bedrooms: 3 bedrooms on the main level
- Flooring: Vinyl flooring
- Bathrooms: 2 full bathrooms on the main level
- Heating & cooling: Heat pump heating; Central air conditioning
- Interior features: 5 total rooms; Oven, Refrigerator
- Laundry & utility: In-unit laundry
Neighborhood map
What this means for you Summary
Snapshot
- This is a 3-bed/2.0-bath manufactured listed at $180k.
Deal economics
- At list price, monthly cash flow is $249 ($3k/yr) — positive.
- The deal already cash-flows at list — no discount required.
- To meet the 1% rule (rent ≥ 1% of price), the offer needs to be $166k (7.4% below list).
- Recommended offer: $158k (12.0% below list) — sets the bar for market timing.
- Cap rate 8.0% vs local median 2.0% in Bethlehem — top-decile yield for the area; either an underpriced asset or a hidden risk that comps aren't pricing in. Stress-test before assuming the spread holds.
Location & tenants
- Location reads 65/100 on livability (#308 in NC) — a middle-class / working-renter tenant base. Strengths: crime A+, cost of living A+, housing A+; Watch: amenities F, commute F, health & safety F.
- Alexander County Schools (rural): math 52% / reading 55% proficiency, ranked #52 of 178 in NC (top 29%) — acceptable for families but not a draw, mixed tenant base, ~2y average lease.
- Zoned schools: Bethlehem Elementary (math 52% / reading 52%, grade C-, #354 of 1,410 statewide, top 28%, 458 students, 51% FRL); Alexander Central High (math 67% / reading 60%, grade B-, #175 of 535 statewide, top 33%, 1,312 students, 47% FRL).
- Market conditions: 135 active listings in the ZIP; 113 units permitted in Alexander County in 2024 (0 in 5+ unit buildings).
Forward outlook
- Local home prices are declining (-3.0%/yr); year-one equity from $1k of loan paydown is wiped out by about $5k of value loss. Plan a longer hold.
- Alexander County population projected at -18% by 2050 — secular population decline; favor cash flow + early exit over multi-decade hold.
Negotiation context
- It's been on market 164 days — a 12% lower offer ($158k) is reasonable based on typical stale-listing flexibility.
- Current owner paid $51k; list at $180k implies a 252% gain — meaningful room to come down on a strong offer.
Risks & watch-outs
- Climate carrying-cost: moderate wildfire risk; extreme-heat days projected 7→18/yr by 2055 (HVAC capex compounding) — expect insurance premiums to compound above CPI over the hold.
Questions for the listing agent
- It's been on market 164 days. Have you received any prior offers? Is the seller open to a 12% concession, seller financing, or rate buy-down credit?
- Why hasn't it sold? Are there any deal-killer items the seller is aware of (foundation, flood, title, zoning, code violations)?
- Is there a deadline driving the sale (1031 exchange, divorce, estate, relocation)? That informs how much negotiation room exists.
- Schools are F-rated, which usually means shorter tenancies and higher turnover. Who's the typical renter profile here, and what's been the actual vacancy rate?
- What's the average days-on-market for RENTAL listings here right now (not sales)? A rising rental-DOM trend means longer vacancies and softer asking-rent achievability than the comps imply.
- What's the recent tenant-quality profile in this submarket — average credit score on applications, eviction rate, late-payment / NSF rate, and stable-employment percentage? A property-management company in the area should have these aggregated.
- How much new for-sale + rental construction is in the pipeline within 1–3 miles? Heavy new supply typically softens prices + rents 12–24 months out; constrained supply supports both.
Investment metrics
- 1% rule
- 0.93% ✗
- Cap rate
- 7.96%
- Cash-on-cash
- 5.94%
- DSCR
- 1.26
- GRM
- 9.0
CMA / ARV
No comps found within radius.
Projected returns pro-forma
-3.0% appreciation · 3.0% rent growth · sell at horizon
- IRR
- -7.2%
- Equity multiple
- 0.73×
- Total profit
- $-13,321
- Equity at exit
- $26,764
- IRR
- 2.4%
- Equity multiple
- 1.17×
- Total profit
- $8,470
- Equity at exit
- $15,520
Cash invested: $50,260 (down + closing). Projections, not guarantees.
Landlord ↔ Tenant lean methodology
- Overall (STATE)
- 85 Strongly Landlord-Friendly
- State North Carolina
- 85 Strongly Landlord-Friendly · R+3
- County
- — inherits STATE
- City
- — inherits STATE
ZIP-level market 28681
- Home prices YoY
- -11.9%
- Active inventory
- 135
- Price-to-rent
- 9.0×
Monthly cashflow live
- Estimated rent
- $1,662 medium interval (Pro) →
- Mortgage (P&I)
- −$941
- Tax from tax record
- −$48 /mo · $575/yr
- Insurance
- −$75
- HOA
- −$0
- Vacancy / Maint / Mgmt
- −$349
- Net cashflow
- $249
Break-even live
UW: 25.0% down · 7.5% · 30yr · 1.5% tax · 5.0% vac · 8.0% maint · 8.0% mgmt
Financing live
Cash to close
- Down payment
- $44,875
- Closing costs
- $5,385
- Reserves months
- —
- Total cash needed
- —
Loan-product check · same deal, 3 products live
Conventional
25% down · 7.5% · 30yr
- Down + closing
- —
- Monthly P&I
- —
- Monthly cashflow
- —
- DSCR
- —
- Eligible?
- —
Personal DTI + credit; lowest rate.
DSCR
20% down · 8.5% · 30yr
- Down + closing
- —
- Monthly P&I
- —
- Monthly cashflow
- —
- DSCR
- —
- Eligible?
- —
No personal income docs; deal must DSCR.
Hard money
10% down · 12.0% · 12mo
- Down + closing
- —
- Monthly P&I
- —
- Monthly cashflow
- —
- DSCR
- —
- Eligible?
- —
Short-term bridge; refi at stabilization.
Listing history 18 events
-
2026-06-19days on market $179,500 Active 164 DOM
-
2026-06-18days on market $179,500 Active 163 DOM
-
2026-06-17days on market $179,500 Active 162 DOM
-
2026-06-16days on market $179,500 Active 161 DOM
-
2026-06-15days on market $179,500 Active 160 DOM
-
2026-06-14days on market $179,500 Active 158 DOM
-
2026-06-13days on market $179,500 Active 157 DOM
-
2026-06-10days on market $179,500 Active 155 DOM
-
2026-06-09days on market $179,500 Active 154 DOM
-
2026-06-08days on market $179,500 Active 153 DOM
-
2026-06-07days on market $179,500 Active 152 DOM
-
2026-06-03days on market $179,500 Active 148 DOM
-
2026-06-02days on market $179,500 Active 147 DOM
-
2026-06-01days on market $179,500 Active 146 DOM
-
2026-05-31days on market $179,500 Active 145 DOM
-
2026-05-30days on market $179,500 Active 144 DOM
-
2026-01-06$189,500 Active
-
2018-08-29soldstatus $51,000
ⓘ Source: listings_history table (triggers on properties + properties_extension) + one-shot
backfill from property_details.listing_events for pre-trigger history.
Tax reassessment forecast NC · Resets to sale price
- Current annual tax
- $575 · $48/mo
- Projected year-2 tax
- $1,472 · $123/mo
- Expected delta
- +$897/yr (+$75/mo · 155.9%)
ⓘ Screening estimate from a state-policy table — verify with the county assessor before closing.
Climate risk First Street
- Flood 1/10 Low FEMA zone X (unshaded) · 0% chance over 30 yrs
- Wildfire 5/10 Major
- Heat 5/10 Major 7 d/yr ≥102°F today · 18 d/yr by 30 yrs out
- Wind 2/10 Low 100% chance of damaging wind over 30 yrs
- Air quality 2/10 Low 1 unhealthy d/yr today · 1 by 30 yrs out
Nearby sold comps map
Loading sold comps map…
Walkable amenities ~0.75 mi
Loading nearby amenities…
Taxation est. · year 1
- Rental income
- $19,943
- − Mortgage interest
- −$10,055
- − Property taxes
- −$575
- − Insurance
- −$898
- − Repairs & maintenance
- −$1,595
- − Management
- −$1,595
- − Depreciation
- −$5,222
- Taxable income
- $2
- Est. tax owed @ 24.0%
- −$1
- After-tax cash flow
- $2,986/yr
For passive investors: Depreciation is non-cash, so a rental often shows a tax loss while cash-flowing — sheltering income. Rental losses are passive: they offset passive income freely, and up to $25,000/yr can offset ordinary (W-2) income if you actively participate and your MAGI is under $100k (phasing out to $0 by $150k); unused losses carry forward. On sale, claimed depreciation is recaptured at up to 25%, and gains may owe capital-gains tax (a 1031 exchange can defer both). Figures are a year-1 estimate at your 24.0% rate — not tax advice; consult a CPA.
Schools (NCES district)
- District
- Alexander County Schools
- NCES district ID
- 3700090
- Math proficiency
- 52% ▲ 5.00%
- Reading proficiency
- 55% ▲ 7.00%
- Median HH income
- $41,189
- Composite
- 44.84/100
- National rank
- #2732
- State rank
- #52 of 178 in NC
Livability — Bethlehem
- Score
- 65/100
- State rank
- #308
- US rank
- #12798
Category grades
Schools grade is shown separately in the Schools card above.
Census & demographics
- Population (ZIP)
- 26,117
Population outlook (Alexander County) Hauer SSP2
- Today (2025)
- 36,916 people
- By 2030
- 36,085 · -2.3%
- By 2040
- 33,528 · -9.2%
- By 2050
- 30,229 · -18.1%
- By 2075
- 23,159 · -37.3%
- By 2100
- 15,981 · -56.7%
Race, ethnicity, and origin ACS 2023
- Neighborhood character
- Predominantly White (88%)
- Race & ethnicity
- White 88% Black 5% Hispanic / Latino 5% Two or more races 3% Native American 1%
- Common ancestry
- Slovak 2% Romanian 1% Serbian 1%
- Foreign-born
- 2% · Canada, China
- Languages at home
- 94% English-only · Spanish 4% German/W. Germanic 1%
Political lean MEDSL · Alexander
- 2024 margin
- Solid R (+59.9) · D 19.7% · R 79.5%
- 2008→2024 swing
- -21.5pp toward R · 2008: -38.4pp · 2024: -59.9pp
- All cycles
- 2024: R+59.9 2020: R+58.0 2016: R+55.9 2012: R+44.6 2008: R+38.4
Not yet ingested
- Civics
- —
Market trends
- HPI YoY
- ▼ -30.79%
- Current HPI
- 227.497
- Rent YoY
- —
- Metro
- —
- State GDP YoY
- ▲ 3.28%
- F500 in state
- 26
Industry mix (Fortune 500 HQ in NC)
| Industry | F500 HQs | Revenue |
|---|---|---|
| Financial Services | 2 | $213B |
|
||
| Retail | 2 | $95B |
|
||
| Industrial Conglomerate | 1 | $38B |
|
||
| Metals / Steel | 1 | $35B |
|
||
| Utilities | 1 | $30B |
|
||
| Industrial Machinery | 1 | $19B |
|
||
Price history
+271.6% since first listed2 events — show timeline
- 2026-01-06 Listed $189,500 CANOPYMLS as Distributed by MLS Grid
- 2018-08-29 Sold (Public Records) $51,000 Public Records
Property tax history
+20.5%/yrLatest (2025): $575 · +33.7% YoY. Source: county tax records.
Cash-flow waterfall
monthlySold comps — $/sqft
last 12 mo · ≤1 miLoading sold comps…