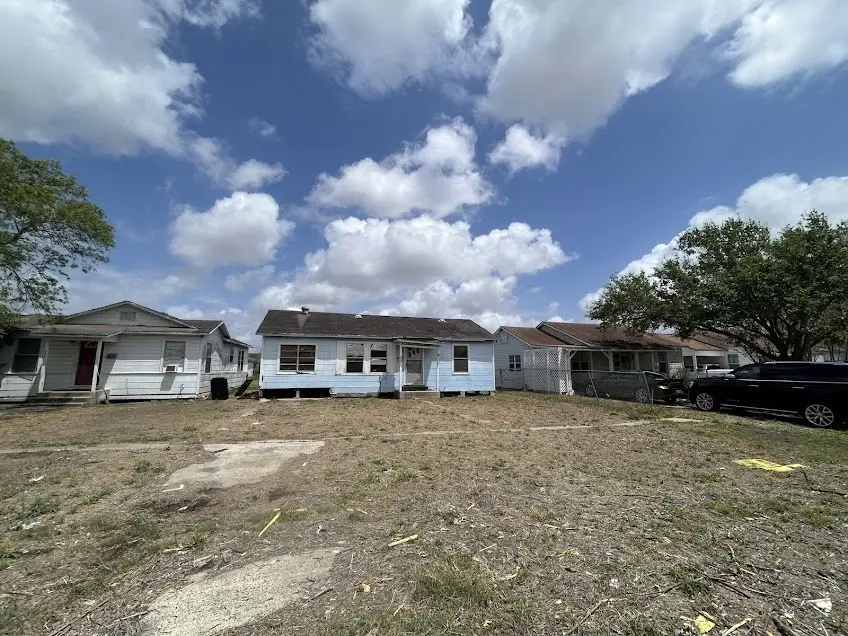
407 E 2nd St · Bishop, TX
Flood risk 6/10 · Moderate
- FEMA flood zone
- AE
- Chance of flooding over 30 yrs
- 0.75%
- Est. flood insurance / yr
- $1,737 – $8,500
Fire risk 1/10 · Minimal
- Est. fire insurance / yr
- $1,222 – $2,270
Heat risk 9/10 · Severe
- Hot days now (above 111°F)
- 7 days/yr
- Hot days in 30 yrs
- 22 days/yr
Wind risk 9/10 · Severe
- Chance of severe wind over 30 yrs
- 99.0%
Air-quality risk 1/10 · Minimal
- Unhealthy air days now
- 0 days/yr
- Unhealthy air days in 30 yrs
- 0 days/yr
Risk factors via First Street. Map © Google.
Why this score? — see what drove the A- grade
The composite is a weighted blend of 9 inputs, each scored 0–100. Each bar is that input's sub-score; the figure is the points it added to the 100-point composite (weight × sub-score).
- Cash flow +30.0/30.0
- ARV discount +15.0/15.0
- 1% rule +10.0/10.0
- DSCR +10.0/10.0
- Appreciation +7.9/10.0
- Livability +3.7/5.0
- Schools +3.1/10.0
- Rent growth +2.5/5.0
- Condition / age +2.5/5.0
$69,999
🖨 Deal sheet 📄 Offer letter ✓ Due diligence
Listing remarks MLS
INVESTORS! We just listed this 1-story, 3-bedroom, 1-bath home that is located in a modest neighborhood in Bishop, Texas. It is just 5 minutes from local dining and gas stations and offers both convenience and accessibility. The home does need some repairs, but it presents a great opportunity for those looking to invest or create their dream space in the heart of Bishop. We also have two other homes available in the Bishop Area. You can buy just one or get a PACKAGE DEAL and buy all three properties. They are located at 407 East 2nd Street; 123 West Oregon Street; and 505 North Francis Street get all three for a Package Price of $129,999. WE MAKE IT EASY TO OWN. This is a great opportunity! Don't wait, call us today to get more information on the owner's easy terms and smooth process to make this your dream investment.
Key facts
- 8,999 sq ft lot
- Built 1980
- Listed 181 days
Neighborhood map
What this means for you Summary
Snapshot
- This is a 3-bed/1.0-bath single-family listed at $70k.
Deal economics
- At list price, monthly cash flow is $-1 ($-16/yr) — negative.
- To cash-flow at today's rent, offer at most $70k (0.3% below list).
- Meets the 1% rule at list price ($1k rent vs $70k).
- Recommended offer: $62k (12.0% below list) — sets the bar for market timing.
Location & tenants
- Location reads 74/100 on livability (#189 in TX, #4,857 nationally) — a middle-class / working-renter tenant base. Strengths: crime A+, cost of living A+, housing A+; Watch: amenities F, commute F, employment F.
- Bishop CISD (town): math 31% / reading 42% proficiency, ranked #486 of 826 in TX (top 59%) — families likely to look elsewhere, expect single-tenant / working-renter base with shorter leases.
- Market conditions: 39 active listings in the ZIP; 1,397 units permitted in Nueces County in 2024 (47 in 5+ unit buildings).
Forward outlook
- In year one you build about $5k of equity ($484 loan paydown + $4k appreciation (5.8% local appreciation)).
- Nueces County population projected at +36% by 2050 — long-run rental-demand tailwind backs the buy-and-hold thesis.
- At projected returns (5.8% appreciation + 3.0% rent growth), your $20k cash investment doubles in ~4 years — after that, you're playing with house money.
- By year 8, paydown + projected appreciation supports a ~$35k cash-out refi (75% LTV) — recoverable capital for the next deal without selling this one.
Negotiation context
- It's been on market 181 days — a 12% lower offer ($62k) is reasonable based on typical stale-listing flexibility.
- 2 sale attempts since 25y ago with the ask held roughly flat each time — persistent listings suggest the price (not the market) is what's stuck; bring a comps-based counter.
- Current owner paid $13k; list at $70k implies a 440% gain — meaningful room to come down on a strong offer.
Risks & watch-outs
- Watch-outs: flood insurance adds $427/mo.
- Climate carrying-cost: in FEMA flood zone AE (mandatory federal flood insurance); severe wind risk, 99% chance of damaging wind over 30y; extreme-heat days projected 7→22/yr by 2055 (HVAC capex compounding) — expect insurance premiums to compound above CPI over the hold.
Questions for the listing agent
- What do current leases actually rent for vs. the listed asking? Can we see a recent rent roll and the last 12 months of T-12 income?
- It's been on market 181 days. Have you received any prior offers? Is the seller open to a 12% concession, seller financing, or rate buy-down credit?
- What's the actual annual flood-insurance premium (NFIP or private), and is the property in a SFHA with mandatory coverage?
- Why hasn't it sold? Are there any deal-killer items the seller is aware of (foundation, flood, title, zoning, code violations)?
- Is there a deadline driving the sale (1031 exchange, divorce, estate, relocation)? That informs how much negotiation room exists.
- What's the average days-on-market for RENTAL listings here right now (not sales)? A rising rental-DOM trend means longer vacancies and softer asking-rent achievability than the comps imply.
- What's the recent tenant-quality profile in this submarket — average credit score on applications, eviction rate, late-payment / NSF rate, and stable-employment percentage? A property-management company in the area should have these aggregated.
- How much new for-sale + rental construction is in the pipeline within 1–3 miles? Heavy new supply typically softens prices + rents 12–24 months out; constrained supply supports both.
Investment metrics
- 1% rule
- 1.62% ✓
- Cap rate
- 13.58%
- Cash-on-cash
- 26.03%
- DSCR
- 2.16
- GRM
- 5.1
CMA / ARV
- ARV (median comp)
- $93,981
- List price
- $69,999
- Delta
- -25.52%
- Verdict
- UNDERPRICED
- Comps
- 20 within 1.0 mi
Show comp detail 4 sales within ~0.75 mi
| Address | Dist | Beds/Ba | Sqft | Sold | Price | $/sf | Match |
|---|---|---|---|---|---|---|---|
| 308 Hickory Ct | 0.24mi | 2/1.0 (-1) | 972 (-3%) | 1mo | $150,000 | $154 | 79 |
| 304 W 1st St | 0.49mi | 4/1.0 (+1) | 1,080 (+8%) | 13mo | $52,250 | $48 | 48 |
| 207 E 5th St | 0.36mi | 4/2.0 (+1) | 1,092 (+9%) | 20mo | $79,900 | $73 | 42 |
| 413 W 2nd St | 0.60mi | 2/1.0 (-1) | 864 (-14%) | 22mo | $77,500 | $90 | 26 |
Match score weights: distance 35% · size 25% · config 20% · recency 20%. Top-matched comps best support the ARV.
Projected returns pro-forma
5.82% appreciation · 3.0% rent growth · sell at horizon
- IRR
- 15.0%
- Equity multiple
- 2.00×
- Total profit
- $19,647
- Equity at exit
- $43,205
- IRR
- 15.4%
- Equity multiple
- 3.99×
- Total profit
- $58,602
- Equity at exit
- $77,669
Cash invested: $19,600 (down + closing). Projections, not guarantees.
Landlord ↔ Tenant lean methodology
- Overall (STATE)
- 87 Strongly Landlord-Friendly
- State Texas
- 87 Strongly Landlord-Friendly · R+5
- County
- — inherits STATE
- City
- — inherits STATE
ZIP-level market 78343
- Home prices YoY
- 5.5%
- Active inventory
- 39
- Price-to-rent
- 5.1×
Monthly cashflow live
- Estimated rent
- $1,135 medium interval (Pro) →
- Mortgage (P&I)
- −$367
- Tax from tax record
- −$75 /mo · $905/yr
- Insurance
- −$29
- Flood insurance flood zone
- −$427 /mo · $5,118/yr
- HOA
- −$0
- Vacancy / Maint / Mgmt
- −$238
- Net cashflow
- $-1
Break-even live
UW: 25.0% down · 7.5% · 30yr · 1.5% tax · 5.0% vac · 8.0% maint · 8.0% mgmt
Financing live
Cash to close
- Down payment
- $17,500
- Closing costs
- $2,100
- Reserves months
- —
- Total cash needed
- —
Loan-product check · same deal, 3 products live
Conventional
25% down · 7.5% · 30yr
- Down + closing
- —
- Monthly P&I
- —
- Monthly cashflow
- —
- DSCR
- —
- Eligible?
- —
Personal DTI + credit; lowest rate.
DSCR
20% down · 8.5% · 30yr
- Down + closing
- —
- Monthly P&I
- —
- Monthly cashflow
- —
- DSCR
- —
- Eligible?
- —
No personal income docs; deal must DSCR.
Hard money
10% down · 12.0% · 12mo
- Down + closing
- —
- Monthly P&I
- —
- Monthly cashflow
- —
- DSCR
- —
- Eligible?
- —
Short-term bridge; refi at stabilization.
Listing history 20 events
-
2026-06-18days on market $69,999 Active 181 DOM
-
2026-06-17days on market $69,999 Active 180 DOM
-
2026-06-16days on market $69,999 Active 179 DOM
-
2026-06-15days on market $69,999 Active 178 DOM
-
2026-06-14days on market $69,999 Active 176 DOM
-
2026-06-13days on market $69,999 Active 175 DOM
-
2026-06-10days on market $69,999 Active 173 DOM
-
2026-06-09days on market $69,999 Active 172 DOM
-
2026-06-08days on market $69,999 Active 171 DOM
-
2026-06-07days on market $69,999 Active 170 DOM
-
2026-06-03days on market $69,999 Active 166 DOM
-
2026-06-02days on market $69,999 Active 165 DOM
-
2026-06-01days on market $69,999 Active 164 DOM
-
2026-05-31days on market $69,999 Active 163 DOM
-
2026-05-30days on market $69,999 Active 162 DOM
-
2025-12-19$69,999 Active 830-char remark
Show marketing remark (830 chars)
INVESTORS! We just listed this 1-story, 3-bedroom, 1-bath home that is located in a modest neighborhood in Bishop, Texas. It is just 5 minutes from local dining and gas stations and offers both convenience and accessibility. The home does need some repairs, but it presents a great opportunity for those looking to invest or create their dream space in the heart of Bishop. We also have two other homes available in the Bishop Area. You can buy just one or get a PACKAGE DEAL and buy all three properties. They are located at 407 East 2nd Street; 123 West Oregon Street; and 505 North Francis Street get all three for a Package Price of $129,999. WE MAKE IT EASY TO OWN. This is a great opportunity! Don't wait, call us today to get more information on the owner's easy terms and smooth process to make this your dream investment.
-
2005-07-19soldstatus
-
2001-04-30soldstatus 116-char remark
Show marketing remark (116 chars)
INVESTOR/HANDYMAN SPECIAL USE VA ADDENDIUMS LOCKBOX CODE IS 0944 VA VENDEE-NO FINANCING AVIALABLE PM# 461960
-
2001-04-03soldstatus $12,956
-
2001-01-25$16,200 116-char remark
Show marketing remark (116 chars)
INVESTOR/HANDYMAN SPECIAL USE VA ADDENDIUMS LOCKBOX CODE IS 0944 VA VENDEE-NO FINANCING AVIALABLE PM# 461960
ⓘ Source: listings_history table (triggers on properties + properties_extension) + one-shot
backfill from property_details.listing_events for pre-trigger history.
Tax reassessment forecast TX · Resets to sale price
- Current annual tax
- $905 · $75/mo
- Projected year-2 tax
- $1,281 · $107/mo
- Expected delta
- +$376/yr (+$31/mo · 41.5%)
ⓘ Screening estimate from a state-policy table — verify with the county assessor before closing.
Climate risk First Street
- Flood 6/10 Major FEMA zone AE · 75% chance over 30 yrs
- Wildfire 1/10 Low
- Heat 9/10 Extreme 7 d/yr ≥111°F today · 22 d/yr by 30 yrs out
- Wind 9/10 Extreme 99% chance of damaging wind over 30 yrs
- Air quality 1/10 Low 0 unhealthy d/yr today · 0 by 30 yrs out
Nearby sold comps map
Loading sold comps map…
Walkable amenities ~0.75 mi
Loading nearby amenities…
Taxation est. · year 1
- Rental income
- $13,624
- − Mortgage interest
- −$3,921
- − Property taxes
- −$905
- − Insurance
- −$5,468
- − Repairs & maintenance
- −$1,090
- − Management
- −$1,090
- − Depreciation
- −$2,036
- Taxable loss
- −$887
- Est. tax savings @ 24.0%
- +$213
- After-tax cash flow
- $197/yr
For passive investors: Depreciation is non-cash, so a rental often shows a tax loss while cash-flowing — sheltering income. Rental losses are passive: they offset passive income freely, and up to $25,000/yr can offset ordinary (W-2) income if you actively participate and your MAGI is under $100k (phasing out to $0 by $150k); unused losses carry forward. On sale, claimed depreciation is recaptured at up to 25%, and gains may owe capital-gains tax (a 1031 exchange can defer both). Figures are a year-1 estimate at your 24.0% rate — not tax advice; consult a CPA.
Schools (NCES district)
- District
- Bishop CISD
- NCES district ID
- 4810260
- Math proficiency
- 31% ▼ -33.00%
- Reading proficiency
- 42% ▼ -12.00%
- Median HH income
- $46,296
- Composite
- 31.2/100
- National rank
- #6044
- State rank
- #486 of 826 in TX
Livability — Bishop
- Score
- 74/100
- State rank
- #189
- US rank
- #4857
Category grades
Schools grade is shown separately in the Schools card above.
Census & demographics
- Census place
- Bishop, TX
- Population (ZIP)
- 4,565
Population outlook (Nueces County) Hauer SSP2
- Today (2025)
- 418,037 people
- By 2030
- 447,123 · +7.0%
- By 2040
- 505,911 · +21.0%
- By 2050
- 567,522 · +35.8%
- By 2075
- 729,686 · +74.6%
- By 2100
- 847,087 · +102.6%
Race, ethnicity, and origin ACS 2023
- Neighborhood character
- Predominantly Hispanic (70%)
- Race & ethnicity
- Hispanic / Latino 70% Two or more races 28% White 22% Black 7%
- Hispanic origin (detail)
- Mexican 66%
- Common ancestry
- Iranian 1% Slovak 1% Lithuanian 1%
- Foreign-born
- 8% · Canada
- Languages at home
- 60% English-only · Spanish 40%
Political lean MEDSL · Nueces
- 2024 margin
- R (+11.5) · D 43.8% · R 55.3%
- 2008→2024 swing
- -7.1pp toward R · 2008: -4.4pp · 2024: -11.5pp
- All cycles
- 2024: R+11.5 2020: R+2.9 2016: R+1.5 2012: R+3.2 2008: R+4.4
Not yet ingested
- Civics
- —
Market trends
- HPI YoY
- ▲ 5.82%
- Current HPI
- 111.5556
- Rent YoY
- —
- Metro
- —
- State GDP YoY
- ▲ 3.95%
- F500 in state
- 110
Industry mix (Fortune 500 HQ in TX)
| Industry | F500 HQs | Revenue |
|---|---|---|
| Energy | 16 | $1,198B |
|
||
| Technology | 5 | $198B |
|
||
| Engineering / Construction | 4 | $72B |
|
||
| Energy Services | 3 | $60B |
|
||
| Utilities | 3 | $41B |
|
||
| Healthcare | 2 | $330B |
|
||
Price history
+332.1% since first listed5 events — show timeline
- 2025-12-19 Listed $69,999 HARMLS
- 2005-07-19 Sold (Public Records) — Public Records
- 2001-04-30 Sold (MLS) — CBMLS
- 2001-04-03 Sold (Public Records) $12,956 Public Records
- 2001-01-25 Listed $16,200 CBMLS
Property tax history
-4.8%/yrLatest (2025): $905 · -50.7% YoY. Source: county tax records.
Cash-flow waterfall
monthlySold comps — $/sqft
last 12 mo · ≤1 miLoading sold comps…