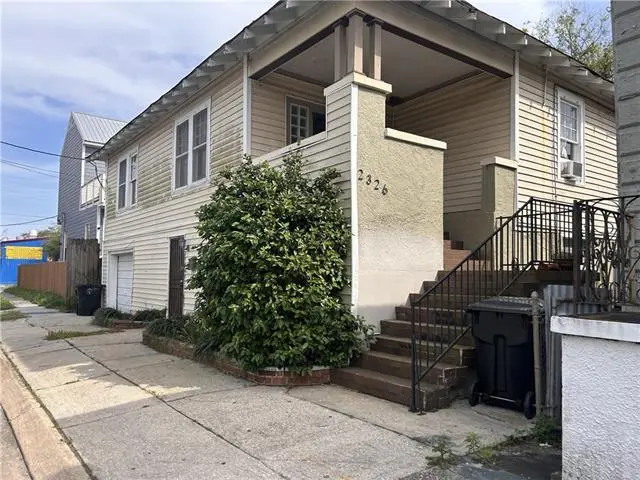
2326 N Derbigny St · New Orleans, LA
Flood risk 8/10 · Major
- FEMA flood zone
- X
- Chance of flooding over 30 yrs
- 0.6%
- Est. flood insurance / yr
- $507 – $1,088
Fire risk 1/10 · Minimal
- Est. fire insurance / yr
- $1,269 – $2,357
Heat risk 10/10 · Severe
- Hot days now (above 108°F)
- 7 days/yr
- Hot days in 30 yrs
- 21 days/yr
Wind risk 10/10 · Severe
- Chance of severe wind over 30 yrs
- 99.0%
Air-quality risk 4/10 · Minor
- Unhealthy air days now
- 4 days/yr
- Unhealthy air days in 30 yrs
- 4 days/yr
Risk factors via First Street. Map © Google.
Why this score? — see what drove the C grade
The composite is a weighted blend of 9 inputs, each scored 0–100. Each bar is that input's sub-score; the figure is the points it added to the 100-point composite (weight × sub-score).
- Cash flow +23.5/30.0
- DSCR +7.6/10.0
- ARV discount +7.5/15.0
- 1% rule +6.0/10.0
- Livability +4.0/5.0
- Rent growth +3.1/5.0
- Condition / age +2.5/5.0
- Schools +1.6/10.0
- Appreciation +0.0/10.0
$139,000
🖨 Deal sheet 📄 Offer letter ✓ Due diligence
Listing remarks MLS
Calling Investors, Contractors, and Developers Looking for a Special House in a Rapidly Growing Area! Unlock the potential of this value-add opportunity located in one of New Orleans’ most trending and transforming neighborhoods. This property is ready for a full makeover by an investor, contractor, or developer looking to capitalize on strong upside. Sellers are relocating to another state. Positioned just minutes from the French Quarter, with quick access to major travel routes, shopping, dining, and everyday conveniences, this location offers both lifestyle appeal and long-term value. With the right vision, this property can be transformed into a high-demand rental, resale flip, or custom redevelopment project. Opportunities like this—in a prime, centrally located area—are becoming increasingly rare. READY FOR A NEW OWNER
Key facts
- Quick access
- Built 1960
- Listed 70 days
Tags
Neighborhood map
What this means for you Summary
Snapshot
- This is a 2-bed/1.5-bath single-family listed at $139k.
Deal economics
- At list price, monthly cash flow is $194 ($2k/yr) — positive.
- The deal already cash-flows at list — no discount required.
- Meets the 1% rule at list price ($2k rent vs $139k).
- Recommended offer: $131k (6.0% below list) — sets the bar for market timing.
- Cap rate 8.5% vs local median 4.4% in New Orleans — top-decile yield for the area; either an underpriced asset or a hidden risk that comps aren't pricing in. Stress-test before assuming the spread holds.
Location & tenants
- Location reads 81/100 on livability (#3 in LA, #1,383 nationally) — a professional / high-income tenant draw. Strengths: amenities A+, commute A+, health & safety A+; Watch: crime C-, employment D.
- Orleans Parish (urban): math 11% / reading 27% proficiency, ranked #69 of 98 in LA (top 70%) — low school quality limits family demand, transient renter base, plan for 1-2y turnover; 68% free/reduced lunch — lower-income household profile, screen leases tightly.
- Market conditions: Rents rising (+2.5%/yr); 581 active listings in the ZIP; 40 comparable units currently listed for rent nearby; rentals at typical pace (median 20d on market — plan ~3-4 weeks tenant-placement turnaround); 710 units permitted in Orleans Parish in 2024 (244 in 5+ unit buildings).
- This rent runs 40% of the median local income ($46k/yr) — at the standard rent-burdened threshold; future hikes will face affordability resistance.
Forward outlook
- Local home prices are declining (-3.0%/yr); year-one equity from $961 of loan paydown is wiped out by about $4k of value loss. Plan a longer hold.
- Orleans County population projected at +61% by 2050 — long-run rental-demand tailwind backs the buy-and-hold thesis.
Negotiation context
- It's been on market 70 days — a 6% lower offer ($131k) is reasonable based on typical stale-listing flexibility.
- 4 sale attempts since 11y ago with the ask held roughly flat each time — persistent listings suggest the price (not the market) is what's stuck; bring a comps-based counter.
- Current owner paid $105k; 32% above their basis — modest negotiation headroom, anchor on the comps not their cost.
Risks & watch-outs
- Watch-outs: flood insurance adds $66/mo.
- Climate carrying-cost: severe flood risk; severe wind risk, 99% chance of damaging wind over 30y; extreme-heat days projected 7→21/yr by 2055 (HVAC capex compounding) — expect insurance premiums to compound above CPI over the hold.
Questions for the listing agent
- It's been on market 70 days. Have you received any prior offers? Is the seller open to a 6% concession, seller financing, or rate buy-down credit?
- Built in 1960 — when were the roof, HVAC, electrical panel, plumbing, and water heater last replaced?
- What's the actual annual flood-insurance premium (NFIP or private), and is the property in a SFHA with mandatory coverage?
- Why hasn't it sold? Are there any deal-killer items the seller is aware of (foundation, flood, title, zoning, code violations)?
- Is there a deadline driving the sale (1031 exchange, divorce, estate, relocation)? That informs how much negotiation room exists.
- What's the average days-on-market for RENTAL listings here right now (not sales)? A rising rental-DOM trend means longer vacancies and softer asking-rent achievability than the comps imply.
- What's the recent tenant-quality profile in this submarket — average credit score on applications, eviction rate, late-payment / NSF rate, and stable-employment percentage? A property-management company in the area should have these aggregated.
- How much new for-sale + rental construction is in the pipeline within 1–3 miles? Heavy new supply typically softens prices + rents 12–24 months out; constrained supply supports both.
Investment metrics
- 1% rule
- 1.10% ✓
- Cap rate
- 8.54%
- Cash-on-cash
- 8.02%
- DSCR
- 1.36
- GRM
- 7.5
CMA / ARV
- ARV (median comp)
- $324,073
- List price
- $139,000
- Delta
- -57.11%
- Verdict
- UNDERPRICED
- Comps
- 20 within 1.0 mi
Show comp detail 12 sales within ~0.75 mi
| Address | Dist | Beds/Ba | Sqft | Sold | Price | $/sf | Match |
|---|---|---|---|---|---|---|---|
| 2613 N Villere St | 0.38mi | 1/1.0 (-1) | 1,312 (-2%) | 3mo | $90,000 | $69 | 69 |
| 2320 Marais St | 0.37mi | 2/2.0 | 1,280 (-5%) | 5mo | $250,000 | $195 | 69 |
| 1625 Frenchmen St | 0.25mi | 3/2.0 (+1) | 1,252 (-7%) | 5mo | $170,000 | $136 | 66 |
| 919 Franklin Ave | 0.57mi | 2/1.5 | 1,414 (+5%) | 4mo | $430,000 | $304 | 61 |
| 1609 Marais St | 0.65mi | 3/2.0 (+1) | 1,345 (+0%) | 4mo | $245,000 | $182 | 59 |
| 1230 Annette St | 0.66mi | 3/2.0 (+1) | 1,309 (-2%) | 2mo | $280,000 | $214 | 57 |
| 1037 Port St | 0.54mi | 2/1.0 | 1,461 (+9%) | 3mo | $395,000 | $270 | 56 |
| 1014 Music St | 0.48mi | 2/2.0 | 1,214 (-10%) | 5mo | $269,000 | $222 | 56 |
| 930 Port St | 0.58mi | 2/2.0 | 1,477 (+10%) | 1mo | $352,000 | $238 | 53 |
| 1431 Clouet St | 0.72mi | 3/2.0 (+1) | 1,404 (+5%) | 1mo | $307,000 | $219 | 51 |
| 2618 N Rocheblave St | 0.52mi | 3/2.0 (+1) | 1,168 (-13%) | 1mo | $115,000 | $98 | 46 |
| 621 Franklin Ave | 0.74mi | 2/2.0 | 1,192 (-11%) | 2mo | $550,000 | $461 | 43 |
Match score weights: distance 35% · size 25% · config 20% · recency 20%. Top-matched comps best support the ARV.
Projected returns pro-forma
-3.0% appreciation · 2.49% rent growth · sell at horizon
- IRR
- -7.6%
- Equity multiple
- 0.72×
- Total profit
- $-10,918
- Equity at exit
- $20,725
- IRR
- 1.3%
- Equity multiple
- 1.09×
- Total profit
- $3,426
- Equity at exit
- $12,018
Cash invested: $38,920 (down + closing). Projections, not guarantees.
Landlord ↔ Tenant lean methodology
- Overall (STATE)
- 90 Strongly Landlord-Friendly
- State Louisiana
- 90 Strongly Landlord-Friendly · R+12
- County
- — inherits STATE
- City
- — inherits STATE
ZIP-level market 70117
- Rents YoY
- 2.5%
- Active inventory
- 581
- Price-to-rent
- 7.5×
Monthly cashflow live
- Estimated rent
- $1,536 high interval (Pro) →
- Mortgage (P&I)
- −$729
- Tax from tax record
- −$166 /mo · $1,994/yr
- Insurance
- −$58
- Flood insurance flood zone
- −$66 /mo · $798/yr
- HOA
- −$0
- Vacancy / Maint / Mgmt
- −$322
- Net cashflow
- $194
Break-even live
UW: 25.0% down · 7.5% · 30yr · 1.5% tax · 5.0% vac · 8.0% maint · 8.0% mgmt
Financing live
Cash to close
- Down payment
- $34,750
- Closing costs
- $4,170
- Reserves months
- —
- Total cash needed
- —
Loan-product check · same deal, 3 products live
Conventional
25% down · 7.5% · 30yr
- Down + closing
- —
- Monthly P&I
- —
- Monthly cashflow
- —
- DSCR
- —
- Eligible?
- —
Personal DTI + credit; lowest rate.
DSCR
20% down · 8.5% · 30yr
- Down + closing
- —
- Monthly P&I
- —
- Monthly cashflow
- —
- DSCR
- —
- Eligible?
- —
No personal income docs; deal must DSCR.
Hard money
10% down · 12.0% · 12mo
- Down + closing
- —
- Monthly P&I
- —
- Monthly cashflow
- —
- DSCR
- —
- Eligible?
- —
Short-term bridge; refi at stabilization.
Rent comps 40 comps
| Address | Beds | Baths | Sqft | Rent | $/sqft | DOM | Units | Dist |
|---|---|---|---|---|---|---|---|---|
| 2271 N Derbigny St New Orleans, LA | 2.0 | 2.0 | 1000 | $1,585 | $1.58 | 16d | 1 | 0.07mi |
| 2269 N Derbigny St New Orleans, LA | 2.0 | 2.0 | 1000 | $1,665 | $1.67 | 16d | 1 | 0.07mi |
| 2269 N Derbigny St New Orleans, LA | 2.0 | 2.0 | 1000 | $1,675 | $1.68 | 19d | 1 | 0.07mi |
| 1726 Mandeville St New Orleans, LA | 2.0 | 1.0 | 920 | $1,300 | $1.41 | 23d | 1 | 0.08mi |
| 1601 Marigny St Unit 1603 New Orleans, LA | 3.0 | 2.0 | 988 | $1,099 | $1.11 | 3d | 1 | 0.13mi |
| 1603 Marigny St New Orleans, LA | 3.0 | 2.0 | 988 | $1,099 | $1.11 | 3d | 1 | 0.13mi |
| 1710 Marigny St New Orleans, LA | 3.0 | 2.0 | 1120 | $1,750 | $1.56 | 23d | 1 | 0.14mi |
| 1636 Music St New Orleans, LA | 3.0 | 1.0 | 900 | $1,185 | $1.32 | 15d | 1 | 0.14mi |
| 1638 Music St New Orleans, LA | 2.0 | 1.0 | 900 | $1,085 | $1.21 | 14d | 1 | 0.14mi |
| 1809 Saint Roch Ave New Orleans, LA | 3.0 | 1.0 | 949 | $1,195 | $1.26 | 16d | 1 | 0.14mi |
| 2220 N Prieur St New Orleans, LA | 3.0 | 2.0 | 1334 | $2,000 | $1.50 | 23d | 1 | 0.19mi |
| 2024 Mandeville St New Orleans, LA | 2.0 | 2.0 | 1072 | $1,950 | $1.82 | 23d | 1 | 0.25mi |
| 2519 N Derbigny St New Orleans, LA | 3.0 | 1.0 | 994 | $1,300 | $1.31 | 21d | 1 | 0.25mi |
| 1910 Elysian Fields Ave New Orleans, LA | 3.0 | 1.0 | 1000 | $1,450 | $1.45 | 23d | 1 | 0.27mi |
| 2115 Mandeville St New Orleans, LA | 3.0 | 2.0 | 1400 | $1,650 | $1.18 | 23d | 1 | 0.30mi |
| 2120 Saint Roch Ave Unit 2120 New Orleans, LA | 2.0 | 1.0 | 1000 | $1,650 | $1.65 | 23d | 1 | 0.31mi |
| 1924 Painters St New Orleans, LA | 3.0 | 1.0 | 920 | $1,700 | $1.85 | 3d | 1 | 0.31mi |
| 1922 Painters St New Orleans, LA | 3.0 | 1.0 | 920 | $1,700 | $1.85 | 3d | 1 | 0.31mi |
| 1239 Saint Roch Ave New Orleans, LA | 2.0 | 2.0 | 1500 | $2,150 | $1.43 | 3d | 1 | 0.32mi |
| 2115 Elysian Fields Ave Unit 2115 New Orleans, LA | 3.0 | 1.0 | 1100 | $1,450 | $1.32 | 23d | 1 | 0.35mi |
| 2522 N Galvez St New Orleans, LA | 3.0 | 2.0 | 1105 | $1,675 | $1.52 | 23d | 1 | 0.37mi |
| 1327 Frenchmen St Unit B New Orleans, LA | 2.0 | 2.5 | 1175 | $1,900 | $1.62 | 23d | 1 | 0.37mi |
| 2524 N Galvez St New Orleans, LA | 3.0 | 2.5 | 1102 | $1,800 | $1.63 | 16d | 1 | 0.37mi |
| 2222 Saint Roch Ave New Orleans, LA | 3.0 | 1.0 | 900 | $1,200 | $1.33 | 23d | 1 | 0.38mi |
| 2103 Urquhart St New Orleans, LA | 2.0 | 1.0 | 940 | $1,299 | $1.38 | 23d | 1 | 0.39mi |
| 1301 Frenchmen St Unit 2B New Orleans, LA | 2.0 | 1.0 | 940 | $1,299 | $1.38 | 23d | 1 | 0.39mi |
| 2229 Saint Roch Ave New Orleans, LA | 2.0 | 1.5 | 1200 | $1,600 | $1.33 | 20d | 1 | 0.40mi |
| 1923 N Robertson St New Orleans, LA | 3.0 | 2.0 | 1051 | $1,950 | $1.86 | 3d | 1 | 0.40mi |
| 1226 Port St New Orleans, LA | 3.0 | 1.0 | 1023 | $1,650 | $1.61 | 23d | 1 | 0.44mi |
| 2104 Marais St Unit 2106 New Orleans, LA | 2.0 | 2.0 | 936 | $2,000 | $2.14 | 23d | 1 | 0.46mi |
| 2556 N Tonti St New Orleans, LA | 3.0 | 2.0 | 1100 | $1,850 | $1.68 | 15d | 1 | 0.46mi |
| 2003 Almonaster Ave New Orleans, LA | 3.0 | 2.0 | 988 | $1,600 | $1.62 | 23d | 1 | 0.47mi |
| 1136 Frenchmen St New Orleans, LA | 2.0 | 1.0 | 1000 | $1,550 | $1.55 | 2d | 1 | 0.47mi |
| 1136 Frenchmen St New Orleans, LA | 2.0 | 1.0 | 1000 | $1,550 | $1.55 | 3d | 1 | 0.47mi |
| 1136 Frenchmen St New Orleans, LA | 2.0 | 1.0 | 1800 | $1,650 | $0.92 | 23d | 1 | 0.47mi |
| 1134 Frenchmen St New Orleans, LA | 2.0 | 1.0 | 900 | $1,550 | $1.72 | 3d | 1 | 0.48mi |
| 1134 Frenchmen St New Orleans, LA | 2.0 | 1.0 | 900 | $1,550 | $1.72 | 2d | 1 | 0.48mi |
| 2238 Painters St New Orleans, LA | 2.0 | 1.0 | 896 | $1,300 | $1.45 | 23d | 1 | 0.49mi |
| 2406 Saint Roch Ave New Orleans, LA | 2.0 | 1.0 | 1000 | $1,600 | $1.60 | 16d | 1 | 0.50mi |
| 2317 N Rampart St Unit 1272378P New Orleans, LA | 3.0–6.0 | 2.0–4.0 | 1581 | $2,165 | $1.37 | 3d | 2 | 0.50mi |
Listing history 23 events
-
2026-06-18days on market $139,000 Active 70 DOM
-
2026-06-17days on market $139,000 Active 69 DOM
-
2026-06-16days on market $139,000 Active 68 DOM
-
2026-06-15days on market $139,000 Active 67 DOM
-
2026-06-13days on market $139,000 Active 65 DOM
-
2026-06-10days on market $139,000 Active 62 DOM
-
2026-06-09days on market $139,000 Active 61 DOM
-
2026-06-08days on market $139,000 Active 60 DOM
-
2026-06-07days on market $139,000 Active 59 DOM
-
2026-06-05days on market $139,000 Active 56 DOM
-
2026-06-03days on market $139,000 Active 55 DOM
-
2026-06-02days on market $139,000 Active 54 DOM
-
2026-06-01days on market $139,000 Active 53 DOM
-
2026-05-31days on market $139,000 Active 52 DOM
-
2026-04-09$139,000 Active 854-char remark
Show marketing remark (838 chars)
Calling Investors, Contractors, and Developers Looking for a Special House in a Rapidly Growing Area! Unlock the potential of this value-add opportunity located in one of New Orleans' most trending and transforming neighborhoods. This property is ready for a full makeover by an investor, contractor, or developer looking to capitalize on strong upside. Sellers are relocating to another state. Positioned just minutes from the French Quarter, with quick access to major travel routes, shopping, dining, and everyday conveniences, this location offers both lifestyle appeal and long-term value. With the right vision, this property can be transformed into a high-demand rental, resale flip, or custom redevelopment project. Opportunities like this--in a prime, centrally located area--are becoming increasingly rare. READY FOR A NEW OWNER
-
2026-04-09$139,000 Active 838-char remark
Show marketing remark (838 chars)
Calling Investors, Contractors, and Developers Looking for a Special House in a Rapidly Growing Area! Unlock the potential of this value-add opportunity located in one of New Orleans' most trending and transforming neighborhoods. This property is ready for a full makeover by an investor, contractor, or developer looking to capitalize on strong upside. Sellers are relocating to another state. Positioned just minutes from the French Quarter, with quick access to major travel routes, shopping, dining, and everyday conveniences, this location offers both lifestyle appeal and long-term value. With the right vision, this property can be transformed into a high-demand rental, resale flip, or custom redevelopment project. Opportunities like this--in a prime, centrally located area--are becoming increasingly rare. READY FOR A NEW OWNER
-
2019-08-27soldstatus $105,000
-
2015-08-20historical
-
2015-08-03price $127,000
-
2015-07-28price $130,000
-
2015-06-26$180,000 Active
-
2015-06-26$127,000
-
1980-08-06soldstatus $25,000
ⓘ Source: listings_history table (triggers on properties + properties_extension) + one-shot
backfill from property_details.listing_events for pre-trigger history.
Tax reassessment forecast LA · Resets to sale price
- Current annual tax
- $1,994 · $166/mo
- Projected year-2 tax
- $1,994 · $166/mo
- Expected delta
- $0/yr ($0/mo · 0.0%)
ⓘ Screening estimate from a state-policy table — verify with the county assessor before closing.
Climate risk First Street
- Flood 8/10 Severe FEMA zone X · 60% chance over 30 yrs
- Wildfire 1/10 Low
- Heat 10/10 Extreme 7 d/yr ≥108°F today · 21 d/yr by 30 yrs out
- Wind 10/10 Extreme 99% chance of damaging wind over 30 yrs
- Air quality 4/10 Moderate 4 unhealthy d/yr today · 4 by 30 yrs out
Nearby sold comps map
Loading sold comps map…
Walkable amenities ~0.75 mi
Loading nearby amenities…
Taxation est. · year 1
- Rental income
- $18,427
- − Mortgage interest
- −$7,786
- − Property taxes
- −$1,994
- − Insurance
- −$1,492
- − Repairs & maintenance
- −$1,474
- − Management
- −$1,474
- − Depreciation
- −$4,044
- Taxable income
- $162
- Est. tax owed @ 24.0%
- −$39
- After-tax cash flow
- $2,284/yr
For passive investors: Depreciation is non-cash, so a rental often shows a tax loss while cash-flowing — sheltering income. Rental losses are passive: they offset passive income freely, and up to $25,000/yr can offset ordinary (W-2) income if you actively participate and your MAGI is under $100k (phasing out to $0 by $150k); unused losses carry forward. On sale, claimed depreciation is recaptured at up to 25%, and gains may owe capital-gains tax (a 1031 exchange can defer both). Figures are a year-1 estimate at your 24.0% rate — not tax advice; consult a CPA.
Schools (NCES district)
- District
- Orleans Parish
- NCES district ID
- 2201170
- Math proficiency
- 11% ▼ -52.00%
- Reading proficiency
- 27% ▼ -46.00%
- Median HH income
- $37,011
- Composite
- 15.78/100
- National rank
- #9271
- State rank
- #69 of 98 in LA
Livability — New Orleans
- Score
- 81/100
- State rank
- #3
- US rank
- #1383
Category grades
Schools grade is shown separately in the Schools card above.
Census & demographics
- Census place
- New Orleans, LA
- County
- Orleans Parish · 338,817 people
- City population
- 338,817
- Metro
- New Orleans-Metairie, LA
- Population (ZIP)
- 25,652
- Household income
- $45,764
- Rent vs Own
- Severe rent burden
- 1988.0
Population outlook (Orleans County) Hauer SSP2
- Today (2025)
- 513,025 people
- By 2030
- 575,781 · +12.2%
- By 2040
- 700,174 · +36.5%
- By 2050
- 826,541 · +61.1%
- By 2075
- 1,123,374 · +119.0%
- By 2100
- 1,355,609 · +164.2%
Race, ethnicity, and origin ACS 2023
- Neighborhood character
- Majority Black (60%)
- Race & ethnicity
- Black 60% White 30% Two or more races 6% Hispanic / Latino 5%
- Common ancestry
- Lithuanian 5% Italian 1% Romanian 1%
- Foreign-born
- 5% · Canada, South Korea
- Languages at home
- 93% English-only · Spanish 3% Other Indo-European 1% French/Haitian/Cajun 1%
Political lean MEDSL · Orleans
- 2024 margin
- Solid D (+67.0) · D 82.2% · R 15.2% · Other 2.7%
- 2008→2024 swing
- +6.7pp toward D · 2008: 60.3pp · 2024: 67.0pp
- All cycles
- 2024: D+67.0 2020: D+68.2 2016: D+66.2 2012: D+62.5 2008: D+60.3
Not yet ingested
- Civics
- —
Market trends
- HPI YoY
- ▼ -177.22%
- Current HPI
- 184.6061
- Rent YoY
- ▲ 2.49%
- Metro
- New Orleans-Metairie, LA
- State GDP YoY
- ▲ 3.29%
- F500 in state
- 10
Industry mix (Fortune 500 HQ in LA)
| Industry | F500 HQs | Revenue |
|---|---|---|
| Telecommunications | 2 | $23B |
|
||
| Utilities | 1 | $12B |
|
||
| Wholesale / Distribution | 1 | $5B |
|
||
| Advertising | 1 | $2B |
|
||
Price history
+456.0% since first listed9 events — show timeline
- 2026-04-09 Listed $139,000 AcadianaMLS
- 2026-04-09 Listed $139,000 GSREIN
- 2019-08-27 Sold (Public Records) $105,000 Public Records
- 2015-08-20 Listing Removed — GSREIN
- 2015-08-03 Price Changed $127,000 GSREIN
- 2015-07-28 Price Changed $130,000 GSREIN
- 2015-06-26 Listed $180,000 GSREIN
- 2015-06-26 Listed $127,000 AcadianaMLS
- 1980-08-06 Sold (Public Records) $25,000 Public Records
Property tax history
+3.4%/yrLatest (2026): $1,994 · +1.1% YoY. Source: county tax records.
Cash-flow waterfall
monthlySold comps — $/sqft
last 12 mo · ≤1 miLoading sold comps…