4096 Northlight Dr · Naples, FL
Flood risk 8/10 · Major
- FEMA flood zone
- AE
- Chance of flooding over 30 yrs
- 0.97%
- Est. flood insurance / yr
- $1,737 – $8,500
Fire risk 2/10 · Minimal
- Est. fire insurance / yr
- $947 – $1,759
Heat risk 10/10 · Severe
- Hot days now (above 107°F)
- 7 days/yr
- Hot days in 30 yrs
- 28 days/yr
Wind risk 10/10 · Severe
- Chance of severe wind over 30 yrs
- 99.0%
Air-quality risk 3/10 · Minor
- Unhealthy air days now
- 3 days/yr
- Unhealthy air days in 30 yrs
- 3 days/yr
Risk factors via First Street. Map © Google.
Why this score? — see what drove the B- grade
The composite is a weighted blend of 9 inputs, each scored 0–100. Each bar is that input's sub-score; the figure is the points it added to the 100-point composite (weight × sub-score).
- Cash flow +28.2/30.0
- DSCR +10.0/10.0
- 1% rule +7.8/10.0
- ARV discount +7.5/15.0
- Schools +5.0/10.0
- Livability +4.0/5.0
- Condition / age +3.8/5.0
- Rent growth +2.1/5.0
- Appreciation +0.0/10.0
$239,000
🖨 Deal sheet 📄 Offer letter ✓ Due diligence
Listing remarks
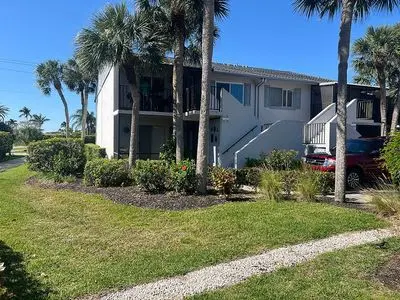
This condo is a must see, LOCATION LOCATION LOCATION. Great condo in a great location on NORTHLIGHT DR First time available End unit, The privacy of this condo is the best of WINTERPARK NAPLES, condos. First floor 2 bedroom 2 bathroom 1st floor condo Close to everything Naples, Florida has to offer, Dinning , Shopping and just 2 1/2 miles from Naples world famous white sandy beaches. Brand new floors throughout. Very large Resort style pool, Pickle ball, Tennis and botchy ball courts. Call or text to set up your viewing.
Key facts
- Tennis
- Pickle ball
- Resort style pool
Tags
Property features AI
Exterior
- Home design: Built in 1987
- Construction: Living area approximately 1,234
- Exterior features: Located in the East Naples subdivision
Neighborhood map
What this means for you Summary
Snapshot
- This is a 2-bed/2.0-bath other listed at $239k. Condition is rated good.
Deal economics
- At list price, monthly cash flow is $330 ($4k/yr) — positive.
- The deal already cash-flows at list — no discount required.
- Meets the 1% rule at list price ($3k rent vs $239k).
- Recommended offer: $232k (3.0% below list) — sets the bar for market timing.
Location & tenants
- Location reads 80/100 on livability (#126 in FL, #1,903 nationally) — a professional / high-income tenant draw. Strengths: crime A+, amenities A+, employment A+; Watch: commute D+, cost of living F.
- Collier (suburban): math 60% / reading 56% proficiency, ranked #16 of 73 in FL (top 22%) — acceptable for families but not a draw, mixed tenant base, ~2y average lease.
- Market conditions: Rents soft (-1.7%/yr); 771 active listings in the ZIP; 40 comparable units currently listed for rent nearby; rentals at typical pace (median 21d on market — plan ~3-4 weeks tenant-placement turnaround); 3,520 units permitted in Collier County in 2024 (959 in 5+ unit buildings).
- At $3,048/mo this rent would consume 52% of the median local household income ($70k/yr) (locally 980% of renters already pay >50% of income on rent) — very limited rent-growth headroom before tenants either downsize or default.
Forward outlook
- Local home prices are declining (-3.0%/yr); year-one equity from $2k of loan paydown is wiped out by about $7k of value loss. Plan a longer hold.
- Collier County population projected at +30% by 2050 — long-run rental-demand tailwind backs the buy-and-hold thesis.
Negotiation context
- It's been on market 37 days — a 3% lower offer ($232k) is reasonable based on typical stale-listing flexibility.
Risks & watch-outs
- Watch-outs: flood insurance adds $427/mo.
- Climate carrying-cost: in FEMA flood zone AE (mandatory federal flood insurance); severe wind risk, 99% chance of damaging wind over 30y; extreme-heat days projected 7→28/yr by 2055 (HVAC capex compounding) — expect insurance premiums to compound above CPI over the hold.
Questions for the listing agent
- It's been on market 37 days. Have you received any prior offers? Is the seller open to a 3% concession, seller financing, or rate buy-down credit?
- What's the actual annual flood-insurance premium (NFIP or private), and is the property in a SFHA with mandatory coverage?
- Is there a deadline driving the sale (1031 exchange, divorce, estate, relocation)? That informs how much negotiation room exists.
- Schools are B-rated — typically a magnet for longer-tenancy family renters. What's the average tenant stay here, and is there a school-zone premium baked into asking?
- What's the average days-on-market for RENTAL listings here right now (not sales)? A rising rental-DOM trend means longer vacancies and softer asking-rent achievability than the comps imply.
- What's the recent tenant-quality profile in this submarket — average credit score on applications, eviction rate, late-payment / NSF rate, and stable-employment percentage? A property-management company in the area should have these aggregated.
- How much new for-sale + rental construction is in the pipeline within 1–3 miles? Heavy new supply typically softens prices + rents 12–24 months out; constrained supply supports both.
Investment metrics
- 1% rule
- 1.28% ✓
- Cap rate
- 10.09%
- Cash-on-cash
- 13.56%
- DSCR
- 1.60
- GRM
- 6.5
CMA / ARV
No comps found within radius.
Projected returns pro-forma
-3.0% appreciation · 0.0% rent growth · sell at horizon
- IRR
- -11.2%
- Equity multiple
- 0.61×
- Total profit
- $-26,361
- Equity at exit
- $35,636
- IRR
- -8.3%
- Equity multiple
- 0.56×
- Total profit
- $-29,192
- Equity at exit
- $20,664
Cash invested: $66,920 (down + closing). Projections, not guarantees.
Landlord ↔ Tenant lean methodology
- Overall (STATE)
- 87 Strongly Landlord-Friendly
- State Florida
- 87 Strongly Landlord-Friendly · R+3
- County
- — inherits STATE
- City
- — inherits STATE
ZIP-level market 34112
- Rents YoY
- -1.7%
- Active inventory
- 771
- Price-to-rent
- 6.5×
Monthly cashflow live
- Estimated rent
- $3,048 high interval (Pro) →
- Mortgage (P&I)
- −$1,253
- Tax est. 1.5%
- −$299 /mo · $3,585/yr
- Insurance
- −$100
- Flood insurance flood zone
- −$427 /mo · $5,118/yr
- HOA
- −$0
- Vacancy / Maint / Mgmt
- −$640
- Net cashflow
- $330
Break-even live
UW: 25.0% down · 7.5% · 30yr · 1.5% tax · 5.0% vac · 8.0% maint · 8.0% mgmt
Financing live
Cash to close
- Down payment
- $59,750
- Closing costs
- $7,170
- Reserves months
- —
- Total cash needed
- —
Loan-product check · same deal, 3 products live
Conventional
25% down · 7.5% · 30yr
- Down + closing
- —
- Monthly P&I
- —
- Monthly cashflow
- —
- DSCR
- —
- Eligible?
- —
Personal DTI + credit; lowest rate.
DSCR
20% down · 8.5% · 30yr
- Down + closing
- —
- Monthly P&I
- —
- Monthly cashflow
- —
- DSCR
- —
- Eligible?
- —
No personal income docs; deal must DSCR.
Hard money
10% down · 12.0% · 12mo
- Down + closing
- —
- Monthly P&I
- —
- Monthly cashflow
- —
- DSCR
- —
- Eligible?
- —
Short-term bridge; refi at stabilization.
Rent comps 40 comps
| Address | Beds | Baths | Sqft | Rent | $/sqft | DOM | Units | Dist |
|---|---|---|---|---|---|---|---|---|
| 4069 Northlight Dr #1805 Naples, FL | 2.0 | 2.0 | 1234 | $3,000 | $2.43 | 21d | 1 | 0.04mi |
| 4010 Ice Castle Way #7 Naples, FL | 2.0 | 2.0 | 1314 | $3,200 | $2.44 | 23d | 1 | 0.07mi |
| 4021 Ice Castle Way #4 Naples, FL | 2.0 | 2.0 | 1246 | $2,600 | $2.09 | 14d | 1 | 0.10mi |
| 4040 Ice Castle Way Unit 2 Naples, FL | 2.0 | 2.0 | 1246 | $2,800 | $2.25 | 23d | 1 | 0.15mi |
| 4060 Ice Castle Way #10 Naples, FL | 2.0 | 2.0 | 1246 | $3,600 | $2.89 | 14d | 1 | 0.17mi |
| 3504 Antarctic Cir Naples, FL | 2.0 | 2.0 | 1246 | $3,000 | $2.41 | 23d | 1 | 0.29mi |
| 83 Glades Blvd #3 Naples, FL | 2.0 | 2.0 | 1204 | $5,200 | $4.32 | 14d | 1 | 0.30mi |
| 3510 Antarctic Cir Unit 1 Naples, FL | 2.0 | 2.0 | 1200 | $2,350 | $1.96 | 23d | 1 | 0.30mi |
| 96 Glades Blvd Unit 513 Naples, FL | 2.0 | 2.0 | 1370 | $4,500 | $3.28 | 14d | 1 | 0.30mi |
| 4180 Looking Glass Ln Unit 4104 Naples, FL | 2.0 | 2.0 | 1246 | $4,000 | $3.21 | 14d | 1 | 0.33mi |
| 3608 Arctic Cir #514 Naples, FL | 2.0 | 2.0 | 1250 | $4,200 | $3.36 | 23d | 1 | 0.33mi |
| 3618 Arctic Cir #3618 Naples, FL | 2.0 | 2.0 | 1200 | $3,450 | $2.88 | 23d | 1 | 0.34mi |
| 4210 Looking Glass Ln Unit 4210 Naples, FL | 2.0 | 2.0 | 1300 | $3,000 | $2.31 | 14d | 1 | 0.36mi |
| 3563 Antarctic Cir #2102 Naples, FL | 2.0 | 2.0 | 1200 | $3,800 | $3.17 | 23d | 1 | 0.38mi |
| 3400 Frosty Way #5 Naples, FL | 2.0 | 2.0 | 1284 | $3,500 | $2.73 | 14d | 1 | 0.39mi |
| 364 Tern Dr #4 Naples, FL | 2.0 | 2.0 | 1264 | $1,800 | $1.42 | 14d | 1 | 0.39mi |
| 3676 Arctic Cir #112 Naples, FL | 2.0 | 2.0 | 1246 | $2,700 | $2.17 | 21d | 1 | 0.40mi |
| 4502 Parrot Ave Naples, FL | 3.0 | 2.0 | 1200 | $2,950 | $2.46 | 23d | 1 | 0.41mi |
| 348 Tern Dr #2 Naples, FL | 2.0 | 2.0 | 1270 | $1,800 | $1.42 | 14d | 1 | 0.43mi |
| 348 Tern Dr Unit 4 Naples, FL | 2.0 | 2.0 | 1270 | $5,000 | $3.94 | 23d | 1 | 0.43mi |
| 1059 San Remo Ave Naples, FL | 2.0 | 1.0 | 845 | $1,795 | $2.12 | 23d | 1 | 0.45mi |
| 306 Palm Dr #2 Naples, FL | 2.0 | 2.0 | 1270 | $5,200 | $4.09 | 23d | 1 | 0.49mi |
| 1111 Central Dr Unit 417A Naples, FL | 2.0 | 2.0 | 1265 | $6,500 | $5.14 | 23d | 1 | 0.52mi |
| 265 Palm Dr Unit 265-2 Naples, FL | 2.0 | 2.0 | 1215 | $1,499 | $1.23 | 14d | 1 | 0.53mi |
| 4472 Beechwood Lake Dr Naples, FL | 3.0 | 2.0 | 1352 | $3,050 | $2.26 | 23d | 1 | 0.53mi |
| 146 Lollypop Ln #851 Naples, FL | 2.0 | 2.0 | 1335 | $3,750 | $2.81 | 23d | 1 | 0.54mi |
| 1895 Courtyard Way #103 Naples, FL | 3.0 | 2.0 | 1046 | $2,200 | $2.10 | 21d | 1 | 0.57mi |
| 195 Peppermint Ln Unit 4 Naples, FL | 2.0 | 2.0 | 1335 | $2,500 | $1.87 | 23d | 1 | 0.58mi |
| 202 Peppermint Ln #2 Naples, FL | 2.0 | 2.0 | 1335 | $5,000 | $3.75 | 14d | 1 | 0.58mi |
| 195 Peppermint Ln Unit 884 Naples, FL | 2.0 | 2.0 | 1335 | $3,800 | $2.85 | 14d | 1 | 0.58mi |
| 195 Peppermint Ln #2 Naples, FL | 2.0 | 2.0 | 1198 | $2,600 | $2.17 | 14d | 1 | 0.58mi |
| 195 Peppermint Ln Unit 881 Naples, FL | 2.0 | 2.0 | 1335 | $5,000 | $3.75 | 14d | 1 | 0.58mi |
| 256 Palm Dr #6 Naples, FL | 2.0 | 2.0 | 1010 | $4,500 | $4.46 | 14d | 1 | 0.58mi |
| 2155 Great Blue Dr Naples, FL | 1.0–3.0 | 1.0–2.0 | 895 | $1,910 | $2.13 | 14d | 43 | 0.58mi |
| 1933 Courtyard Way Unit D-103 Naples, FL | 2.0 | 2.0 | 947 | $1,850 | $1.95 | 14d | 1 | 0.60mi |
| 239 Palm Dr #2 Naples, FL | 2.0 | 2.0 | 1215 | $4,000 | $3.29 | 14d | 1 | 0.60mi |
| 1814 Kings Lake Blvd #204 Naples, FL | 2.0 | 2.0 | 1400 | $2,450 | $1.75 | 23d | 1 | 0.61mi |
| 240 Palm Dr Unit 48-1 Naples, FL | 2.0 | 2.0 | 1100 | $1,800 | $1.64 | 23d | 1 | 0.62mi |
| 1075 Foxfire Ln Naples, FL | 2.0 | 2.0 | 1092 | $3,300 | $3.02 | 23d | 3 | 0.62mi |
| 1826 Kings Lake Blvd #101 Naples, FL | 3.0 | 2.0 | 1456 | $2,700 | $1.85 | 14d | 1 | 0.62mi |
Listing history 14 events
-
2026-06-18days on market $239,000 Active 37 DOM
-
2026-06-17days on market $239,000 Active 36 DOM
-
2026-06-16days on market $239,000 Active 35 DOM
-
2026-06-15days on market $239,000 Active 34 DOM
-
2026-06-10days on market $239,000 Active 29 DOM
-
2026-06-09days on market $239,000 Active 28 DOM
-
2026-06-08days on market $239,000 Active 27 DOM
-
2026-06-07days on market $239,000 Active 26 DOM
-
2026-06-02days on market $239,000 Active 21 DOM
-
2026-06-01days on market $239,000 Active 20 DOM
-
2026-05-31days on market $239,000 Active 19 DOM
-
2026-05-30days on market $239,000 Active 18 DOM
-
2026-05-13price $239,000
-
2026-05-12$249,000 Active
ⓘ Source: listings_history table (triggers on properties + properties_extension) + one-shot
backfill from property_details.listing_events for pre-trigger history.
Climate risk First Street
- Flood 8/10 Severe FEMA zone AE · 97% chance over 30 yrs
- Wildfire 2/10 Low
- Heat 10/10 Extreme 7 d/yr ≥107°F today · 28 d/yr by 30 yrs out
- Wind 10/10 Extreme 99% chance of damaging wind over 30 yrs
- Air quality 3/10 Moderate 3 unhealthy d/yr today · 3 by 30 yrs out
Nearby sold comps map
Loading sold comps map…
Walkable amenities ~0.75 mi
Loading nearby amenities…
Taxation est. · year 1
- Rental income
- $36,574
- − Mortgage interest
- −$13,388
- − Property taxes
- −$3,585
- − Insurance
- −$6,314
- − Repairs & maintenance
- −$2,926
- − Management
- −$2,926
- − Depreciation
- −$6,953
- Taxable income
- $483
- Est. tax owed @ 24.0%
- −$116
- After-tax cash flow
- $3,839/yr
For passive investors: Depreciation is non-cash, so a rental often shows a tax loss while cash-flowing — sheltering income. Rental losses are passive: they offset passive income freely, and up to $25,000/yr can offset ordinary (W-2) income if you actively participate and your MAGI is under $100k (phasing out to $0 by $150k); unused losses carry forward. On sale, claimed depreciation is recaptured at up to 25%, and gains may owe capital-gains tax (a 1031 exchange can defer both). Figures are a year-1 estimate at your 24.0% rate — not tax advice; consult a CPA.
Condition & rehab AI · 1 photo
This well-maintained, first-floor condo in a prime location on Northlight Dr. in Naples, FL, is ready for new owners. Fresh landscaping and a fresh coat of paint would further enhance its curb appeal and value.
Value-add opportunities
- Both Landscaping — Enhances curb appeal and adds value
- Both Painting — Fresh paint can make the interior look new
- Resale Kitchen appliances — Modern appliances can attract more buyers
- Resale Bathroom fixtures — Upgraded fixtures can increase appeal
Renovation cost estimate screening
Value-add ROI direction
- Both Landscaping — Enhances curb appeal and adds value ↑
- Both Painting — Fresh paint can make the interior look new ↑
- Resale Kitchen appliances — Modern appliances can attract more buyers ↑
- Resale Bathroom fixtures — Upgraded fixtures can increase appeal ↑
ⓘ Cost ranges are severity-bucket heuristics (US national rule-of-thumb). Get contractor quotes + a written scope before underwriting a rehab budget.
Schools (NCES district)
- District
- Collier
- NCES district ID
- 1200330
- Math proficiency
- 60% ▼ -4.00%
- Reading proficiency
- 56% ▼ -2.00%
- Median HH income
- $58,275
- Composite
- 50.23/100
- National rank
- #1892
- State rank
- #16 of 73 in FL
Livability — Naples
- Score
- 80/100
- State rank
- #126
- US rank
- #1903
Category grades
Schools grade is shown separately in the Schools card above.
Census & demographics
- County
- Collier County · 396,295 people
- City population
- 344,941
- Metro
- Naples-Marco Island, FL
- Population (ZIP)
- 27,193
- Household income
- $69,842
- Rent vs Own
- Severe rent burden
- 980.0
Population outlook (Collier County) Hauer SSP2
- Today (2025)
- 420,858 people
- By 2030
- 450,054 · +6.9%
- By 2040
- 502,232 · +19.3%
- By 2050
- 544,932 · +29.5%
- By 2075
- 627,203 · +49.0%
- By 2100
- 659,015 · +56.6%
Race, ethnicity, and origin ACS 2023
- Neighborhood character
- Predominantly White (74%)
- Race & ethnicity
- White 74% Hispanic / Latino 18% Two or more races 9% Black 6% Native American 2% Asian 1%
- Hispanic origin (detail)
- Mexican 7% Puerto Rican 2% Cuban 4% Dominican 1%
- Common ancestry
- Hispanic 4% Romanian 3% Portuguese 2%
- Foreign-born
- 19% · Canada, Jamaica
- Languages at home
- 75% English-only · Spanish 17% French/Haitian/Cajun 4% German/W. Germanic 1%
Political lean MEDSL · Collier
- 2024 margin
- Solid R (+33.1) · D 33.1% · R 66.2%
- 2008→2024 swing
- -10.6pp toward R · 2008: -22.5pp · 2024: -33.1pp
- All cycles
- 2024: R+33.1 2020: R+24.7 2016: R+26.0 2012: R+30.1 2008: R+22.5
Not yet ingested
- Civics
- —
Market trends
- HPI YoY
- ▼ -235.10%
- Current HPI
- 256.9182
- Rent YoY
- ▼ -1.69%
- Metro
- Naples-Marco Island, FL
- State GDP YoY
- ▲ 3.28%
- F500 in state
- 36
Industry mix (Fortune 500 HQ in FL)
| Industry | F500 HQs | Revenue |
|---|---|---|
| Industrial Technology | 2 | $29B |
|
||
| Insurance | 2 | $17B |
|
||
| Retail | 1 | $60B |
|
||
| Technology Distribution | 1 | $58B |
|
||
| Homebuilding | 1 | $35B |
|
||
| Technology Manufacturing | 1 | $35B |
|
||
Price history
-4.0% since first listed2 events — show timeline
- 2026-05-13 Price Changed $239,000 FSBO.com
- 2026-05-12 Listed $249,000 FSBO.com
Cash-flow waterfall
monthlySold comps — $/sqft
last 12 mo · ≤1 miLoading sold comps…