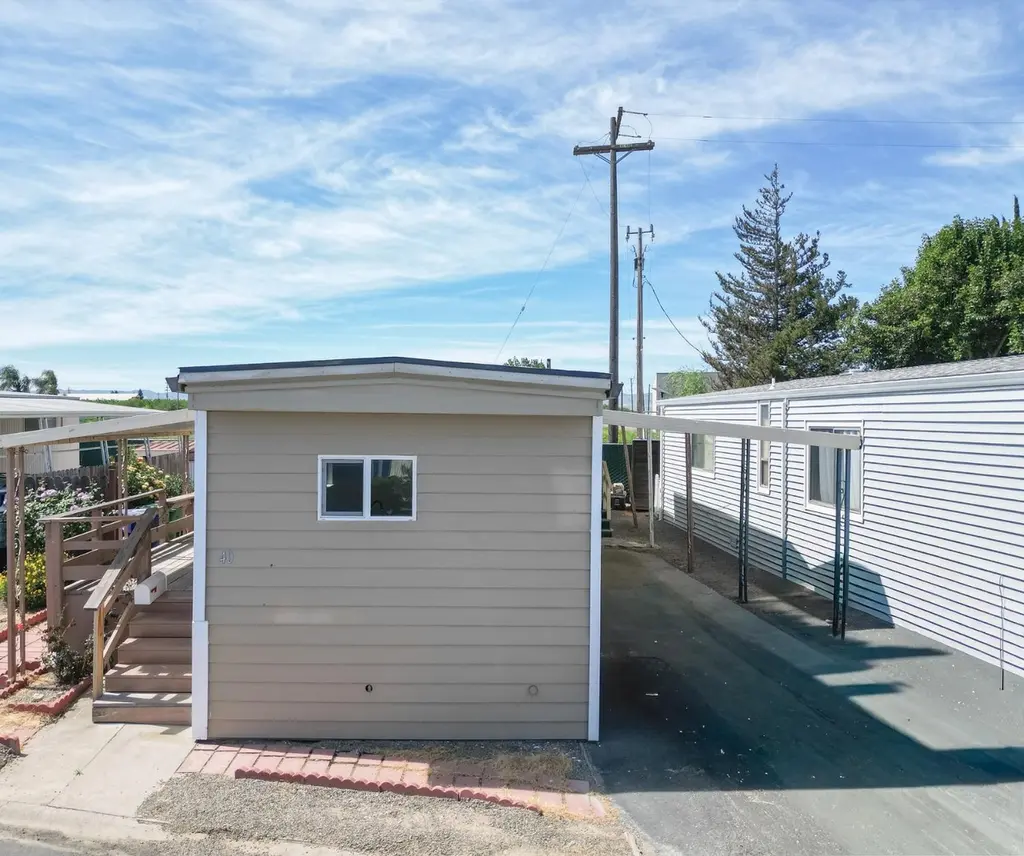
1400 Meredith Ave #40 · Gustine, CA
Flood risk 1/10 · Minimal
- FEMA flood zone
- X (unshaded)
- Chance of flooding over 30 yrs
- 0.0%
- Est. flood insurance / yr
- $507 – $1,088
Fire risk 6/10 · Moderate
- Est. fire insurance / yr
- $659 – $1,223
Heat risk 6/10 · Moderate
- Hot days now (above 105°F)
- 7 days/yr
- Hot days in 30 yrs
- 16 days/yr
Wind risk 1/10 · Minimal
- Chance of severe wind over 30 yrs
- —
Air-quality risk 9/10 · Severe
- Unhealthy air days now
- 20 days/yr
- Unhealthy air days in 30 yrs
- 21 days/yr
Risk factors via First Street. Map © Google.
Why this score? — see what drove the B- grade
The composite is a weighted blend of 9 inputs, each scored 0–100. Each bar is that input's sub-score; the figure is the points it added to the 100-point composite (weight × sub-score).
- Cash flow +30.0/30.0
- 1% rule +10.0/10.0
- DSCR +10.0/10.0
- ARV discount +8.0/15.0
- Condition / age +3.8/5.0
- Livability +3.4/5.0
- Rent growth +2.5/5.0
- Schools +2.4/10.0
- Appreciation +0.0/10.0
$38,000
🖨 Deal sheet (PDF) 📄 Offer letter ✓ Due diligence
Listing remarks
Welcome to this 2-bedroom, 1-bathroom mobile home offering 720 sq ft of comfortable living space in a 55+ community in Gustine. This home provides easy access and a welcoming setting. Built in 1973, the home has been updated with fresh interior paint, new flooring, a newer water heater, and a recently updated roof. Residents of this friendly senior community enjoy a variety of amenities, including a sparkling pool, game room, BBQ area, and picnic spaceperfect for relaxing or socializing with neighbors. This is a great opportunity to own an affordable home in a peaceful and active community. Don't miss out!
Key facts
- Parking
- Built 1973
- Listed 83 days
Neighborhood map
What this means for you Summary
Snapshot
- This is a 2-bed/1.0-bath manufactured listed at $38k. Condition is rated good.
Deal economics
- At list price, monthly cash flow is $448 ($5k/yr) — positive.
- The deal already cash-flows at list — no discount required.
- Meets the 1% rule at list price ($900 rent vs $38k).
- Recommended offer: $36k (6.0% below list) — sets the bar for market timing.
Location & tenants
- Location reads 67/100 on livability (#321 in CA) — a middle-class / working-renter tenant base. Strengths: health & safety A+, housing A, crime B+; Watch: employment D, amenities F, commute F.
- Gustine Unified (rural): math 17% / reading 32% proficiency, ranked #1,180 of 1,400 in CA (top 84%) — low school quality limits family demand, transient renter base, plan for 1-2y turnover; 72% free/reduced lunch — lower-income household profile, screen leases tightly.
- Zoned schools: Gustine Elementary (544 students, 81% FRL); Gustine Middle (405 students, 78% FRL); Gustine High (586 students, 74% FRL).
- Market conditions: 30 active listings in the ZIP; 1 comparable units currently listed for rent nearby; 459 units permitted in Merced County in 2024 (0 in 5+ unit buildings).
Forward outlook
- Local home prices are declining (-3.0%/yr); year-one equity from $263 of loan paydown is wiped out by about $1k of value loss. Plan a longer hold.
- Merced County population projected at +12% by 2050 — modest demand growth; plan on rents tracking national, not racing it.
- At projected returns (-3.0% appreciation + 3.0% rent growth), your $11k cash investment doubles in ~3 years — after that, you're playing with house money.
Negotiation context
- It's been on market 83 days — a 6% lower offer ($36k) is reasonable based on typical stale-listing flexibility.
Risks & watch-outs
- Climate carrying-cost: major wildfire risk; extreme-heat days projected 7→16/yr by 2055 (HVAC capex compounding) — expect insurance premiums to compound above CPI over the hold.
Questions for the listing agent
- It's been on market 83 days. Have you received any prior offers? Is the seller open to a 6% concession, seller financing, or rate buy-down credit?
- Built in 1973 — when were the roof, HVAC, electrical panel, plumbing, and water heater last replaced?
- Why hasn't it sold? Are there any deal-killer items the seller is aware of (foundation, flood, title, zoning, code violations)?
- Is there a deadline driving the sale (1031 exchange, divorce, estate, relocation)? That informs how much negotiation room exists.
- Schools are D-rated, which usually means shorter tenancies and higher turnover. Who's the typical renter profile here, and what's been the actual vacancy rate?
- What's the average days-on-market for RENTAL listings here right now (not sales)? A rising rental-DOM trend means longer vacancies and softer asking-rent achievability than the comps imply.
- What's the recent tenant-quality profile in this submarket — average credit score on applications, eviction rate, late-payment / NSF rate, and stable-employment percentage? A property-management company in the area should have these aggregated.
- How much new for-sale + rental construction is in the pipeline within 1–3 miles? Heavy new supply typically softens prices + rents 12–24 months out; constrained supply supports both.
Investment metrics
- 1% rule
- 2.37% ✓
- Cap rate
- 20.45%
- Cash-on-cash
- 50.57%
- DSCR
- 3.25
- GRM
- 3.5
CMA / ARV
- ARV (median comp)
- $38,403
- List price
- $38,000
- Delta
- -1.05%
- Verdict
- FAIR
- Comps
- 3 within 1.0 mi
Show comp detail 2 sales within ~0.75 mi
| Address | Dist | Beds/Ba | Sqft | Sold | Price | $/sf | Match |
|---|---|---|---|---|---|---|---|
| 1400 Meredith Ave #96 | 0.05mi | 1/1.0 (-1) | 650 (-10%) | 2mo | $35,000 | $54 | 75 |
| 1400 Meredith Ave #98 | 0.05mi | 1/1.0 (-1) | 791 (+10%) | 9mo | $46,000 | $58 | 69 |
Match score weights: distance 35% · size 25% · config 20% · recency 20%. Top-matched comps best support the ARV.
Projected returns pro-forma
-3.0% appreciation · 3.0% rent growth · sell at horizon
- IRR
- 48.4%
- Equity multiple
- 3.11×
- Total profit
- $22,414
- Equity at exit
- $5,666
- IRR
- 54.0%
- Equity multiple
- 6.30×
- Total profit
- $56,346
- Equity at exit
- $3,286
Cash invested: $10,640 (down + closing). Projections, not guarantees.
Landlord ↔ Tenant lean methodology
- Overall (STATE)
- 18 Strongly Tenant-Friendly
- State California
- 18 Strongly Tenant-Friendly · D+13
- County
- — inherits STATE
- City
- — inherits STATE
ZIP-level market 95322
- Home prices YoY
- -31.1%
- Active inventory
- 30
- Price-to-rent
- 3.5×
Monthly cashflow live
- Estimated rent
- $900 medium interval (Pro) →
- Mortgage (P&I)
- −$199
- Tax est. 1.5%
- −$48 /mo · $570/yr
- Insurance
- −$16
- HOA
- −$0
- Vacancy / Maint / Mgmt
- −$189
- Net cashflow
- $448
Break-even live
Sensitivity live
| Price | -10% $475 | -5% $462 | +0% $448 | +5% $435 | +10% $422 |
|---|---|---|---|---|---|
| Rent | -10% $377 | -5% $413 | +0% $448 | +5% $484 | +10% $519 |
| Rate | -1.0pp $468 | -0.5pp $458 | base $448 | +0.5pp $439 | +1.0pp $429 |
UW: 25.0% down · 7.5% · 30yr · 1.5% tax · 5.0% vac · 8.0% maint · 8.0% mgmt
Financing live
Cash to close
- Down payment
- $9,500
- Closing costs
- $1,140
- Reserves months
- —
- Total cash needed
- —
Loan-product check · same deal, 3 products live
Conventional
25% down · 7.5% · 30yr
- Down + closing
- —
- Monthly P&I
- —
- Monthly cashflow
- —
- DSCR
- —
- Eligible?
- —
Personal DTI + credit; lowest rate.
DSCR
20% down · 8.5% · 30yr
- Down + closing
- —
- Monthly P&I
- —
- Monthly cashflow
- —
- DSCR
- —
- Eligible?
- —
No personal income docs; deal must DSCR.
Hard money
10% down · 12.0% · 12mo
- Down + closing
- —
- Monthly P&I
- —
- Monthly cashflow
- —
- DSCR
- —
- Eligible?
- —
Short-term bridge; refi at stabilization.
Rent comps 1 comps
| Address | Beds | Baths | Sqft | Rent | $/sqft | DOM | Units | Dist |
|---|---|---|---|---|---|---|---|---|
| 235 5th St Gustine, CA | 1.0 | 1.0 | 500 | $900 | $1.80 | 0d | 1 | 0.83mi |
Listing history 13 events
-
2026-06-17status $38,000 Pending 83 DOM
-
2026-06-16days on market $38,000 Active 83 DOM
-
2026-06-15days on market $38,000 Active 82 DOM
-
2026-06-13days on market $38,000 Active 80 DOM
-
2026-06-13days on market $38,000 Active 79 DOM
-
2026-06-09days on market $38,000 Active 76 DOM
-
2026-06-08days on market $38,000 Active 75 DOM
-
2026-06-07days on market $38,000 Active 74 DOM
-
2026-06-05days on market $38,000 Active 71 DOM
-
2026-06-03days on market $38,000 Active 70 DOM
-
2026-06-02days on market $38,000 Active 69 DOM
-
2026-06-01days on market $38,000 Active 68 DOM
-
2026-05-31days on market $38,000 Active 67 DOM
ⓘ Source: listings_history table (triggers on properties + properties_extension) + one-shot
backfill from property_details.listing_events for pre-trigger history.
Climate risk First Street
- Flood 1/10 Low FEMA zone X (unshaded) · 0% chance over 30 yrs
- Wildfire 6/10 Major
- Heat 6/10 Major 7 d/yr ≥105°F today · 16 d/yr by 30 yrs out
- Wind 1/10 Low
- Air quality 9/10 Extreme 20 unhealthy d/yr today · 21 by 30 yrs out
Nearby sold comps map
Loading sold comps map…
Walkable amenities ~0.75 mi
Loading nearby amenities…
Taxation est. · year 1
- Rental income
- $10,800
- − Mortgage interest
- −$2,129
- − Property taxes
- −$570
- − Insurance
- −$190
- − Repairs & maintenance
- −$864
- − Management
- −$864
- − Depreciation
- −$1,105
- Taxable income
- $5,078
- Est. tax owed @ 24.0%
- −$1,219
- After-tax cash flow
- $4,162/yr
For passive investors: Depreciation is non-cash, so a rental often shows a tax loss while cash-flowing — sheltering income. Rental losses are passive: they offset passive income freely, and up to $25,000/yr can offset ordinary (W-2) income if you actively participate and your MAGI is under $100k (phasing out to $0 by $150k); unused losses carry forward. On sale, claimed depreciation is recaptured at up to 25%, and gains may owe capital-gains tax (a 1031 exchange can defer both). Figures are a year-1 estimate at your 24.0% rate — not tax advice; consult a CPA.
Condition & rehab AI · 12 photos
This 2-bedroom, 1-bathroom mobile home in a 55+ community offers a good condition with fresh updates and potential for further improvements.
Repairs flagged
- Minor Kitchen cabinets — Dated and could be replaced
- Minor Bathroom fixtures — Standard and could be upgraded
Value-add opportunities
- Both Paint exterior — Enhances curb appeal and value
- Both Replace carpet — Improves comfort and value
- Both Replace kitchen cabinets — Modernizes and increases value
- Both Replace bathroom fixtures — Modernizes and increases value
Renovation cost estimate screening
| Repair item | Severity | Est. cost |
|---|---|---|
| Kitchen cabinets · Dated and could be replaced | Minor | $500–3,000 |
| Bathroom fixtures · Standard and could be upgraded | Minor | $500–3,000 |
| Total estimated repair cost · 2 items | $1,000–6,000 |
Value-add ROI direction
- Both Paint exterior — Enhances curb appeal and value ↑
- Both Replace carpet — Improves comfort and value ↑
- Both Replace kitchen cabinets — Modernizes and increases value ↑
- Both Replace bathroom fixtures — Modernizes and increases value ↑
ⓘ Cost ranges are severity-bucket heuristics (US national rule-of-thumb). Get contractor quotes + a written scope before underwriting a rehab budget.
Schools (NCES district)
- District
- Gustine Unified
- NCES district ID
- 0616323
- Math proficiency
- 17% ▬ 0.00%
- Reading proficiency
- 32% ▲ 3.00%
- Median HH income
- $42,825
- Composite
- 23.99/100
- National rank
- #13180
- State rank
- #1180 of 1400 in CA
Livability — Gustine
- Score
- 67/100
- State rank
- #321
- US rank
- #10803
Category grades
Schools grade is shown separately in the Schools card above.
Census & demographics
- Census place
- Gustine, CA
- Population (ZIP)
- 9,013
Population outlook (Merced County) Hauer SSP2
- Today (2025)
- 285,501 people
- By 2030
- 293,437 · +2.8%
- By 2040
- 308,808 · +8.2%
- By 2050
- 321,011 · +12.4%
- By 2075
- 338,497 · +18.6%
- By 2100
- 330,493 · +15.8%
Race, ethnicity, and origin ACS 2023
- Neighborhood character
- Predominantly Hispanic (67%)
- Race & ethnicity
- Hispanic / Latino 67% White 30% Two or more races 10% Native American 3% Asian 2%
- Hispanic origin (detail)
- Mexican 65%
- Common ancestry
- Russian 14% Lithuanian 4% Italian 3%
- Foreign-born
- 34% · Canada
- Languages at home
- 41% English-only · Spanish 51% Other Indo-European 6% Tagalog/Filipino 1%
Political lean MEDSL · Merced
- 2024 margin
- Toss-up / Even · D 46.5% · R 50.9% · Other 2.6%
- 2008→2024 swing
- -12.7pp toward R · 2008: 8.3pp · 2024: -4.4pp
- All cycles
- 2024: R+4.4 2020: D+10.6 2016: D+7.9 2012: D+5.4 2008: D+8.3
Not yet ingested
- Civics
- —
Market trends
- HPI YoY
- ▼ -119.43%
- Current HPI
- 264.2504
- Rent YoY
- —
- Metro
- —
- State GDP YoY
- ▲ 3.21%
- F500 in state
- 116
Industry mix (Fortune 500 HQ in CA)
| Industry | F500 HQs | Revenue |
|---|---|---|
| Technology | 27 | $1,492B |
|
||
| Financial Services | 3 | $174B |
|
||
| Retail | 3 | $44B |
|
||
| Insurance | 3 | $26B |
|
||
| Media / Entertainment | 2 | $115B |
|
||
| Pharmaceuticals / Biotech | 2 | $62B |
|
||
Cash-flow waterfall
monthlySold comps — $/sqft
last 12 mo · ≤1 miLoading sold comps…