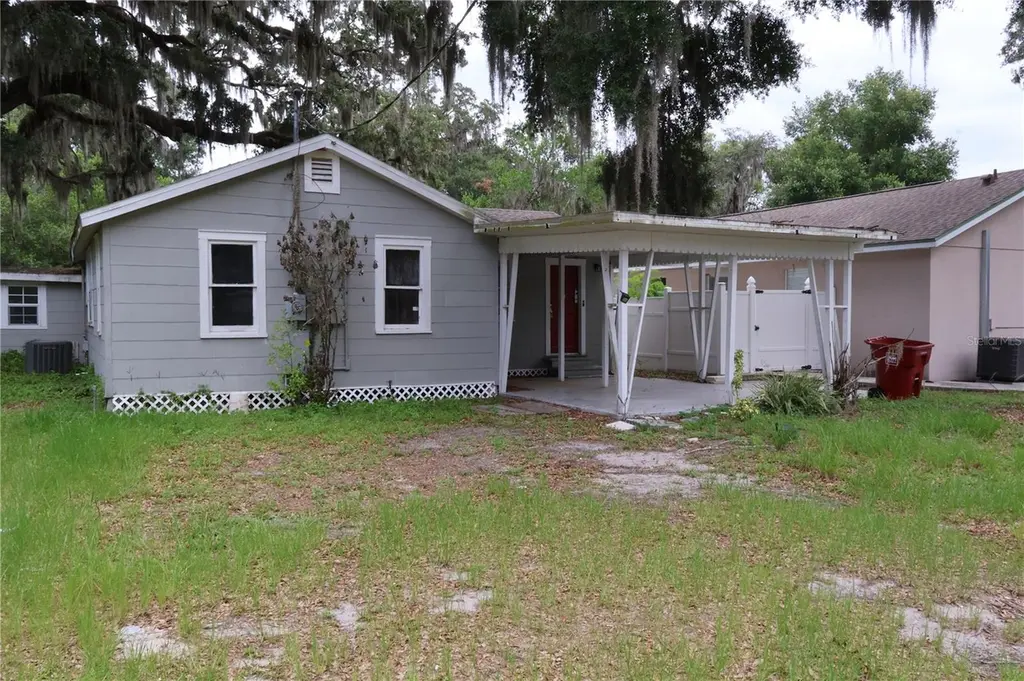
1202 N Ferrell St · Plant City, FL
Flood risk 1/10 · Minimal
- FEMA flood zone
- X (unshaded)
- Chance of flooding over 30 yrs
- 0.0%
- Est. flood insurance / yr
- $507 – $1,088
Fire risk 3/10 · Minor
- Est. fire insurance / yr
- $947 – $1,759
Heat risk 9/10 · Severe
- Hot days now (above 108°F)
- 7 days/yr
- Hot days in 30 yrs
- 24 days/yr
Wind risk 9/10 · Severe
- Chance of severe wind over 30 yrs
- 99.0%
Air-quality risk 3/10 · Minor
- Unhealthy air days now
- 2 days/yr
- Unhealthy air days in 30 yrs
- 3 days/yr
Risk factors via First Street. Map © Google.
Why this score? — see what drove the D grade
The composite is a weighted blend of 9 inputs, each scored 0–100. Each bar is that input's sub-score; the figure is the points it added to the 100-point composite (weight × sub-score).
- Cash flow +13.1/30.0
- ARV discount +7.5/15.0
- Schools +4.2/10.0
- 1% rule +3.9/10.0
- DSCR +3.9/10.0
- Livability +3.8/5.0
- Condition / age +2.5/5.0
- Rent growth +2.4/5.0
- Appreciation +0.0/10.0
$199,900
🖨 Deal sheet (PDF) 📄 Offer letter ✓ Due diligence
Listing remarks MLS
Back on the market! This charming 3 bedroom, 1 and a half bath home located in the heart of Plant City is ready for it's new owner! The home is perfectly located with convenience to the historic downtown Plant City and I-4 for easy commutes. You will be welcomed by the large, open livingroom offering lots of natural light and plenty of space. The home offers a split bedroom plan with two bedrooms at the front of the home while the third bedroom is located at the rear with private access to the full bathroom that offers Jack and Jill access to the home. At the heart of the home is the beautifully renovated kitchen. The kitchen was fully updated 4 years ago with new appliances, tile floor, granite countertops, cabinets, and more. In 2018, the roof was replaced with 30-year shingles, a new A/C system with new ductwork, and new hot water heater. The home is ready for your personal touch. Schedule your showing today!
Key facts
- 6,160 sq ft lot
- Built 1950
- Listed 16 days
Property features AI
Finance
- Other: Lot approximately 0.14 acres (56 x 110); Roads are asphalt/paved
- HOA & community: No association; Pets allowed
Exterior
- Utilities: Public water; Public sewer; Electricity connected; Cable available; Broadband/high-speed internet available; Water connected; Sewer connected
- Home design: Single family residence; One story; Faces west; Residential property
- Construction: Asbestos construction materials; Shingle roof; Slab foundation; Built as one-story
- Exterior features: Covered porch; Porch; Rain gutters; Vinyl and wood fencing; City limits lot
Interior
- Kitchen: Dishwasher; Range; Microwave; Refrigerator; Stone counters; Solid wood cabinets; Eat-in kitchen
- Bedrooms: 3 bedrooms
- Flooring: Tile; Vinyl
- Bathrooms: 1 full bathroom; 1 half bathroom
- Heating & cooling: Heating: Other; Cooling: Other; Thermostat
- Interior features: Ceiling fans; Eat-in kitchen; Kitchen/family room combo; Living room/dining room combo; Open floorplan; Solid wood cabinets; Stone counters; Thermostat
- Laundry & utility: Dedicated laundry room; Washer; Dryer
Neighborhood map
What this means for you Summary
Snapshot
- This is a 3-bed/2.0-bath single-family listed at $200k.
Deal economics
- At list price, monthly cash flow is $-7 ($-84/yr) — negative.
- To cash-flow at today's rent, offer at most $199k (0.6% below list).
- To meet the 1% rule (rent ≥ 1% of price), the offer needs to be $178k (11.2% below list).
- Recommended offer: $178k (11.2% below list) — sets the bar for 1% rule.
Location & tenants
- Location reads 76/100 on livability (#227 in FL, #3,587 nationally) — a middle-class / working-renter tenant base. Strengths: amenities A+, cost of living A+, housing A+; Watch: employment C-, commute F.
- Hillsborough (suburban): math 47% / reading 50% proficiency, ranked #41 of 73 in FL (top 56%) — families likely to look elsewhere, expect single-tenant / working-renter base with shorter leases.
- Zoned schools: Wilson Elementary School (math 37% / reading 37%, grade F, #1,609 of 2,144 statewide, top 77%, 317 students, 89% FRL); Tomlin Middle School (math 45% / reading 39%, grade D-, #340 of 571 statewide, top 61%, 1,499 students, 64% FRL); Plant City High School (math 38% / reading 40%, grade F, #312 of 667 statewide, top 48%, 2,474 students, 58% FRL) — zoned schools average 70% FRL vs 52% district-wide (18 pts higher); higher-poverty schools than district average — tighter screening recommended.
- Market conditions: Rents soft (-0.6%/yr); 183 active listings in the ZIP; 22 comparable units currently listed for rent nearby; rentals at typical pace (median 27d on market — plan ~3-4 weeks tenant-placement turnaround); 9,053 units permitted in Hillsborough County in 2024 (4,555 in 5+ unit buildings).
- This rent runs 35% of the median local income ($60k/yr) — at the standard rent-burdened threshold; future hikes will face affordability resistance.
Forward outlook
- Local home prices are declining (-3.0%/yr); year-one equity from $1k of loan paydown is wiped out by about $6k of value loss. Plan a longer hold.
- Hillsborough County population projected at +37% by 2050 — long-run rental-demand tailwind backs the buy-and-hold thesis.
Negotiation context
- It's been on market 16 days — a 2% lower offer ($197k) is reasonable based on typical stale-listing flexibility.
- 9 sale attempts since 18y ago with the ask held roughly flat each time — persistent listings suggest the price (not the market) is what's stuck; bring a comps-based counter.
Risks & watch-outs
- Watch-outs: built in 1950 — expect roof / HVAC / electrical / plumbing capex.
- Climate carrying-cost: severe wind risk, 99% chance of damaging wind over 30y; extreme-heat days projected 7→24/yr by 2055 (HVAC capex compounding) — expect insurance premiums to compound above CPI over the hold.
Questions for the listing agent
- What do current leases actually rent for vs. the listed asking? Can we see a recent rent roll and the last 12 months of T-12 income?
- Built in 1950 — when were the roof, HVAC, electrical panel, plumbing, and water heater last replaced?
- Is there a deadline driving the sale (1031 exchange, divorce, estate, relocation)? That informs how much negotiation room exists.
- Schools are D-rated, which usually means shorter tenancies and higher turnover. Who's the typical renter profile here, and what's been the actual vacancy rate?
- The area grade is low — what's the realistic commute time and amenity access for the typical tenant pool here? Any planned neighborhood developments (good or bad) we should know about?
- What's the average days-on-market for RENTAL listings here right now (not sales)? A rising rental-DOM trend means longer vacancies and softer asking-rent achievability than the comps imply.
- What's the recent tenant-quality profile in this submarket — average credit score on applications, eviction rate, late-payment / NSF rate, and stable-employment percentage? A property-management company in the area should have these aggregated.
- How much new for-sale + rental construction is in the pipeline within 1–3 miles? Heavy new supply typically softens prices + rents 12–24 months out; constrained supply supports both.
Investment metrics
- 1% rule
- 0.89% ✗
- Cap rate
- 6.25%
- Cash-on-cash
- -0.15%
- DSCR
- 0.99
- GRM
- 9.4
CMA / ARV
No comps found within radius.
Projected returns pro-forma
-3.0% appreciation · 0.0% rent growth · sell at horizon
- IRR
- -20.0%
- Equity multiple
- 0.32×
- Total profit
- $-38,001
- Equity at exit
- $29,806
- IRR
- -21.6%
- Equity multiple
- 0.04×
- Total profit
- $-53,600
- Equity at exit
- $17,284
Cash invested: $55,972 (down + closing). Projections, not guarantees.
Landlord ↔ Tenant lean methodology
- Overall (STATE)
- 87 Strongly Landlord-Friendly
- State Florida
- 87 Strongly Landlord-Friendly · R+3
- County
- — inherits STATE
- City
- — inherits STATE
ZIP-level market 33563
- Home prices YoY
- -23.2%
- Rents YoY
- -0.6%
- Active inventory
- 183
- Price-to-rent
- 9.4×
Monthly cashflow live
- Estimated rent
- $1,776 high interval (Pro) →
- Mortgage (P&I)
- −$1,048
- Tax from tax record
- −$278 /mo · $3,341/yr
- Insurance
- −$83
- HOA
- −$0
- Vacancy / Maint / Mgmt
- −$373
- Net cashflow
- $-7
Break-even live
Sensitivity live
| Price | -10% $106 | -5% $50 | +0% $-7 | +5% $-64 | +10% $-120 |
|---|---|---|---|---|---|
| Rent | -10% $-147 | -5% $-77 | +0% $-7 | +5% $63 | +10% $133 |
| Rate | -1.0pp $94 | -0.5pp $44 | base $-7 | +0.5pp $-59 | +1.0pp $-112 |
UW: 25.0% down · 7.5% · 30yr · 1.5% tax · 5.0% vac · 8.0% maint · 8.0% mgmt
Financing live
Cash to close
- Down payment
- $49,975
- Closing costs
- $5,997
- Reserves months
- —
- Total cash needed
- —
Loan-product check · same deal, 3 products live
Conventional
25% down · 7.5% · 30yr
- Down + closing
- —
- Monthly P&I
- —
- Monthly cashflow
- —
- DSCR
- —
- Eligible?
- —
Personal DTI + credit; lowest rate.
DSCR
20% down · 8.5% · 30yr
- Down + closing
- —
- Monthly P&I
- —
- Monthly cashflow
- —
- DSCR
- —
- Eligible?
- —
No personal income docs; deal must DSCR.
Hard money
10% down · 12.0% · 12mo
- Down + closing
- —
- Monthly P&I
- —
- Monthly cashflow
- —
- DSCR
- —
- Eligible?
- —
Short-term bridge; refi at stabilization.
Rent comps 22 comps
| Address | Beds | Baths | Sqft | Rent | $/sqft | DOM | Units | Dist |
|---|---|---|---|---|---|---|---|---|
| 1309 N Franklin St Plant City, FL | 2.0 | 2.0 | 1042 | $1,750 | $1.68 | 7d | 1 | 0.15mi |
| 1408 Spencer Ct Apt A Plant City, FL | 2.0 | 1.0 | 754 | $1,200 | $1.59 | 26d | 1 | 0.44mi |
| 603 N Dort St Plant City, FL | 1.0–2.0 | 1.0–2.0 | 975 | $1,699 | $1.74 | 3d | 11 | 0.54mi |
| 603 N Dort St Unit 1106-H Plant City, FL | 2.0 | 1.5 | 1100 | $1,699 | $1.54 | 17d | 1 | 0.54mi |
| 603 N Dort St Unit 1306-2B Plant City, FL | 2.0 | 1.0 | 900 | $1,449 | $1.61 | 24d | 1 | 0.54mi |
| 603 N Dort St Unit 609-A Plant City, FL | 2.0 | 2.0 | 1200 | $1,699 | $1.42 | 13d | 1 | 0.54mi |
| 603 N Dort St Unit 1106-E Plant City, FL | 2.0 | 1.5 | 1100 | $1,699 | $1.54 | 26d | 1 | 0.54mi |
| 507 W Baker St Plant City, FL | 2.0 | 1.0 | 1000 | $1,199 | $1.20 | 26d | 1 | 0.69mi |
| 1712 W House St Unit B Plant City, FL | 2.0 | 1.0 | 1500 | $1,200 | $0.80 | 18d | 1 | 0.71mi |
| 1802 W House St Unit B Plant City, FL | 2.0 | 1.0 | 800 | $1,575 | $1.97 | 1d | 1 | 0.73mi |
| 111 Pearl St Plant City, FL | 2.0 | 1.0 | 850 | $1,500 | $1.76 | 26d | 1 | 0.76mi |
| 105 N Davis St Unit 1 Plant City, FL | 3.0 | 1.0 | 1300 | $1,400 | $1.08 | 26d | 1 | 0.80mi |
| 1211 Goldfinch Dr Plant City, FL | 1.0–2.0 | 1.0 | 770 | $1,593 | $2.07 | 0d | 12 | 0.80mi |
| 113 S Collins St Apt 2 Plant City, FL | 2.0 | 1.0 | 850 | $1,400 | $1.65 | 26d | 1 | 0.96mi |
| 809 1/2 W Warren St Plant City, FL | 3.0 | 2.0 | 947 | $1,650 | $1.74 | 26d | 1 | 1.07mi |
| 1004 N Gordon St Plant City, FL | 3.0 | 2.0 | 1198 | $1,750 | $1.46 | 26d | 1 | 1.17mi |
| 1001 Jenkins St Unit A Plant City, FL | 2.0 | 1.0 | 1000 | $2,050 | $2.05 | 26d | 1 | 1.24mi |
| 501 W Ball St Unit 705-13 Plant City, FL | 2.0 | 1.0 | 780 | $1,499 | $1.92 | 24d | 1 | 1.26mi |
| 501 W Ball St Unit 609-02 Plant City, FL | 2.0 | 1.0 | 780 | $1,499 | $1.92 | 5d | 1 | 1.26mi |
| 501 W Ball St Unit 509-22 Plant City, FL | 3.0 | 1.0 | 915 | $1,699 | $1.86 | 0d | 1 | 1.26mi |
| 1204 W Alsobrook St Plant City, FL | 2.0 | 1.0 | 1218 | $1,750 | $1.44 | 26d | 1 | 1.28mi |
| 1005 N Bracewell Dr Plant City, FL | 3.0 | 2.0 | 1428 | $2,200 | $1.54 | 26d | 1 | 1.48mi |
Listing history 11 events
-
2026-06-21days on market $199,900 Active 16 DOM
-
2026-06-18days on market $199,900 Active 13 DOM
-
2026-06-17days on market $199,900 Active 12 DOM
-
2026-06-16days on market $199,900 Active 11 DOM
-
2026-06-15days on market $199,900 Active 10 DOM
-
2026-06-13days on market $199,900 Active 8 DOM
-
2026-06-13days on market $199,900 Active 7 DOM
-
2026-06-09days on market $199,900 Active 4 DOM
-
2026-06-08days on market $199,900 Active 3 DOM
-
2026-06-07remarks 246-char remark
-
2026-06-07$199,900 Active 2 DOM
ⓘ Source: listings_history table (triggers on properties + properties_extension) + one-shot
backfill from property_details.listing_events for pre-trigger history.
Tax reassessment forecast FL · Resets to sale price
- Current annual tax
- $3,341 · $278/mo
- Projected year-2 tax
- $3,341 · $278/mo
- Expected delta
- $0/yr ($0/mo · 0.0%)
ⓘ Screening estimate from a state-policy table — verify with the county assessor before closing.
Climate risk First Street
- Flood 1/10 Low FEMA zone X (unshaded) · 0% chance over 30 yrs
- Wildfire 3/10 Moderate
- Heat 9/10 Extreme 7 d/yr ≥108°F today · 24 d/yr by 30 yrs out
- Wind 9/10 Extreme 99% chance of damaging wind over 30 yrs
- Air quality 3/10 Moderate 2 unhealthy d/yr today · 3 by 30 yrs out
Nearby sold comps map
Loading sold comps map…
Walkable amenities ~0.75 mi
Loading nearby amenities…
Taxation est. · year 1
- Rental income
- $21,310
- − Mortgage interest
- −$11,198
- − Property taxes
- −$3,341
- − Insurance
- −$1,000
- − Repairs & maintenance
- −$1,705
- − Management
- −$1,705
- − Depreciation
- −$5,815
- Taxable loss
- −$3,452
- Est. tax savings @ 24.0%
- +$829
- After-tax cash flow
- $744/yr
For passive investors: Depreciation is non-cash, so a rental often shows a tax loss while cash-flowing — sheltering income. Rental losses are passive: they offset passive income freely, and up to $25,000/yr can offset ordinary (W-2) income if you actively participate and your MAGI is under $100k (phasing out to $0 by $150k); unused losses carry forward. On sale, claimed depreciation is recaptured at up to 25%, and gains may owe capital-gains tax (a 1031 exchange can defer both). Figures are a year-1 estimate at your 24.0% rate — not tax advice; consult a CPA.
Schools (NCES district)
- District
- Hillsborough
- NCES district ID
- 1200870
- Math proficiency
- 47% ▼ -8.00%
- Reading proficiency
- 50% ▼ -4.00%
- Median HH income
- $50,622
- Composite
- 41.6/100
- National rank
- #3435
- State rank
- #41 of 73 in FL
Livability — Plant City
- Score
- 76/100
- State rank
- #227
- US rank
- #3587
Category grades
Schools grade is shown separately in the Schools card above.
Census & demographics
- Census place
- Plant City, FL
- County
- Hillsborough County · 1,540,968 people
- City population
- 68,525
- Metro
- Tampa-St. Petersburg-Clearwater, FL
- Population (ZIP)
- 25,896
- Household income
- $60,131
- Rent vs Own
- Severe rent burden
- 932.0
Population outlook (Hillsborough County) Hauer SSP2
- Today (2025)
- 1,607,022 people
- By 2030
- 1,733,968 · +7.9%
- By 2040
- 1,979,565 · +23.2%
- By 2050
- 2,203,427 · +37.1%
- By 2075
- 2,667,893 · +66.0%
- By 2100
- 2,891,558 · +79.9%
Race, ethnicity, and origin ACS 2023
- Neighborhood character
- Diverse neighborhood (Simpson 0.64)
- Race & ethnicity
- White 43% Hispanic / Latino 39% Black 15% Two or more races 15% Native American 2%
- Hispanic origin (detail)
- Mexican 24% Puerto Rican 5% Cuban 1%
- Common ancestry
- Lithuanian 2% Italian 1% Slovak 1%
- Foreign-born
- 16% · Canada, Jamaica
- Languages at home
- 66% English-only · Spanish 34%
Political lean MEDSL · Hillsborough
- 2024 margin
- Toss-up / Even · D 47.8% · R 50.9% · Other 1.3%
- 2008→2024 swing
- -10.2pp toward R · 2008: 7.1pp · 2024: -3.1pp
- All cycles
- 2024: R+3.1 2020: D+6.9 2016: D+6.8 2012: D+6.7 2008: D+7.1
Not yet ingested
- Civics
- —
Market trends
- HPI YoY
- ▼ -103.29%
- Current HPI
- 342.5789
- Rent YoY
- ▼ -0.57%
- Metro
- Tampa-St. Petersburg-Clearwater, FL
- State GDP YoY
- ▲ 3.28%
- F500 in state
- 36
Industry mix (Fortune 500 HQ in FL)
| Industry | F500 HQs | Revenue |
|---|---|---|
| Industrial Technology | 2 | $29B |
|
||
| Insurance | 2 | $17B |
|
||
| Retail | 1 | $60B |
|
||
| Technology Distribution | 1 | $58B |
|
||
| Homebuilding | 1 | $35B |
|
||
| Technology Manufacturing | 1 | $35B |
|
||
Price history
+207.5% since first listed34 events — show timeline
- 2026-06-05 Listed $199,900 Stellar MLS as Distributed by MLS Grid
- 2022-08-19 Sold (Public Records) $230,000 Public Records
- 2022-08-17 Sold (MLS) $230,000 Stellar MLS as Distributed by MLS Grid
- 2022-07-06 Pending — Stellar MLS as Distributed by MLS Grid
- 2022-07-06 Relisted — Stellar MLS as Distributed by MLS Grid
- 2022-06-29 Pending — Stellar MLS as Distributed by MLS Grid
- 2022-06-15 Listed $230,000 Stellar MLS as Distributed by MLS Grid
- 2019-01-24 Sold (Public Records) $140,000 Public Records
- 2019-01-22 Sold (MLS) $140,000 Stellar MLS as Distributed by MLS Grid
- 2019-01-09 Pending — Stellar MLS as Distributed by MLS Grid
- 2018-12-18 Price Changed $145,000 Stellar MLS as Distributed by MLS Grid
- 2018-12-17 Price Changed $149,200 Stellar MLS as Distributed by MLS Grid
- 2018-12-16 Relisted — Stellar MLS as Distributed by MLS Grid
- 2018-12-15 Listing Removed — Stellar MLS as Distributed by MLS Grid
- 2018-12-11 Price Changed $149,300 Stellar MLS as Distributed by MLS Grid
- 2018-11-26 Price Changed $149,400 Stellar MLS as Distributed by MLS Grid
- 2018-11-19 Relisted — Stellar MLS as Distributed by MLS Grid
- 2018-11-10 Pending — Stellar MLS as Distributed by MLS Grid
- 2018-11-01 Relisted — Stellar MLS as Distributed by MLS Grid
- 2018-10-29 Listing Removed — Stellar MLS as Distributed by MLS Grid
- 2018-10-25 Price Changed $149,500 Stellar MLS as Distributed by MLS Grid
- 2018-10-23 Price Changed $149,600 Stellar MLS as Distributed by MLS Grid
- 2018-10-01 Price Changed $149,700 Stellar MLS as Distributed by MLS Grid
- 2018-09-29 Price Changed $149,800 Stellar MLS as Distributed by MLS Grid
- 2018-09-18 Price Changed $149,900 Stellar MLS as Distributed by MLS Grid
- 2018-09-12 Listed $159,900 Stellar MLS as Distributed by MLS Grid
- 2017-09-26 Pending — Stellar MLS as Distributed by MLS Grid
- 2017-09-22 Sold (Public Records) $57,000 Public Records
- 2017-09-22 Sold (MLS) $57,000 Stellar MLS as Distributed by MLS Grid
- 2017-08-24 Listed $69,900 Stellar MLS as Distributed by MLS Grid
- 2008-03-16 Listed $110,000 Stellar MLS as Distributed by MLS Grid
- 2004-07-13 Sold (Public Records) $87,500 Public Records
- 2004-05-07 Sold (Public Records) $90,000 Public Records
- 2001-02-05 Sold (Public Records) $65,000 Public Records
Property tax history
+29.2%/yrLatest (2025): $3,341 · +4.6% YoY. Source: county tax records.
Cash-flow waterfall
monthlySold comps — $/sqft
last 12 mo · ≤1 miLoading sold comps…