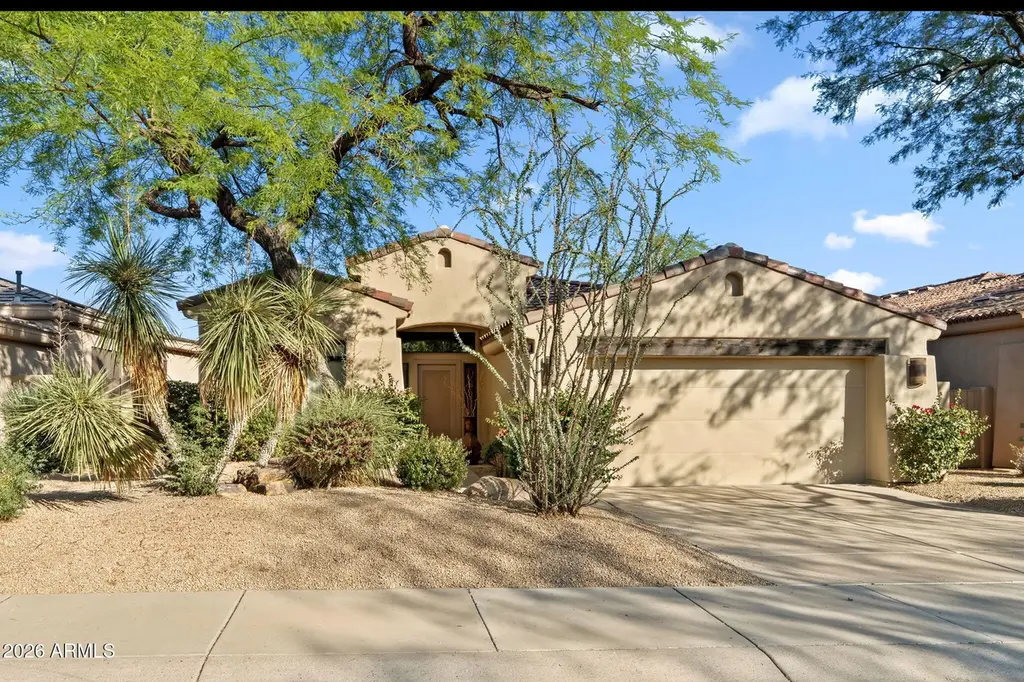
8195 E Sierra Pinta Dr · Scottsdale, AZ
Flood risk 1/10 · Minimal
- FEMA flood zone
- AO
- Chance of flooding over 30 yrs
- 0.0%
- Est. flood insurance / yr
- $848 – $2,087
Fire risk 4/10 · Minor
- Est. fire insurance / yr
- $610 – $1,132
Heat risk 8/10 · Major
- Hot days now (above 111°F)
- 7 days/yr
- Hot days in 30 yrs
- 19 days/yr
Wind risk 1/10 · Minimal
- Chance of severe wind over 30 yrs
- —
Air-quality risk 3/10 · Minor
- Unhealthy air days now
- 3 days/yr
- Unhealthy air days in 30 yrs
- 4 days/yr
Risk factors via First Street. Map © Google.
Why this score? — see what drove the D grade
The composite is a weighted blend of 9 inputs, each scored 0–100. Each bar is that input's sub-score; the figure is the points it added to the 100-point composite (weight × sub-score).
- ARV discount +10.2/15.0
- Appreciation +7.8/10.0
- Cash flow +6.9/30.0
- Livability +4.0/5.0
- Schools +3.8/10.0
- Rent growth +3.6/5.0
- Condition / age +2.5/5.0
- 1% rule +1.2/10.0
- DSCR +1.1/10.0
$1,059,000
🖨 Deal sheet 📄 Offer letter ✓ Due diligence
Listing remarks
Set within the highly sought-after Talon community of Grayhawk, this exceptional residence at 8195 E Sierra Pinta Dr presents a rare opportunity to experience refined Scottsdale living at its finest. Thoughtfully designed with both comfort and elegance in mind, this 3-bedroom, 3-bathroom home offers a spacious and highly functional floor plan, ideal for both everyday living and effortless entertaining. Upon entry, you are welcomed by a warm and sophisticated interior showcasing a curated blend of rich hardwood flooring, elegant porcelain tile, and plush carpeting in all the right places. The inviting great room is anchored by a cozy gas fireplace, creating the perfect ambiance for relaxing
Key facts
- Cozy gas fireplace
- Corian countertops
- Chef's kitchen
Tags
Property features AI
Finance
- Other: Directions provided to property
- HOA & community: Homeowners association with quarterly fee (association covers maintenance of grounds); Community amenities: pool, community spa (heated), golf, gated community, tennis courts, playground, biking/walking paths
Exterior
- Parking: Covered parking for 2; 2-car garage with garage door opener and attached garage cabinets
- Security: Fire sprinkler system; Security guard; Guarded entry
- Utilities: City water; Public sewer
- Home design: Fee simple ownership; Single-family residence
- Construction: Stucco and wood frame construction; Tile roof
- Exterior features: Stucco and painted wood-frame exterior; Tile roof; Private yard; Private street(s); Playground; Sport court(s) and tennis court(s); Built-in barbecue; Misting system; Sprinklers front and rear with auto timers; Desert front and back landscaping; Adjacent to wash; Block and wrought iron fencing; Mountain view
Interior
- Kitchen: Built-in microwave; Kitchen island; Non-laminate counters; Multiple ovens; Pantry / walk-in pantry; Refrigerator; Dishwasher; Garbage disposal
- Bedrooms: Two master bedrooms; Up to 4 bedrooms possible
- Flooring: Carpet; Tile; Wood
- Bathrooms: 3 full bathrooms
- Heating & cooling: Natural gas heating; Central air conditioning; Has heating and cooling; Multi-zone system
- Interior features: High-speed internet; Double vanity in bathrooms; Eat-in kitchen; 9+ foot flat ceilings; No interior steps; Kitchen island; Pantry and walk-in pantry; Two master bathrooms; Full bath in master bedroom; Separate shower and tub; Dual-pane windows; Multi-zone energy-efficient system; Exterior gas fireplace in family room (has fireplace); Carpet, tile and wood flooring
- Laundry & utility: Laundry inside the home
Neighborhood map
What this means for you Summary
Snapshot
- This is a 3-bed/3.0-bath single-family listed at $1.06M.
Deal economics
- At list price, monthly cash flow is $-2k ($-21k/yr) — negative.
- To cash-flow at today's rent, offer at most $751k (29.1% below list).
- To meet the 1% rule (rent ≥ 1% of price), the offer needs to be $657k (37.9% below list).
- Recommended offer: $657k (37.9% below list) — sets the bar for 1% rule.
- Cap rate 4.5% vs local median 2.5% in Scottsdale — top-decile yield for the area; either an underpriced asset or a hidden risk that comps aren't pricing in. Stress-test before assuming the spread holds.
Location & tenants
- Location reads 80/100 on livability (#4 in AZ, #1,756 nationally) — a professional / high-income tenant draw. Strengths: amenities A+, commute A+, employment A+; Watch: health & safety C-, cost of living F.
- Paradise Valley Unified District (4241) (urban): math 39% / reading 46% proficiency, ranked #56 of 249 in AZ (top 22%) — families likely to look elsewhere, expect single-tenant / working-renter base with shorter leases.
- Zoned schools: Grayhawk Elementary School (math 62% / reading 67%, grade B, #104 of 1,109 statewide, top 10%, 358 students, 7% FRL); Mountain Trail Middle School (math 33% / reading 41%, grade F, #57 of 218 statewide, top 27%, 680 students, 24% FRL); Pinnacle High School (math 49% / reading 54%, grade D+, #35 of 381 statewide, top 9%, 2,479 students, 8% FRL) — zoned schools average 13% FRL vs 29% district-wide (17 pts lower); this property's tenant base skews higher-income than the district average.
- Market conditions: Rents rising fast (+4.4%/yr); 720 active listings in the ZIP; 40 comparable units currently listed for rent nearby; rentals lingering (median 44d on market — plan ~5-8 weeks vacancy on turnover, expect pricing pressure); 55% of comp listings sitting > 30 days — soft ceiling on asking rent; high-income renter base; 36,011 units permitted in Maricopa County in 2024 (12,801 in 5+ unit buildings).
- At $6,571/mo this rent would consume 56% of the median local household income ($141k/yr) (locally 1034% of renters already pay >50% of income on rent) — very limited rent-growth headroom before tenants either downsize or default.
Forward outlook
- In year one you build about $67k of equity ($7k loan paydown + $60k appreciation (5.6% local appreciation)).
- Maricopa County population projected at +38% by 2050 — long-run rental-demand tailwind backs the buy-and-hold thesis.
- By year 2, paydown + projected appreciation supports a ~$107k cash-out refi (75% LTV) — recoverable capital for the next deal without selling this one.
Negotiation context
- It's been on market 36 days — a 3% lower offer ($1.03M) is reasonable based on typical stale-listing flexibility.
- 3 sale attempts since 4y ago with the ask held roughly flat each time — persistent listings suggest the price (not the market) is what's stuck; bring a comps-based counter.
Risks & watch-outs
- Watch-outs: flood insurance adds $122/mo.
- Climate carrying-cost: in FEMA flood zone AO (mandatory federal flood insurance); extreme-heat days projected 7→19/yr by 2055 (HVAC capex compounding) — expect insurance premiums to compound above CPI over the hold.
Questions for the listing agent
- What do current leases actually rent for vs. the listed asking? Can we see a recent rent roll and the last 12 months of T-12 income?
- It's been on market 36 days. Have you received any prior offers? Is the seller open to a 38% concession, seller financing, or rate buy-down credit?
- What's the actual annual flood-insurance premium (NFIP or private), and is the property in a SFHA with mandatory coverage?
- What does the HOA fee cover, when was the last increase, and are there any pending special assessments or reserve-fund shortfalls?
- Is there a deadline driving the sale (1031 exchange, divorce, estate, relocation)? That informs how much negotiation room exists.
- Schools are A-rated — typically a magnet for longer-tenancy family renters. What's the average tenant stay here, and is there a school-zone premium baked into asking?
- The area grade is low — what's the realistic commute time and amenity access for the typical tenant pool here? Any planned neighborhood developments (good or bad) we should know about?
- What's the average days-on-market for RENTAL listings here right now (not sales)? A rising rental-DOM trend means longer vacancies and softer asking-rent achievability than the comps imply.
- What's the recent tenant-quality profile in this submarket — average credit score on applications, eviction rate, late-payment / NSF rate, and stable-employment percentage? A property-management company in the area should have these aggregated.
- How much new for-sale + rental construction is in the pipeline within 1–3 miles? Heavy new supply typically softens prices + rents 12–24 months out; constrained supply supports both.
Investment metrics
- 1% rule
- 0.62% ✗
- Cap rate
- 4.46%
- Cash-on-cash
- -6.56%
- DSCR
- 0.71
- GRM
- 13.4
CMA / ARV
- ARV (median comp)
- $1,126,661
- List price
- $1,059,000
- Delta
- -6.01%
- Verdict
- FAIR
- Comps
- 20 within 1.0 mi
Show comp detail 12 sales within ~0.75 mi
| Address | Dist | Beds/Ba | Sqft | Sold | Price | $/sf | Match |
|---|---|---|---|---|---|---|---|
| 8179 E Sierra Pinta Dr | 0.02mi | 3/3.0 | 2,253 (0%) | 5mo | $1,150,000 | $510 | 94 |
| 8248 E Chino Dr | 0.03mi | 3/3.0 | 2,290 (+2%) | 8mo | $1,255,000 | $548 | 89 |
| 8218 E Mountain Spring Rd | 0.18mi | 2/2.5 (-1) | 2,243 (-0%) | 2mo | $861,000 | $384 | 82 |
| 8262 E Gilded Perch Dr | 0.23mi | 3/2.0 | 2,306 (+2%) | 9mo | $1,237,500 | $537 | 74 |
| 19712 N 84th St | 0.29mi | 3/2.5 | 2,423 (+8%) | 1mo | $1,885,000 | $778 | 71 |
| 8464 E Gilded Perch Dr | 0.35mi | 3/3.0 | 2,431 (+8%) | 2mo | $1,140,000 | $469 | 69 |
| 8258 E Mountain Spring Rd | 0.18mi | 3/3.0 | 2,520 (+12%) | 5mo | $1,000,000 | $397 | 68 |
| 19838 N 84th St | 0.25mi | 3/3.0 | 2,549 (+13%) | 0mo | $1,745,000 | $685 | 66 |
| 20683 N 79th Way | 0.51mi | 2/2.5 (-1) | 2,242 (-0%) | 3mo | $1,130,000 | $504 | 66 |
| 8209 E Hoverland Rd | 0.37mi | 3/2.0 | 2,418 (+7%) | 6mo | $1,047,500 | $433 | 62 |
| 19478 N 84th St | 0.44mi | 3/3.0 | 2,544 (+13%) | 4mo | $1,250,000 | $491 | 55 |
| 7804 E Tailspin Ln | 0.58mi | 4/2.5 (+1) | 2,441 (+8%) | 7mo | $970,000 | $397 | 46 |
Match score weights: distance 35% · size 25% · config 20% · recency 20%. Top-matched comps best support the ARV.
Projected returns pro-forma
5.64% appreciation · 4.42% rent growth · sell at horizon
- IRR
- 9.1%
- Equity multiple
- 1.61×
- Total profit
- $181,468
- Equity at exit
- $641,601
- IRR
- 11.0%
- Equity multiple
- 3.18×
- Total profit
- $647,406
- Equity at exit
- $1,143,236
Cash invested: $296,520 (down + closing). Projections, not guarantees.
Landlord ↔ Tenant lean methodology
- Overall (STATE)
- 87 Strongly Landlord-Friendly
- State Arizona
- 87 Strongly Landlord-Friendly · R+3
- County
- — inherits STATE
- City
- — inherits STATE
ZIP-level market 85255
- Home prices YoY
- 1.7%
- Rents YoY
- 4.4%
- Active inventory
- 720
- Price-to-rent
- 13.4×
Monthly cashflow live
- Estimated rent
- $6,571 high interval (Pro) →
- Mortgage (P&I)
- −$5,554
- Tax from tax record
- −$408 /mo · $4,894/yr
- Insurance
- −$441
- Flood insurance flood zone
- −$122 /mo · $1,468/yr
- HOA
- −$409
- Vacancy / Maint / Mgmt
- −$1,380
- Net cashflow
- $-1,743
Break-even live
UW: 25.0% down · 7.5% · 30yr · 1.5% tax · 5.0% vac · 8.0% maint · 8.0% mgmt
Financing live
Cash to close
- Down payment
- $264,750
- Closing costs
- $31,770
- Reserves months
- —
- Total cash needed
- —
Loan-product check · same deal, 3 products live
Conventional
25% down · 7.5% · 30yr
- Down + closing
- —
- Monthly P&I
- —
- Monthly cashflow
- —
- DSCR
- —
- Eligible?
- —
Personal DTI + credit; lowest rate.
DSCR
20% down · 8.5% · 30yr
- Down + closing
- —
- Monthly P&I
- —
- Monthly cashflow
- —
- DSCR
- —
- Eligible?
- —
No personal income docs; deal must DSCR.
Hard money
10% down · 12.0% · 12mo
- Down + closing
- —
- Monthly P&I
- —
- Monthly cashflow
- —
- DSCR
- —
- Eligible?
- —
Short-term bridge; refi at stabilization.
Rent comps 40 comps
| Address | Beds | Baths | Sqft | Rent | $/sqft | DOM | Units | Dist |
|---|---|---|---|---|---|---|---|---|
| 8182 E Sierra Pinta Dr Scottsdale, AZ | 3.0 | 3.0 | 2476 | $3,950 | $1.60 | 44d | 1 | 0.04mi |
| 8136 E Beardsley Rd Scottsdale, AZ | 2.0 | 2.5 | 2244 | $5,950 | $2.65 | 43d | 1 | 0.09mi |
| 8184 E Beardsley Rd Scottsdale, AZ | 2.0 | 2.5 | 2244 | $8,500 | $3.79 | 43d | 1 | 0.10mi |
| 19838 N 84th St Scottsdale, AZ | 3.0 | 3.0 | 2549 | $12,000 | $4.71 | 13d | 1 | 0.24mi |
| 8227 E Angel Spirit Dr Scottsdale, AZ | 3.0 | 2.0 | 2366 | $4,000 | $1.69 | 43d | 1 | 0.26mi |
| 8224 E Angel Spirit Dr Scottsdale, AZ | 3.0 | 2.0 | 2306 | $9,500 | $4.12 | 3d | 1 | 0.29mi |
| 8228 E Mohawk Ln Scottsdale, AZ | 2.0 | 2.0 | 2306 | $8,500 | $3.69 | 43d | 1 | 0.35mi |
| 20802 N Grayhawk Dr Scottsdale, AZ | 2.0–3.0 | 2.5 | 2295 | $6,000 | $2.61 | 1d | 2 | 0.50mi |
| 20802 N Grayhawk Dr Scottsdale, AZ | 2.0–3.0 | 2.5 | 2030 | $8,000 | $3.94 | 43d | 4 | 0.50mi |
| 19550 N Grayhawk Dr Scottsdale, AZ | 2.0–3.0 | 2.0–3.5 | 1814 | $7,150 | $3.94 | 43d | 4 | 0.52mi |
| 20394 N 78th St Scottsdale, AZ | 4.0 | 2.5 | 2441 | $8,500 | $3.48 | 43d | 1 | 0.57mi |
| 20458 N 78th Way Scottsdale, AZ | 4.0 | 2.0 | 1834 | $4,500 | $2.45 | 24d | 1 | 0.57mi |
| 7743 E Nestling Way Scottsdale, AZ | 4.0 | 2.5 | 2440 | $9,000 | $3.69 | 43d | 1 | 0.61mi |
| 7746 E Nestling Way Scottsdale, AZ | 4.0 | 2.5 | 2575 | $3,995 | $1.55 | 43d | 1 | 0.62mi |
| 7798 E Buteo Dr Scottsdale, AZ | 4.0 | 2.5 | 2575 | $4,600 | $1.79 | 5d | 1 | 0.62mi |
| 19475 N Grayhawk Dr Scottsdale, AZ | 2.0–4.0 | 2.0–3.5 | 2155 | $5,598 | $2.60 | 43d | 5 | 0.63mi |
| 7729 E Tailspin Ln Scottsdale, AZ | 3.0 | 2.0 | 1634 | $3,400 | $2.08 | 7d | 1 | 0.63mi |
| 20121 N 76th St #2043 Scottsdale, AZ | 2.0 | 2.0 | 1854 | $3,550 | $1.91 | 43d | 1 | 0.65mi |
| 7940 E Quill Ln Scottsdale, AZ | 4.0 | 3.5 | 3127 | $15,000 | $4.80 | 43d | 1 | 0.68mi |
| 7789 E Journey Ln Scottsdale, AZ | 3.0 | 2.0 | 1634 | $4,700 | $2.88 | 43d | 1 | 0.69mi |
| 7917 E Thunderhawk Rd Scottsdale, AZ | 4.0 | 3.0 | 2839 | $7,500 | $2.64 | 43d | 1 | 0.70mi |
| 7953 E Thunderhawk Rd Scottsdale, AZ | 3.0 | 3.5 | 2715 | $11,500 | $4.24 | 43d | 1 | 0.71mi |
| 7725 E Journey Ln Scottsdale, AZ | 3.0 | 2.0 | 1882 | $4,250 | $2.26 | 5d | 1 | 0.72mi |
| 20750 N 87th St Scottsdale, AZ | 2.0–3.0 | 2.0–3.0 | 1930 | $7,500 | $3.89 | 21d | 9 | 0.76mi |
| 20750 N 87th St Scottsdale, AZ | 2.0–3.0 | 2.0–3.0 | 1930 | $7,500 | $3.89 | 24d | 8 | 0.76mi |
| 19700 N 76th St Scottsdale, AZ | 2.0–3.0 | 2.0 | 1633 | $6,500 | $3.98 | 43d | 7 | 0.80mi |
| 19700 N 76th St Scottsdale, AZ | 2.0–3.0 | 2.0 | 1633 | $6,500 | $3.98 | 4d | 14 | 0.80mi |
| 7689 E Quill Ln Scottsdale, AZ | 3.0 | 3.0 | 2319 | $8,000 | $3.45 | 43d | 1 | 0.82mi |
| 8891 E Mountain Spring Rd Scottsdale, AZ | 2.0 | 2.5 | 2431 | $5,500 | $2.26 | 4d | 1 | 0.84mi |
| 7711 E Thunderhawk Rd Scottsdale, AZ | 4.0 | 3.0 | 2538 | $3,895 | $1.53 | 14d | 1 | 0.85mi |
| 7670 E Quill Ln Scottsdale, AZ | 3.0 | 2.0 | 2650 | $4,200 | $1.58 | 21d | 1 | 0.86mi |
| 8882 E Flathorn Dr Scottsdale, AZ | 3.0 | 3.0 | 2390 | $8,000 | $3.35 | 43d | 1 | 0.88mi |
| 8890 E Flathorn Dr Scottsdale, AZ | 2.0 | 3.0 | 2431 | $8,000 | $3.29 | 21d | 1 | 0.89mi |
| 19330 N 88th Way Scottsdale, AZ | 4.0 | 2.5 | 2583 | $6,295 | $2.44 | 12d | 1 | 0.93mi |
| 19700 N 76th St Unit 1546077P Scottsdale, AZ | 2.0 | 2.0 | 1722 | $3,226 | $1.87 | 14d | 1 | 0.93mi |
| 20704 N 90th Pl Scottsdale, AZ | 2.0–3.0 | 2.0–3.5 | 1849 | $15,000 | $8.11 | 7d | 4 | 1.05mi |
| 9270 E Thompson Peak Pkwy Scottsdale, AZ | 3.0 | 3.0 | 2165 | $8,750 | $4.04 | 43d | 2 | 1.13mi |
| 19355 N 73rd Way Unit E-2015 Scottsdale, AZ | 3.0 | 3.0 | 2396 | $8,500 | $3.55 | 43d | 1 | 1.19mi |
| 20801 N 90th Pl Unit 01 Scottsdale, AZ | 3.0 | 2.0 | 1576 | $6,450 | $4.09 | 43d | 1 | 1.21mi |
| 20801 N 90th Pl Scottsdale, AZ | 2.0–3.0 | 2.0 | 1437 | $6,450 | $4.49 | 1d | 4 | 1.21mi |
HOA detail
- Monthly dues
- $409 · $4,908/yr
- Likely covers
- gas
Listing history 20 events
-
2026-06-18days on market $1,059,000 Active 36 DOM
-
2026-06-17days on market $1,059,000 Active 35 DOM
-
2026-06-16days on market $1,059,000 Active 34 DOM
-
2026-06-15days on market $1,059,000 Active 33 DOM
-
2026-06-13days on market $1,059,000 Active 31 DOM
-
2026-06-13days on market $1,059,000 Active 30 DOM
-
2026-06-09days on market $1,059,000 Active 27 DOM
-
2026-06-08days on market $1,059,000 Active 26 DOM
-
2026-06-07days on market $1,059,000 Active 25 DOM
-
2026-06-04days on market $1,059,000 Active 22 DOM
-
2026-06-03days on market $1,059,000 Active 21 DOM
-
2026-06-02days on market $1,059,000 Active 20 DOM
-
2026-06-01days on market $1,059,000 Active 19 DOM
-
2026-05-31days on market $1,059,000 Active 18 DOM
-
2026-04-28$1,059,000 Active 2265-char remark
-
2025-07-01historical $4,300
-
2024-06-12$4,300
-
2022-10-07historical
-
2022-08-09price $999,999
-
2022-05-27$1,059,000 Active
ⓘ Source: listings_history table (triggers on properties + properties_extension) + one-shot
backfill from property_details.listing_events for pre-trigger history.
Tax reassessment forecast AZ · Resets to sale price
- Current annual tax
- $4,894 · $408/mo
- Projected year-2 tax
- $6,989 · $582/mo
- Expected delta
- +$2,095/yr (+$175/mo · 42.8%)
ⓘ Screening estimate from a state-policy table — verify with the county assessor before closing.
Climate risk First Street
- Flood 1/10 Low FEMA zone AO · 0% chance over 30 yrs
- Wildfire 4/10 Moderate
- Heat 8/10 Severe 7 d/yr ≥111°F today · 19 d/yr by 30 yrs out
- Wind 1/10 Low
- Air quality 3/10 Moderate 3 unhealthy d/yr today · 4 by 30 yrs out
Nearby sold comps map
Loading sold comps map…
Walkable amenities ~0.75 mi
Loading nearby amenities…
Taxation est. · year 1
- Rental income
- $78,854
- − Mortgage interest
- −$59,320
- − Property taxes
- −$4,894
- − Insurance
- −$6,762
- − Repairs & maintenance
- −$6,308
- − Management
- −$6,308
- − HOA
- −$4,908
- − Depreciation
- −$30,807
- Taxable loss
- −$40,455
- Est. tax savings @ 24.0%
- +$9,709
- After-tax cash flow
- $-11,203/yr
For passive investors: Depreciation is non-cash, so a rental often shows a tax loss while cash-flowing — sheltering income. Rental losses are passive: they offset passive income freely, and up to $25,000/yr can offset ordinary (W-2) income if you actively participate and your MAGI is under $100k (phasing out to $0 by $150k); unused losses carry forward. On sale, claimed depreciation is recaptured at up to 25%, and gains may owe capital-gains tax (a 1031 exchange can defer both). Figures are a year-1 estimate at your 24.0% rate — not tax advice; consult a CPA.
Schools (NCES district)
- District
- Paradise Valley Unified District (4241)
- NCES district ID
- 0405930
- Math proficiency
- 39% ▼ -11.00%
- Reading proficiency
- 46% ▼ -7.00%
- Median HH income
- $64,106
- Composite
- 37.89/100
- National rank
- #4316
- State rank
- #56 of 249 in AZ
Livability — Scottsdale
- Score
- 80/100
- State rank
- #4
- US rank
- #1756
Category grades
Schools grade is shown separately in the Schools card above.
Census & demographics
- Census place
- Scottsdale, AZ
- County
- Maricopa County · 4,537,380 people
- City population
- 290,846
- Metro
- Phoenix-Mesa-Chandler, AZ
- Population (ZIP)
- 45,346
- Household income
- $140,616
- Rent vs Own
- Severe rent burden
- 1034.0
Population outlook (Maricopa County) Hauer SSP2
- Today (2025)
- 4,979,203 people
- By 2030
- 5,378,229 · +8.0%
- By 2040
- 6,156,598 · +23.6%
- By 2050
- 6,872,376 · +38.0%
- By 2075
- 8,401,270 · +68.7%
- By 2100
- 9,247,439 · +85.7%
Race, ethnicity, and origin ACS 2023
- Neighborhood character
- Predominantly White (84%)
- Race & ethnicity
- White 84% Hispanic / Latino 7% Two or more races 6% Asian 4% Black 1%
- Hispanic origin (detail)
- Mexican 3%
- Common ancestry
- Romanian 4% Slovak 3% Italian 2%
- Foreign-born
- 11% · Canada, South Korea, China
- Languages at home
- 88% English-only · Spanish 5% Other Indo-European 3% Other Asian/Pacific 1%
Political lean MEDSL · Maricopa
- 2024 margin
- Toss-up / Even · D 47.7% · R 51.2% · Other 1.1%
- 2008→2024 swing
- +7.1pp toward D · 2008: -10.6pp · 2024: -3.5pp
- All cycles
- 2024: R+3.5 2020: D+2.2 2016: R+3.5 2012: R+12.0 2008: R+10.6
Not yet ingested
- Civics
- —
Market trends
- HPI YoY
- ▲ 5.64%
- Current HPI
- 330.9931
- Rent YoY
- ▲ 4.42%
- Metro
- Phoenix-Mesa-Chandler, AZ
- State GDP YoY
- ▲ 4.54%
- F500 in state
- 20
Industry mix (Fortune 500 HQ in AZ)
| Industry | F500 HQs | Revenue |
|---|---|---|
| Technology | 2 | $13B |
|
||
| Mining / Metals | 1 | $23B |
|
||
| Environmental Services | 1 | $16B |
|
||
| Metals / Steel | 1 | $14B |
|
||
| Technology Distribution | 1 | $9B |
|
||
| Homebuilding | 1 | $8B |
|
||
Price history
+0.0% since first listed6 events — show timeline
- 2026-04-28 Listed $1,059,000 ARMLS
- 2025-07-01 Rental Removed $4,300 ARMLS
- 2024-06-12 Listed for Rent $4,300 ARMLS
- 2022-10-07 Listing Removed — ARMLS
- 2022-08-09 Price Changed $999,999 ARMLS
- 2022-05-27 Listed $1,059,000 ARMLS
Property tax history
+2.7%/yrLatest (2025): $4,894 · +2.2% YoY. Source: county tax records.
Cash-flow waterfall
monthlySold comps — $/sqft
last 12 mo · ≤1 miLoading sold comps…