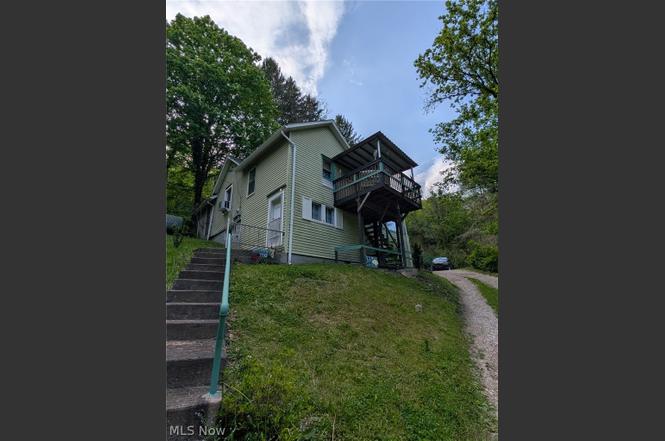
65078 Indian Run Rd · Bellaire, OH
Flood risk 9/10 · Severe
- FEMA flood zone
- X (unshaded)
- Chance of flooding over 30 yrs
- 0.99%
- Est. flood insurance / yr
- $473 – $860
Fire risk 1/10 · Minimal
- Est. fire insurance / yr
- $713 – $1,323
Heat risk 3/10 · Minor
- Hot days now (above 97°F)
- 7 days/yr
- Hot days in 30 yrs
- 18 days/yr
Wind risk 1/10 · Minimal
- Chance of severe wind over 30 yrs
- —
Air-quality risk 1/10 · Minimal
- Unhealthy air days now
- 0 days/yr
- Unhealthy air days in 30 yrs
- 0 days/yr
Risk factors via First Street. Map © Google.
Why this score? — see what drove the B- grade
The composite is a weighted blend of 9 inputs, each scored 0–100. Each bar is that input's sub-score; the figure is the points it added to the 100-point composite (weight × sub-score).
- Cash flow +29.4/30.0
- DSCR +10.0/10.0
- 1% rule +8.2/10.0
- Appreciation +5.9/10.0
- Schools +5.5/10.0
- Livability +3.5/5.0
- Rent growth +2.5/5.0
- Condition / age +2.5/5.0
- ARV discount +0.0/15.0
$65,000
🖨 Deal sheet 📄 Offer letter ✓ Due diligence
Listing remarks
Vacant, Cozy 2 bedroom, 1 bath home in country setting on . 33 acres lot; recently remodeled; updated electric and plumbing and new carpeting throughout; Lots of extra living/storage space in the lower level; one car garage. Enjoy the views from the front deck. Offers the convenience of being close to tow, but affording the privacy you desire. Extra parking area and space for carport. Furniture shown is not included, but some can be negotiated with the sale if desired. Being sold as is. Motivated seller. Cash or conventional loan only. Shared driveway; please do not park in the shared driveway at any time.
Key facts
- Front deck views
- Extra parking area
- Recently remodeled
Tags
Property features AI
Exterior
- Parking: Garage plus additional parking; 1-car garage
- Utilities: Public water; Public sewer
- Home design: One-story home
- Construction: Vinyl siding; Block foundation; Metal and shingle roof; Built according to public records
- Exterior features: Lot about 0.33 acre
Interior
- Kitchen: Range
- Bedrooms: Two main-level bedrooms
- Flooring: Carpet in most rooms; Laminate flooring in the kitchen
- Bathrooms: One full bathroom on the main level; Basement bathroom with shower
- Heating & cooling: Baseboard heating; Wall/window cooling units
- Interior features: Partially finished basement with storage space and walk-out access; Updated/remodeled condition
Neighborhood map
What this means for you Summary
Snapshot
- This is a 2-bed/1.0-bath single-family listed at $65k.
Deal economics
- At list price, monthly cash flow is $175 ($2k/yr) — positive.
- The deal already cash-flows at list — no discount required.
- Meets the 1% rule at list price ($861 rent vs $65k).
- Recommended offer: $57k (12.0% below list) — sets the bar for market timing.
Location & tenants
- Location reads 69/100 on livability (#535 in OH) — a middle-class / working-renter tenant base. Strengths: cost of living A+, housing A+, health & safety A+; Watch: crime C-, amenities F, commute F.
- Bellaire Local (rural): math 73% / reading 56% proficiency, ranked #430 of 802 in OH (top 54%) — acceptable for families but not a draw, mixed tenant base, ~2y average lease.
- Market conditions: 26 active listings in the ZIP; lower-income renter base — watch delinquency; 4 units permitted in Belmont County in 2024 (0 in 5+ unit buildings).
Forward outlook
- In year one you build about $2k of equity ($449 loan paydown + $1k appreciation (1.8% local appreciation)).
- Belmont County population projected at -15% by 2050 — secular population decline; favor cash flow + early exit over multi-decade hold.
- At projected returns (1.8% appreciation + 3.0% rent growth), your $18k cash investment doubles in ~5 years — after that, you're playing with house money.
Negotiation context
- It's been on market 223 days — a 12% lower offer ($57k) is reasonable based on typical stale-listing flexibility.
- 6 sale attempts; this cycle's ask is 16% above the opening price — seller raised mid-cycle; expect resistance to lowballs.
- Current owner paid $12k; list at $65k implies a 442% gain — meaningful room to come down on a strong offer.
Risks & watch-outs
- Watch-outs: flood insurance adds $56/mo; built in 1900 — expect roof / HVAC / electrical / plumbing capex.
- Climate carrying-cost: severe flood risk — expect insurance premiums to compound above CPI over the hold.
Questions for the listing agent
- It's been on market 223 days. Have you received any prior offers? Is the seller open to a 12% concession, seller financing, or rate buy-down credit?
- Built in 1900 — when were the roof, HVAC, electrical panel, plumbing, and water heater last replaced?
- What's the actual annual flood-insurance premium (NFIP or private), and is the property in a SFHA with mandatory coverage?
- Why hasn't it sold? Are there any deal-killer items the seller is aware of (foundation, flood, title, zoning, code violations)?
- Is there a deadline driving the sale (1031 exchange, divorce, estate, relocation)? That informs how much negotiation room exists.
- Schools are B-rated — typically a magnet for longer-tenancy family renters. What's the average tenant stay here, and is there a school-zone premium baked into asking?
- What's the average days-on-market for RENTAL listings here right now (not sales)? A rising rental-DOM trend means longer vacancies and softer asking-rent achievability than the comps imply.
- What's the recent tenant-quality profile in this submarket — average credit score on applications, eviction rate, late-payment / NSF rate, and stable-employment percentage? A property-management company in the area should have these aggregated.
- How much new for-sale + rental construction is in the pipeline within 1–3 miles? Heavy new supply typically softens prices + rents 12–24 months out; constrained supply supports both.
Investment metrics
- 1% rule
- 1.32% ✓
- Cap rate
- 10.55%
- Cash-on-cash
- 15.21%
- DSCR
- 1.68
- GRM
- 6.3
CMA / ARV
- ARV (on-the-fly)
- $54,784
- Comps found
- 2
Show comp detail 2 sales within ~0.75 mi
| Address | Dist | Beds/Ba | Sqft | Sold | Price | $/sf | Match |
|---|---|---|---|---|---|---|---|
| 4515 Harrison St | 0.47mi | 2/1.0 | 886 (+4%) | 0mo | $8,000 | $9 | 72 |
| 3515 Franklin St | 0.64mi | 3/1.0 (+1) | 828 (-3%) | 23mo | $53,000 | $64 | 41 |
Match score weights: distance 35% · size 25% · config 20% · recency 20%. Top-matched comps best support the ARV.
Projected returns pro-forma
1.79% appreciation · 3.0% rent growth · sell at horizon
- IRR
- 15.4%
- Equity multiple
- 1.82×
- Total profit
- $14,967
- Equity at exit
- $24,904
- IRR
- 18.1%
- Equity multiple
- 3.36×
- Total profit
- $43,040
- Equity at exit
- $35,306
Cash invested: $18,200 (down + closing). Projections, not guarantees.
Landlord ↔ Tenant lean methodology
- Overall (STATE)
- 73 Landlord-Friendly
- State Ohio
- 73 Landlord-Friendly · R+6
- County
- — inherits STATE
- City
- — inherits STATE
ZIP-level market 43906
- Home prices YoY
- 1.1%
- Active inventory
- 26
- Price-to-rent
- 6.3×
Monthly cashflow live
- Estimated rent
- $861 medium interval (Pro) →
- Mortgage (P&I)
- −$341
- Tax est. 1.5%
- −$81 /mo · $975/yr
- Insurance
- −$27
- Flood insurance flood zone
- −$56 /mo · $666/yr
- HOA
- −$0
- Vacancy / Maint / Mgmt
- −$181
- Net cashflow
- $175
Break-even live
UW: 25.0% down · 7.5% · 30yr · 1.5% tax · 5.0% vac · 8.0% maint · 8.0% mgmt
Financing live
Cash to close
- Down payment
- $16,250
- Closing costs
- $1,950
- Reserves months
- —
- Total cash needed
- —
Loan-product check · same deal, 3 products live
Conventional
25% down · 7.5% · 30yr
- Down + closing
- —
- Monthly P&I
- —
- Monthly cashflow
- —
- DSCR
- —
- Eligible?
- —
Personal DTI + credit; lowest rate.
DSCR
20% down · 8.5% · 30yr
- Down + closing
- —
- Monthly P&I
- —
- Monthly cashflow
- —
- DSCR
- —
- Eligible?
- —
No personal income docs; deal must DSCR.
Hard money
10% down · 12.0% · 12mo
- Down + closing
- —
- Monthly P&I
- —
- Monthly cashflow
- —
- DSCR
- —
- Eligible?
- —
Short-term bridge; refi at stabilization.
Listing history 34 events
-
2026-06-19days on market $65,000 Active 223 DOM
-
2026-06-18days on market $65,000 Active 222 DOM
-
2026-06-17days on market $65,000 Active 221 DOM
-
2026-06-16days on market $65,000 Active 220 DOM
-
2026-06-15days on market $65,000 Active 219 DOM
-
2026-06-14days on market $65,000 Active 217 DOM
-
2026-06-12days on market $65,000 Active 216 DOM
-
2026-06-09days on market $65,000 Active 213 DOM
-
2026-06-08days on market $65,000 Active 212 DOM
-
2026-06-07days on market $65,000 Active 211 DOM
-
2026-06-02days on market $65,000 Active 206 DOM
-
2026-06-01days on market $65,000 Active 205 DOM
-
2026-06-01remarks 613-char remark
-
2026-06-01status $65,000 Active 204 DOM
-
2026-05-30days on market $65,000 Contingent 204 DOM
-
2026-04-25historical Contingent
-
2026-03-26status Active
-
2026-03-18historical Contingent
-
2026-03-18status Pending
-
2026-03-09status Active
-
2026-03-09price $65,000
-
2025-12-06status Active
-
2025-11-12historical Contingent
-
2025-10-07$56,000 Active
-
2025-09-30historical
-
2025-09-13price $58,900
-
2025-08-02status Active
-
2025-08-02price $65,000
-
2025-07-27historical Contingent
-
2025-07-19price $75,500
-
2025-06-24price $77,500
-
2025-04-18price $77,900
-
2025-03-13$80,000 Active
-
1997-04-11soldstatus $12,000
ⓘ Source: listings_history table (triggers on properties + properties_extension) + one-shot
backfill from property_details.listing_events for pre-trigger history.
Climate risk First Street
- Flood 9/10 Extreme FEMA zone X (unshaded) · 99% chance over 30 yrs
- Wildfire 1/10 Low
- Heat 3/10 Moderate 7 d/yr ≥97°F today · 18 d/yr by 30 yrs out
- Wind 1/10 Low
- Air quality 1/10 Low 0 unhealthy d/yr today · 0 by 30 yrs out
Nearby sold comps map
Loading sold comps map…
Walkable amenities ~0.75 mi
Loading nearby amenities…
Taxation est. · year 1
- Rental income
- $10,327
- − Mortgage interest
- −$3,641
- − Property taxes
- −$975
- − Insurance
- −$992
- − Repairs & maintenance
- −$826
- − Management
- −$826
- − Depreciation
- −$1,891
- Taxable income
- $1,176
- Est. tax owed @ 24.0%
- −$282
- After-tax cash flow
- $1,819/yr
For passive investors: Depreciation is non-cash, so a rental often shows a tax loss while cash-flowing — sheltering income. Rental losses are passive: they offset passive income freely, and up to $25,000/yr can offset ordinary (W-2) income if you actively participate and your MAGI is under $100k (phasing out to $0 by $150k); unused losses carry forward. On sale, claimed depreciation is recaptured at up to 25%, and gains may owe capital-gains tax (a 1031 exchange can defer both). Figures are a year-1 estimate at your 24.0% rate — not tax advice; consult a CPA.
Schools (NCES district)
- District
- Bellaire Local
- NCES district ID
- 3904357
- Math proficiency
- 73% ▲ 5.00%
- Reading proficiency
- 56% ▼ -3.00%
- Median HH income
- $37,307
- Composite
- 55.05/100
- National rank
- #2773
- State rank
- #430 of 802 in OH
Livability — Bellaire
- Score
- 69/100
- State rank
- #535
- US rank
- #9051
Category grades
Schools grade is shown separately in the Schools card above.
Census & demographics
- County
- Belmont · 63,139 people
- Metro
- Wheeling, WV-OH
- Population (ZIP)
- 7,888
- Household income
- $41,635
- Rent vs Own
- Severe rent burden
- 5.6
Population outlook (Belmont County) Hauer SSP2
- Today (2025)
- 66,568 people
- By 2030
- 64,818 · -2.6%
- By 2040
- 60,702 · -8.8%
- By 2050
- 56,427 · -15.2%
- By 2075
- 46,222 · -30.6%
- By 2100
- 34,611 · -48.0%
Race, ethnicity, and origin ACS 2023
- Neighborhood character
- Predominantly White (90%)
- Race & ethnicity
- White 90% Two or more races 5% Black 4%
- Common ancestry
- Romanian 5% Slovak 2% Iranian 2%
- Foreign-born
- 1%
Political lean MEDSL · Belmont
- 2024 margin
- Solid R (+47.3) · D 26.0% · R 73.3%
- 2008→2024 swing
- -50.0pp toward R · 2008: 2.7pp · 2024: -47.3pp
- All cycles
- 2024: R+47.3 2020: R+43.6 2016: R+39.5 2012: R+8.4 2008: D+2.7
Not yet ingested
- Civics
- —
Market trends
- HPI YoY
- ▲ 1.79%
- Current HPI
- 159.8031
- Rent YoY
- —
- Metro
- —
- State GDP YoY
- ▲ 1.98%
- F500 in state
- 48
Industry mix (Fortune 500 HQ in OH)
| Industry | F500 HQs | Revenue |
|---|---|---|
| Insurance | 3 | $145B |
|
||
| Industrial Machinery | 3 | $49B |
|
||
| Financial Services | 3 | $24B |
|
||
| Consumer Goods | 2 | $93B |
|
||
| Aerospace / Defense | 2 | $47B |
|
||
| Utilities | 2 | $33B |
|
||
Price history
+441.7% since first listed19 events — show timeline
- 2026-04-25 Contingent — MLSNOW
- 2026-03-26 Relisted — MLSNOW
- 2026-03-18 Contingent — MLSNOW
- 2026-03-18 Pending — MLSNOW
- 2026-03-09 Relisted — MLSNOW
- 2026-03-09 Price Changed $65,000 MLSNOW
- 2025-12-06 Relisted — MLSNOW
- 2025-11-12 Contingent — MLSNOW
- 2025-10-07 Listed $56,000 MLSNOW
- 2025-09-30 Listing Removed — MLSNOW
- 2025-09-13 Price Changed $58,900 MLSNOW
- 2025-08-02 Relisted — MLSNOW
- 2025-08-02 Price Changed $65,000 MLSNOW
- 2025-07-27 Contingent — MLSNOW
- 2025-07-19 Price Changed $75,500 MLSNOW
- 2025-06-24 Price Changed $77,500 MLSNOW
- 2025-04-18 Price Changed $77,900 MLSNOW
- 2025-03-13 Listed $80,000 MLSNOW
- 1997-04-11 Sold (Public Records) $12,000 Public Records
Property tax history
-11.4%/yrLatest (2025): $100 · -86.7% YoY. Source: county tax records.
Cash-flow waterfall
monthlySold comps — $/sqft
last 12 mo · ≤1 miLoading sold comps…