 🏷️ Likely Rental
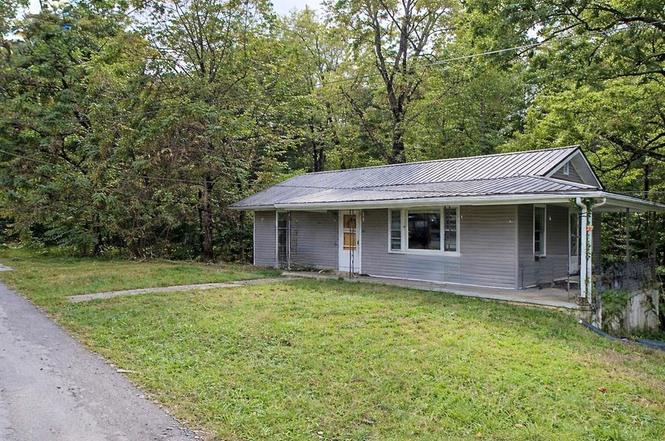
1267 Phillips Dr · Cookeville, TN
Flood risk 1/10 · Minimal
- FEMA flood zone
- X (unshaded)
- Chance of flooding over 30 yrs
- 0.0%
- Est. flood insurance / yr
- $507 – $1,088
Fire risk 3/10 · Minor
- Est. fire insurance / yr
- $949 – $1,763
Heat risk 4/10 · Minor
- Hot days now (above 103°F)
- 7 days/yr
- Hot days in 30 yrs
- 20 days/yr
Wind risk 3/10 · Minor
- Chance of severe wind over 30 yrs
- 5.0%
Air-quality risk 2/10 · Minimal
- Unhealthy air days now
- 0 days/yr
- Unhealthy air days in 30 yrs
- 1 days/yr
Risk factors via First Street. Map © Google.
Why this score? — see what drove the D grade
The composite is a weighted blend of 9 inputs, each scored 0–100. Each bar is that input's sub-score; the figure is the points it added to the 100-point composite (weight × sub-score).
- Cash flow +15.0/30.0
- ARV discount +7.5/15.0
- 1% rule +5.0/10.0
- DSCR +5.0/10.0
- Livability +3.8/5.0
- Schools +2.6/10.0
- Condition / age +2.5/5.0
- Rent growth +2.1/5.0
- Appreciation +0.0/10.0
$1,149
🖨 Deal sheet (PDF) 📄 Offer letter ✓ Due diligence
Listing remarks
Come home to the comforts of this inviting 3-bedroom 1-bath home with cozy interiors, abundant natural light, and an inviting well-equipped peninsula kitchen that flows seamlessly to the dining room. The nice-sized bedrooms invite relaxation and have ample closet space. Effortlessly manage your home through the smart home system and enjoy the comforts of a Central Heat and Air Unit. Pets up to 90 lbs are welcome. Conveniently located in a peaceful neighborhood close to several stores and restaurants. Everything is just within reach. Located just right outside the city center, in a lovely neighborhood surrounded by trees.
Key facts
- Close to restaurants
- Surrounded by trees
- Smart home system
Tags
Property features AI
Exterior
- Parking: Attached garage; Carport
- Utilities: Public water; Septic tank sewer; Electric service with circuit breakers
- Home design: Residential property; One story; Residential rental/property management subtype
- Construction: Frame construction with wood siding
- Exterior features: Composition shingle roof
Interior
- Kitchen: Electric oven; Electric range; Refrigerator
- Flooring: Vinyl flooring
- Bathrooms: 1 full bathroom
- Heating & cooling: Electric heating; Central air; Ceiling fan(s) for cooling
- Interior features: Ceiling fans; Double-pane windows
- Laundry & utility: Electric water heater
Neighborhood map
What this means for you Summary
Snapshot
- This is a 3-bed/1.0-bath single-family listed at $1k.
Deal economics
- At list price, monthly cash flow is $1k ($14k/yr) — positive.
- The deal already cash-flows at list — no discount required.
- Meets the 1% rule at list price ($1k rent vs $1k).
- Cap rate 1188.2% vs local median 3.1% in Cookeville — top-decile yield for the area; either an underpriced asset or a hidden risk that comps aren't pricing in. Stress-test before assuming the spread holds.
Location & tenants
- Location reads 76/100 on livability (#11 in TN, #3,551 nationally) — a middle-class / working-renter tenant base. Strengths: amenities A+, cost of living A+, health & safety A+; Watch: schools D-, commute F, employment F.
- Putnam County (town): math 32% / reading 31% proficiency, ranked #49 of 139 in TN (top 35%) — families likely to look elsewhere, expect single-tenant / working-renter base with shorter leases.
- Market conditions: Rents soft (-1.4%/yr); 285 active listings in the ZIP; 13 comparable units currently listed for rent nearby; rentals lingering (median 46d on market — plan ~5-8 weeks vacancy on turnover, expect pricing pressure); 100% of comp listings sitting > 30 days — soft ceiling on asking rent; 700 units permitted in Putnam County in 2024 (48 in 5+ unit buildings).
- This rent runs 33% of the median local income ($52k/yr) — at the standard rent-burdened threshold; future hikes will face affordability resistance.
Forward outlook
- Local home prices are declining (-3.0%/yr); year-one equity from $8 of loan paydown is wiped out by about $34 of value loss. Plan a longer hold.
- Putnam County population projected at +16% by 2050 — long-run rental-demand tailwind backs the buy-and-hold thesis.
- At projected returns (-3.0% appreciation + 0.0% rent growth), your $322 cash investment doubles in ~1 year — after that, you're playing with house money.
Negotiation context
- Only 1 days on market — expect competitive offers; lowballing is unlikely to land.
- 4 sale attempts since 2y ago with the ask held roughly flat each time — persistent listings suggest the price (not the market) is what's stuck; bring a comps-based counter.
Risks & watch-outs
- Watch-outs: built in 1958 — expect roof / HVAC / electrical / plumbing capex.
Questions for the listing agent
- Built in 1958 — when were the roof, HVAC, electrical panel, plumbing, and water heater last replaced?
- Is there a deadline driving the sale (1031 exchange, divorce, estate, relocation)? That informs how much negotiation room exists.
- Schools are D-rated, which usually means shorter tenancies and higher turnover. Who's the typical renter profile here, and what's been the actual vacancy rate?
- The area grade is low — what's the realistic commute time and amenity access for the typical tenant pool here? Any planned neighborhood developments (good or bad) we should know about?
- What's the average days-on-market for RENTAL listings here right now (not sales)? A rising rental-DOM trend means longer vacancies and softer asking-rent achievability than the comps imply.
- What's the recent tenant-quality profile in this submarket — average credit score on applications, eviction rate, late-payment / NSF rate, and stable-employment percentage? A property-management company in the area should have these aggregated.
- How much new for-sale + rental construction is in the pipeline within 1–3 miles? Heavy new supply typically softens prices + rents 12–24 months out; constrained supply supports both.
Investment metrics
- 1% rule
- 125.55% ✓
- Cap rate
- 1188.25%
- Cash-on-cash
- 4221.27%
- DSCR
- 188.82
- GRM
- 0.1
CMA / ARV
- ARV (on-the-fly)
- $225,720
- Comps found
- 6
Show comp detail 6 sales within ~0.75 mi
| Address | Dist | Beds/Ba | Sqft | Sold | Price | $/sf | Match |
|---|---|---|---|---|---|---|---|
| 460 Dogwood Cir | 0.49mi | 3/1.5 | 1,230 (+8%) | 0mo | $205,300 | $167 | 62 |
| 1655 Dogwood Cir | 0.43mi | 3/2.0 | 1,200 (+5%) | 14mo | $255,000 | $213 | 56 |
| 1104 N Allen Rd | 0.62mi | 2/2.0 (-1) | 1,218 (+7%) | 13mo | $287,000 | $236 | 40 |
| 2478 Dodson Branch Rd | 0.41mi | 2/1.5 (-1) | 982 (-14%) | 15mo | $155,000 | $158 | 38 |
| 3104 Mcdonald Rd | 0.52mi | 3/1.5 | 1,288 (+13%) | 18mo | $254,000 | $197 | 37 |
| 540 Shepherd Hills Rd | 0.64mi | 3/2.0 | 1,225 (+8%) | 24mo | $243,000 | $198 | 34 |
Match score weights: distance 35% · size 25% · config 20% · recency 20%. Top-matched comps best support the ARV.
Projected returns pro-forma
-3.0% appreciation · 0.0% rent growth · sell at horizon
- IRR
- —
- Equity multiple
- 211.39×
- Total profit
- $67,688
- Equity at exit
- $171
- IRR
- —
- Equity multiple
- 422.19×
- Total profit
- $135,506
- Equity at exit
- $99
Cash invested: $322 (down + closing). Projections, not guarantees.
Landlord ↔ Tenant lean methodology
- Overall (STATE)
- 87 Strongly Landlord-Friendly
- State Tennessee
- 87 Strongly Landlord-Friendly · R+13
- County
- — inherits STATE
- City
- — inherits STATE
ZIP-level market 38501
- Home prices YoY
- -24.2%
- Rents YoY
- -1.4%
- Active inventory
- 285
- Price-to-rent
- 0.1×
Monthly cashflow live
- Estimated rent
- $1,443 high interval (Pro) →
- Mortgage (P&I)
- −$6
- Tax est. 1.5%
- −$1 /mo · $17/yr
- Insurance
- −$0
- HOA
- −$0
- Vacancy / Maint / Mgmt
- −$303
- Net cashflow
- $1,132
Break-even live
Sensitivity live
| Price | -10% $1,133 | -5% $1,132 | +0% $1,132 | +5% $1,131 | +10% $1,131 |
|---|---|---|---|---|---|
| Rent | -10% $1,018 | -5% $1,075 | +0% $1,132 | +5% $1,189 | +10% $1,246 |
| Rate | -1.0pp $1,132 | -0.5pp $1,132 | base $1,132 | +0.5pp $1,131 | +1.0pp $1,131 |
UW: 25.0% down · 7.5% · 30yr · 1.5% tax · 5.0% vac · 8.0% maint · 8.0% mgmt
Financing live
Cash to close
- Down payment
- $287
- Closing costs
- $34
- Reserves months
- —
- Total cash needed
- —
Loan-product check · same deal, 3 products live
Conventional
25% down · 7.5% · 30yr
- Down + closing
- —
- Monthly P&I
- —
- Monthly cashflow
- —
- DSCR
- —
- Eligible?
- —
Personal DTI + credit; lowest rate.
DSCR
20% down · 8.5% · 30yr
- Down + closing
- —
- Monthly P&I
- —
- Monthly cashflow
- —
- DSCR
- —
- Eligible?
- —
No personal income docs; deal must DSCR.
Hard money
10% down · 12.0% · 12mo
- Down + closing
- —
- Monthly P&I
- —
- Monthly cashflow
- —
- DSCR
- —
- Eligible?
- —
Short-term bridge; refi at stabilization.
Rent comps 13 comps
| Address | Beds | Baths | Sqft | Rent | $/sqft | DOM | Units | Dist |
|---|---|---|---|---|---|---|---|---|
| 1301 Phillips Dr Cookeville, TN | 2.0 | 1.0 | 900 | $1,395 | $1.55 | 45d | 1 | 0.04mi |
| 3425 Dodson Branch Rd Unit B Cookeville, TN | 3.0 | 2.0 | 1305 | $1,800 | $1.38 | 45d | 1 | 0.71mi |
| 825 Kinniard Rd Unit B Cookeville, TN | 2.0 | 2.0 | 1024 | $1,200 | $1.17 | 45d | 1 | 0.71mi |
| 895 Kinniard Rd Unit B Cookeville, TN | 2.0 | 2.0 | 900 | $1,200 | $1.33 | 45d | 1 | 0.72mi |
| 755 Kinniard Rd Apt A Cookeville, TN | 2.0 | 2.0 | 1145 | $1,200 | $1.05 | 45d | 1 | 0.74mi |
| 845 Kinniard Rd Unit B Cookeville, TN | 2.0 | 2.0 | 1024 | $1,200 | $1.17 | 45d | 1 | 0.75mi |
| 210 Kinniard Rd Cookeville, TN | 2.0 | 2.0 | 1200 | $1,495 | $1.25 | 45d | 1 | 1.01mi |
| 431 Juniper Dr Cookeville, TN | 3.0 | 2.5 | 1424 | $1,650 | $1.16 | 45d | 1 | 1.17mi |
| 1500 N Willow Ave Unit C-4 Cookeville, TN | 2.0 | 2.0 | 1200 | $1,100 | $0.92 | 45d | 1 | 1.25mi |
| 407 Juniper Dr Cookeville, TN | 3.0 | 2.0 | 1424 | $1,650 | $1.16 | 45d | 1 | 1.27mi |
| 402 Peek Dr Unit 2 Cookeville, TN | 2.0 | 1.5 | 992 | $899 | $0.91 | 45d | 1 | 1.30mi |
| 155 E Jere Whitson Rd Unit 1 Cookeville, TN | 2.0 | 1.0 | 1000 | $1,100 | $1.10 | 45d | 1 | 1.35mi |
| 1849 Summerhaven Ave Unit 2 Cookeville, TN | 2.0 | 1.0 | 800 | $950 | $1.19 | 45d | 1 | 1.36mi |
Listing history 2 events
-
2026-06-22remarks 628-char remark
-
2026-06-22$1,149 Active 1 DOM
ⓘ Source: listings_history table (triggers on properties + properties_extension) + one-shot
backfill from property_details.listing_events for pre-trigger history.
Climate risk First Street
- Flood 1/10 Low FEMA zone X (unshaded) · 0% chance over 30 yrs
- Wildfire 3/10 Moderate
- Heat 4/10 Moderate 7 d/yr ≥103°F today · 20 d/yr by 30 yrs out
- Wind 3/10 Moderate 5% chance of damaging wind over 30 yrs
- Air quality 2/10 Low 0 unhealthy d/yr today · 1 by 30 yrs out
Nearby sold comps map
Loading sold comps map…
Walkable amenities ~0.75 mi
Loading nearby amenities…
Taxation est. · year 1
- Rental income
- $17,311
- − Mortgage interest
- −$64
- − Property taxes
- −$17
- − Insurance
- −$6
- − Repairs & maintenance
- −$1,385
- − Management
- −$1,385
- − Depreciation
- −$33
- Taxable income
- $14,421
- Est. tax owed @ 24.0%
- −$3,461
- After-tax cash flow
- $10,120/yr
For passive investors: Depreciation is non-cash, so a rental often shows a tax loss while cash-flowing — sheltering income. Rental losses are passive: they offset passive income freely, and up to $25,000/yr can offset ordinary (W-2) income if you actively participate and your MAGI is under $100k (phasing out to $0 by $150k); unused losses carry forward. On sale, claimed depreciation is recaptured at up to 25%, and gains may owe capital-gains tax (a 1031 exchange can defer both). Figures are a year-1 estimate at your 24.0% rate — not tax advice; consult a CPA.
Schools (NCES district)
- District
- Putnam County
- NCES district ID
- 4703480
- Math proficiency
- 32% ▼ -6.00%
- Reading proficiency
- 31% ▼ -5.00%
- Median HH income
- $35,738
- Composite
- 26.09/100
- National rank
- #7291
- State rank
- #49 of 139 in TN
Livability — Cookeville
- Score
- 76/100
- State rank
- #11
- US rank
- #3551
Category grades
Schools grade is shown separately in the Schools card above.
Census & demographics
- County
- Putnam County · 72,571 people
- City population
- 72,571
- Metro
- Cookeville, TN
- Population (ZIP)
- 42,471
- Household income
- $52,145
- Rent vs Own
- Severe rent burden
- 2410.0
Population outlook (Putnam County) Hauer SSP2
- Today (2025)
- 80,122 people
- By 2030
- 82,798 · +3.3%
- By 2040
- 87,913 · +9.7%
- By 2050
- 92,659 · +15.6%
- By 2075
- 104,965 · +31.0%
- By 2100
- 113,256 · +41.4%
Race, ethnicity, and origin ACS 2023
- Neighborhood character
- Predominantly White (82%)
- Race & ethnicity
- White 82% Hispanic / Latino 9% Two or more races 6% Black 4% Asian 1%
- Hispanic origin (detail)
- Mexican 4%
- Common ancestry
- Serbian 2% Slovak 2% Lithuanian 2%
- Foreign-born
- 6% · Canada
- Languages at home
- 92% English-only · Spanish 5% Other Indo-European 1% French/Haitian/Cajun 1%
Political lean MEDSL · Putnam
- 2024 margin
- Solid R (+47.4) · D 25.7% · R 73.1% · Other 1.1%
- 2008→2024 swing
- -20.5pp toward R · 2008: -26.9pp · 2024: -47.4pp
- All cycles
- 2024: R+47.4 2020: R+43.4 2016: R+45.0 2012: R+37.1 2008: R+26.9
Not yet ingested
- Civics
- —
Market trends
- HPI YoY
- ▼ -91.19%
- Current HPI
- 285.6959
- Rent YoY
- ▼ -1.45%
- Metro
- Cookeville, TN
- State GDP YoY
- ▲ 2.78%
- F500 in state
- 22
Industry mix (Fortune 500 HQ in TN)
| Industry | F500 HQs | Revenue |
|---|---|---|
| Healthcare | 3 | $91B |
|
||
| Retail | 3 | $72B |
|
||
| Transportation / Logistics | 1 | $88B |
|
||
| Paper / Packaging | 1 | $19B |
|
||
| Insurance | 1 | $13B |
|
||
| Energy | 1 | $12B |
|
||
Price history
-94.8% since first listed11 events — show timeline
- 2026-06-21 Listed $1,149 UCMLS
- 2026-06-12 Price Changed $1,149 SHOWMOJO
- 2026-06-03 Price Changed $1,249 SHOWMOJO
- 2026-04-10 Listed for Rent $1,349 SHOWMOJO
- 2025-03-22 Rental Removed $1,249 SHOWMOJO
- 2025-03-12 Listed for Rent $1,249 SHOWMOJO
- 2024-03-26 Rental Removed $975 UCMLS
- 2024-02-16 Price Changed $975 UCMLS
- 2024-01-10 Listed for Rent $999 UCMLS
- 1996-06-03 Sold (Public Records) $33,000 Public Records
- 1989-04-06 Sold (Public Records) $21,992 Public Records
Property tax history
+6.5%/yrLatest (2025): $445 · +0.0% YoY. Source: county tax records.
Cash-flow waterfall
monthlySold comps — $/sqft
last 12 mo · ≤1 miLoading sold comps…