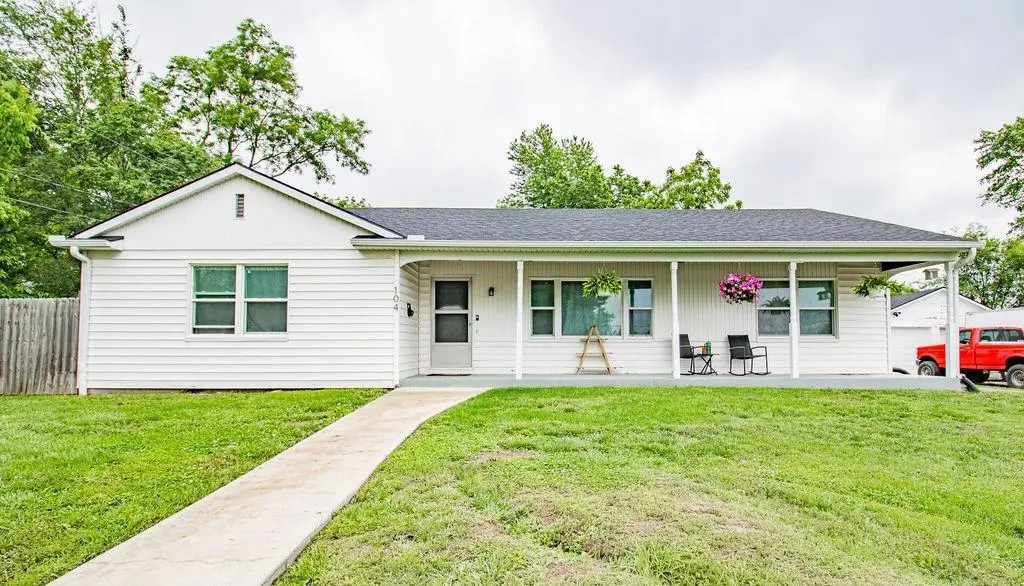
104 S Bagby St · Knob Noster, MO
Flood risk 1/10 · Minimal
- FEMA flood zone
- X (unshaded)
- Chance of flooding over 30 yrs
- 0.0%
- Est. flood insurance / yr
- $507 – $1,088
Fire risk 3/10 · Minor
- Est. fire insurance / yr
- $1,054 – $1,958
Heat risk 4/10 · Minor
- Hot days now (above 107°F)
- 7 days/yr
- Hot days in 30 yrs
- 17 days/yr
Wind risk 2/10 · Minimal
- Chance of severe wind over 30 yrs
- —
Air-quality risk 2/10 · Minimal
- Unhealthy air days now
- 0 days/yr
- Unhealthy air days in 30 yrs
- 1 days/yr
Risk factors via First Street. Map © Google.
Why this score? — see what drove the D- grade
The composite is a weighted blend of 9 inputs, each scored 0–100. Each bar is that input's sub-score; the figure is the points it added to the 100-point composite (weight × sub-score).
- Cash flow +7.6/30.0
- ARV discount +7.5/15.0
- Appreciation +6.8/10.0
- Schools +4.2/10.0
- Livability +3.6/5.0
- Rent growth +2.5/5.0
- Condition / age +2.5/5.0
- DSCR +1.7/10.0
- 1% rule +1.1/10.0
$215,000
🖨 Deal sheet (PDF) 📄 Offer letter ✓ Due diligence
Listing remarks
Welcome to 104 s Bagby in Knob Noster! This Beautiful ranch home sits on a large double lot with a nice detached 2 car garage. This house has TONS of room, and nice modern updates making it feel so fresh! Beautiful hardwood floors, fresh paint, new windows, and private back yard. Very large unfinished basement for lots of storage, All located in a quiet neighborhood conveniently located close to schools and Whiteman Air Force base. Take a look today!
Key facts
- Private back yard
- Large double lot
- Quiet neighborhood
Tags
Property features AI
Finance
- Other: Property listed by Prime Real Estate Investments, LLC
- HOA & community: No association fees
Exterior
- Parking: Detached 2-car garage
- Utilities: Public water; Public sewer
- Home design: Single-family residence; Residential property; Ranch style
- Construction: Board & batten siding; Composition roof; Built approximately 51–75 years ago
- Exterior features: Lot approximately 10,547 square feet
Interior
- Bedrooms: 3 bedrooms on the main level
- Bathrooms: 2 full bathrooms
- Heating & cooling: Natural gas heating; Electric cooling
- Interior features: Ranch floor plan; Unfinished basement with inside entrance
Neighborhood map
What this means for you Summary
Snapshot
- This is a 3-bed/2.0-bath other listed at $215k.
Deal economics
- At list price, monthly cash flow is $-259 ($-3k/yr) — negative.
- To cash-flow at today's rent, offer at most $169k (21.3% below list).
- To meet the 1% rule (rent ≥ 1% of price), the offer needs to be $132k (38.6% below list).
- Recommended offer: $132k (38.6% below list) — sets the bar for 1% rule.
- Cap rate 4.8% vs local median 4.0% in Knob Noster — meaningfully above typical; check what's discounted (condition, days-on-market, listing class) to confirm the premium yield is real.
Location & tenants
- Location reads 71/100 on livability (#104 in MO) — a middle-class / working-renter tenant base. Strengths: crime A+, cost of living A+, housing A+; Watch: health & safety C-, employment D+, amenities F.
- Knob Noster R-VIII (town): math 46% / reading 52% proficiency, ranked #47 of 324 in MO (top 14%) — families likely to look elsewhere, expect single-tenant / working-renter base with shorter leases.
- Zoned schools: Knob Noster Middle (math 54% / reading 52%, grade C+, #51 of 391 statewide, top 13%, 377 students, 33% FRL); Knob Noster High (math 47% / reading 62%, grade C-, #69 of 521 statewide, top 15%, 446 students, 26% FRL) — zoned schools at 30% FRL track the district average.
- Market conditions: 45 active listings in the ZIP; 2 comparable units currently listed for rent nearby; 80 units permitted in Johnson County in 2024 (27 in 5+ unit buildings).
Forward outlook
- In year one you build about $9k of equity ($1k loan paydown + $8k appreciation (3.6% local appreciation)).
- Johnson County population projected at +6% by 2050 — modest demand growth; plan on rents tracking national, not racing it.
- By year 4, paydown + projected appreciation supports a ~$31k cash-out refi (75% LTV) — recoverable capital for the next deal without selling this one.
Negotiation context
- Only 3 days on market — expect competitive offers; lowballing is unlikely to land.
Risks & watch-outs
- Watch-outs: built in 1952 — expect roof / HVAC / electrical / plumbing capex.
Questions for the listing agent
- What do current leases actually rent for vs. the listed asking? Can we see a recent rent roll and the last 12 months of T-12 income?
- Built in 1952 — when were the roof, HVAC, electrical panel, plumbing, and water heater last replaced?
- Is there a deadline driving the sale (1031 exchange, divorce, estate, relocation)? That informs how much negotiation room exists.
- The area grade is low — what's the realistic commute time and amenity access for the typical tenant pool here? Any planned neighborhood developments (good or bad) we should know about?
- What's the average days-on-market for RENTAL listings here right now (not sales)? A rising rental-DOM trend means longer vacancies and softer asking-rent achievability than the comps imply.
- What's the recent tenant-quality profile in this submarket — average credit score on applications, eviction rate, late-payment / NSF rate, and stable-employment percentage? A property-management company in the area should have these aggregated.
- How much new for-sale + rental construction is in the pipeline within 1–3 miles? Heavy new supply typically softens prices + rents 12–24 months out; constrained supply supports both.
Investment metrics
- 1% rule
- 0.61% ✗
- Cap rate
- 4.85%
- Cash-on-cash
- -5.17%
- DSCR
- 0.77
- GRM
- 13.6
CMA / ARV
No comps found within radius.
Projected returns pro-forma
3.63% appreciation · 3.0% rent growth · sell at horizon
- IRR
- 4.6%
- Equity multiple
- 1.28×
- Total profit
- $16,568
- Equity at exit
- $104,411
- IRR
- 7.5%
- Equity multiple
- 2.22×
- Total profit
- $73,259
- Equity at exit
- $167,203
Cash invested: $60,200 (down + closing). Projections, not guarantees.
Landlord ↔ Tenant lean methodology
- Overall (STATE)
- 81 Strongly Landlord-Friendly
- State Missouri
- 81 Strongly Landlord-Friendly · R+10
- County
- — inherits STATE
- City
- — inherits STATE
ZIP-level market 65336
- Home prices YoY
- 1.9%
- Active inventory
- 45
- Price-to-rent
- 13.6×
Monthly cashflow live
- Estimated rent
- $1,319 medium interval (Pro) →
- Mortgage (P&I)
- −$1,127
- Tax from tax record
- −$84 /mo · $1,013/yr
- Insurance
- −$90
- HOA
- −$0
- Vacancy / Maint / Mgmt
- −$277
- Net cashflow
- $-259
Break-even live
Sensitivity live
| Price | -10% $-138 | -5% $-198 | +0% $-259 | +5% $-320 | +10% $-381 |
|---|---|---|---|---|---|
| Rent | -10% $-363 | -5% $-311 | +0% $-259 | +5% $-207 | +10% $-155 |
| Rate | -1.0pp $-151 | -0.5pp $-205 | base $-259 | +0.5pp $-315 | +1.0pp $-372 |
UW: 25.0% down · 7.5% · 30yr · 1.5% tax · 5.0% vac · 8.0% maint · 8.0% mgmt
Financing live
Cash to close
- Down payment
- $53,750
- Closing costs
- $6,450
- Reserves months
- —
- Total cash needed
- —
Loan-product check · same deal, 3 products live
Conventional
25% down · 7.5% · 30yr
- Down + closing
- —
- Monthly P&I
- —
- Monthly cashflow
- —
- DSCR
- —
- Eligible?
- —
Personal DTI + credit; lowest rate.
DSCR
20% down · 8.5% · 30yr
- Down + closing
- —
- Monthly P&I
- —
- Monthly cashflow
- —
- DSCR
- —
- Eligible?
- —
No personal income docs; deal must DSCR.
Hard money
10% down · 12.0% · 12mo
- Down + closing
- —
- Monthly P&I
- —
- Monthly cashflow
- —
- DSCR
- —
- Eligible?
- —
Short-term bridge; refi at stabilization.
Rent comps 2 comps
| Address | Beds | Baths | Sqft | Rent | $/sqft | DOM | Units | Dist |
|---|---|---|---|---|---|---|---|---|
| 705 Elliott Ln Knob Noster, MO | 3.0 | 2.0 | 1197 | $1,325 | $1.11 | 45d | 1 | 1.18mi |
| 709 Elliott Ln Knob Noster, MO | 3.0 | 2.0 | 1275 | $1,245 | $0.98 | 45d | 1 | 1.18mi |
Listing history 6 events
-
2026-05-31status $215,000 Pending 3 DOM
-
2026-05-30days on market $215,000 Active 3 DOM
-
2026-05-27$215,000 Active
-
2022-08-30soldstatus
-
2022-04-05soldstatus
-
2017-06-14soldstatus
ⓘ Source: listings_history table (triggers on properties + properties_extension) + one-shot
backfill from property_details.listing_events for pre-trigger history.
Tax reassessment forecast MO · Resets to sale price
- Current annual tax
- $1,013 · $84/mo
- Projected year-2 tax
- $2,086 · $174/mo
- Expected delta
- +$1,073/yr (+$89/mo · 105.9%)
ⓘ Screening estimate from a state-policy table — verify with the county assessor before closing.
Climate risk First Street
- Flood 1/10 Low FEMA zone X (unshaded) · 0% chance over 30 yrs
- Wildfire 3/10 Moderate
- Heat 4/10 Moderate 7 d/yr ≥107°F today · 17 d/yr by 30 yrs out
- Wind 2/10 Low
- Air quality 2/10 Low 0 unhealthy d/yr today · 1 by 30 yrs out
Nearby sold comps map
Loading sold comps map…
Walkable amenities ~0.75 mi
Loading nearby amenities…
Taxation est. · year 1
- Rental income
- $15,831
- − Mortgage interest
- −$12,043
- − Property taxes
- −$1,013
- − Insurance
- −$1,075
- − Repairs & maintenance
- −$1,266
- − Management
- −$1,266
- − Depreciation
- −$6,255
- Taxable loss
- −$7,088
- Est. tax savings @ 24.0%
- +$1,701
- After-tax cash flow
- $-1,410/yr
For passive investors: Depreciation is non-cash, so a rental often shows a tax loss while cash-flowing — sheltering income. Rental losses are passive: they offset passive income freely, and up to $25,000/yr can offset ordinary (W-2) income if you actively participate and your MAGI is under $100k (phasing out to $0 by $150k); unused losses carry forward. On sale, claimed depreciation is recaptured at up to 25%, and gains may owe capital-gains tax (a 1031 exchange can defer both). Figures are a year-1 estimate at your 24.0% rate — not tax advice; consult a CPA.
Schools (NCES district)
- District
- Knob Noster R-VIII
- NCES district ID
- 2916830
- Math proficiency
- 46% ▼ -3.00%
- Reading proficiency
- 52% ▼ -3.00%
- Median HH income
- $47,077
- Composite
- 41.66/100
- National rank
- #3420
- State rank
- #47 of 324 in MO
Livability — Knob Noster
- Score
- 71/100
- State rank
- #104
- US rank
- #6892
Category grades
Schools grade is shown separately in the Schools card above.
Census & demographics
- Census place
- Knob Noster, MO
- County
- Johnson County · 34,718 people
- City population
- 6,519
- Metro
- Warrensburg, MO
- Population (ZIP)
- 6,519
- Household income
- $66,935
- Rent vs Own
- Severe rent burden
- 66.0
Population outlook (Johnson County) Hauer SSP2
- Today (2025)
- 55,794 people
- By 2030
- 56,861 · +1.9%
- By 2040
- 58,239 · +4.4%
- By 2050
- 59,168 · +6.0%
- By 2075
- 62,222 · +11.5%
- By 2100
- 60,118 · +7.7%
Race, ethnicity, and origin ACS 2023
- Neighborhood character
- Predominantly White (82%)
- Race & ethnicity
- White 82% Two or more races 7% Black 6% Hispanic / Latino 4% Asian 2%
- Common ancestry
- Slovak 3% Lithuanian 2% Serbian 1%
- Foreign-born
- 3% · Canada, Philippines
- Languages at home
- 94% English-only · Spanish 3% Other Asian/Pacific 1% German/W. Germanic 1%
Political lean MEDSL · Johnson
- 2024 margin
- Solid R (+39.6) · D 29.5% · R 69.1% · Other 1.4%
- 2008→2024 swing
- -27.3pp toward R · 2008: -12.2pp · 2024: -39.6pp
- All cycles
- 2024: R+39.6 2020: R+36.8 2016: R+36.9 2012: R+24.2 2008: R+12.2
Not yet ingested
- Civics
- —
Market trends
- HPI YoY
- ▲ 3.63%
- Current HPI
- 195.5154
- Rent YoY
- —
- Metro
- Warrensburg, MO
- State GDP YoY
- ▲ 1.84%
- F500 in state
- 20
Industry mix (Fortune 500 HQ in MO)
| Industry | F500 HQs | Revenue |
|---|---|---|
| Healthcare | 1 | $163B |
|
||
| Insurance | 1 | $21B |
|
||
| Industrial Technology | 1 | $17B |
|
||
| Retail | 1 | $16B |
|
||
| Industrial Distribution | 1 | $10B |
|
||
| Utilities | 1 | $9B |
|
||
Price history
4 events — show timeline
- 2026-05-27 Listed $215,000 Heartland MLS as Distributed by MLS Grid
- 2022-08-30 Sold (Public Records) — Public Records
- 2022-04-05 Sold (Public Records) — Public Records
- 2017-06-14 Sold (Public Records) — Public Records
Property tax history
+1.9%/yrLatest (2025): $1,013 · +12.5% YoY. Source: county tax records.
Cash-flow waterfall
monthlySold comps — $/sqft
last 12 mo · ≤1 miLoading sold comps…