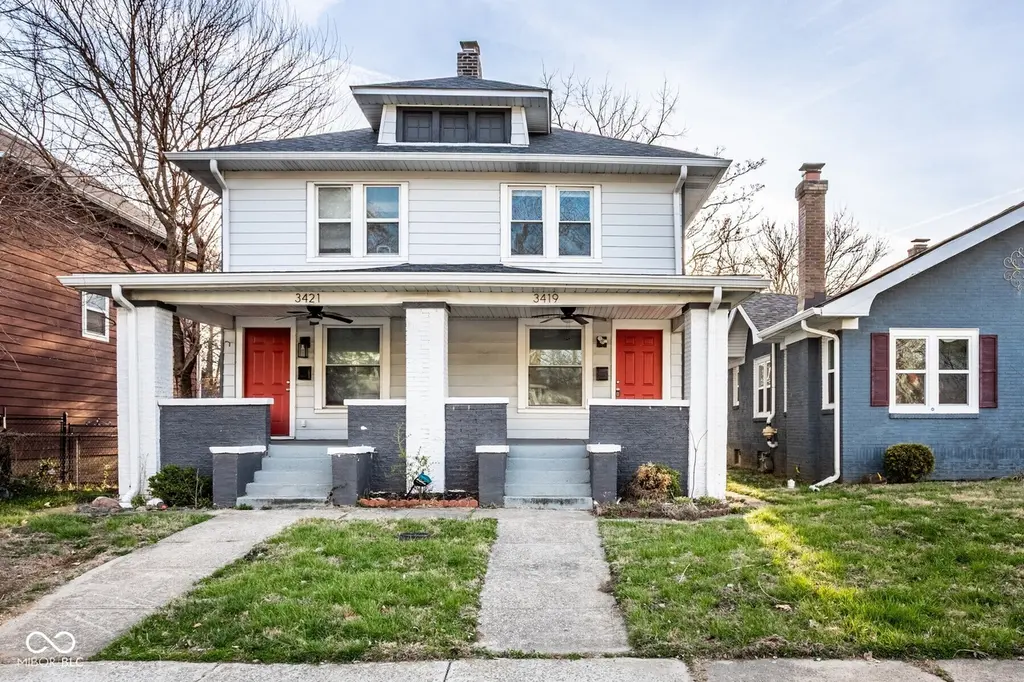
3419 Carrollton Ave · Indianapolis city (balance), IN
Flood risk 6/10 · Moderate
- FEMA flood zone
- X (unshaded)
- Chance of flooding over 30 yrs
- 0.72%
- Est. flood insurance / yr
- $473 – $860
Fire risk 1/10 · Minimal
- Est. fire insurance / yr
- $717 – $1,331
Heat risk 4/10 · Minor
- Hot days now (above 101°F)
- 7 days/yr
- Hot days in 30 yrs
- 19 days/yr
Wind risk 2/10 · Minimal
- Chance of severe wind over 30 yrs
- 0.0%
Air-quality risk 4/10 · Minor
- Unhealthy air days now
- 5 days/yr
- Unhealthy air days in 30 yrs
- 7 days/yr
Risk factors via First Street. Map © Google.
Why this score? — see what drove the D grade
The composite is a weighted blend of 9 inputs, each scored 0–100. Each bar is that input's sub-score; the figure is the points it added to the 100-point composite (weight × sub-score).
- Cash flow +16.2/30.0
- ARV discount +6.5/15.0
- DSCR +5.0/10.0
- Rent growth +4.1/5.0
- 1% rule +3.7/10.0
- Livability +2.5/5.0
- Condition / age +2.5/5.0
- Schools +1.4/10.0
- Appreciation +0.0/10.0
$179,000
🖨 Deal sheet (PDF) 📄 Offer letter ✓ Due diligence
Listing remarks MLS
Step into style with this beautiful 3-bedroom townhome that perfectly balances modern luxury with urban convenience. The open-concept main floor features stunning luxury vinyl plank flooring and a bright, white chef's kitchen complete with stainless steel appliances, a sleek breakfast bar, and a custom tile backsplash. Upstairs, you'll find three spacious bedrooms and updated bathrooms designed with a contemporary flair. Rare for the area, this home boasts a fully fenced rear yard-perfect for pets, gardening, or private weekend BBQs. Located just minutes from the Monon Trail, The Children's Museum, and the Red Line, you are perfectly positioned between the energy of Downtown and the charm of Broad Ripple.
Key facts
- Built 1921
- Listed 41 days
Neighborhood map
What this means for you Summary
Snapshot
- This is a 3-bed/1.0-bath townhouse listed at $179k.
Deal economics
- At list price, monthly cash flow is $96 ($1k/yr) — positive.
- The deal already cash-flows at list — no discount required.
- To meet the 1% rule (rent ≥ 1% of price), the offer needs to be $156k (13.0% below list).
- Recommended offer: $156k (13.0% below list) — sets the bar for 1% rule.
- Cap rate 6.9% vs local median 4.4% in Indianapolis city (balance) — top-decile yield for the area; either an underpriced asset or a hidden risk that comps aren't pricing in. Stress-test before assuming the spread holds.
Location & tenants
- Location reads: area grade D — affects rentability + tenant quality, not the cash-flow math above.
- Indianapolis Public Schools (urban): math 14% / reading 20% proficiency, ranked #286 of 301 in IN (top 95%) — low school quality limits family demand, transient renter base, plan for 1-2y turnover; 77% free/reduced lunch — lower-income household profile, screen leases tightly.
- Market conditions: Rents rising fast (+6.2%/yr); 317 active listings in the ZIP; 40 comparable units currently listed for rent nearby; rentals at typical pace (median 25d on market — plan ~3-4 weeks tenant-placement turnaround); 1,906 units permitted in Marion County in 2024 (621 in 5+ unit buildings).
Forward outlook
- Local home prices are declining (-3.0%/yr); year-one equity from $1k of loan paydown is wiped out by about $5k of value loss. Plan a longer hold.
- Marion County population projected at +18% by 2050 — long-run rental-demand tailwind backs the buy-and-hold thesis.
Negotiation context
- It's been on market 41 days — a 3% lower offer ($174k) is reasonable based on typical stale-listing flexibility.
- 7 sale attempts since 15y ago; this cycle's ask has dropped $10k (5%) from the opening price — seller is motivated, your offer sets the floor, not the list.
Risks & watch-outs
- Watch-outs: built in 1921 — expect roof / HVAC / electrical / plumbing capex.
- Climate carrying-cost: major flood risk — expect insurance premiums to compound above CPI over the hold.
Questions for the listing agent
- It's been on market 41 days. Have you received any prior offers? Is the seller open to a 13% concession, seller financing, or rate buy-down credit?
- Built in 1921 — when were the roof, HVAC, electrical panel, plumbing, and water heater last replaced?
- Is there a deadline driving the sale (1031 exchange, divorce, estate, relocation)? That informs how much negotiation room exists.
- The area grade is low — what's the realistic commute time and amenity access for the typical tenant pool here? Any planned neighborhood developments (good or bad) we should know about?
- What's the average days-on-market for RENTAL listings here right now (not sales)? A rising rental-DOM trend means longer vacancies and softer asking-rent achievability than the comps imply.
- What's the recent tenant-quality profile in this submarket — average credit score on applications, eviction rate, late-payment / NSF rate, and stable-employment percentage? A property-management company in the area should have these aggregated.
- How much new for-sale + rental construction is in the pipeline within 1–3 miles? Heavy new supply typically softens prices + rents 12–24 months out; constrained supply supports both.
Investment metrics
- 1% rule
- 0.87% ✗
- Cap rate
- 6.94%
- Cash-on-cash
- 2.31%
- DSCR
- 1.10
- GRM
- 9.6
CMA / ARV
- ARV (median comp)
- $175,000
- List price
- $179,000
- Delta
- 2.29%
- Verdict
- FAIR
- Comps
- 7 within 1.0 mi
Show comp detail 3 sales within ~0.75 mi
| Address | Dist | Beds/Ba | Sqft | Sold | Price | $/sf | Match |
|---|---|---|---|---|---|---|---|
| 3419 N Pennsylvania St Unit A2 | 0.54mi | 2/1.0 (-1) | 1,229 (-2%) | 9mo | $145,000 | $118 | 58 |
| 3419 N Pennsylvania St Unit E3 | 0.54mi | 2/1.0 (-1) | 1,167 (-7%) | 5mo | $161,500 | $138 | 53 |
| 3419 N Pennsylvania St Unit C6 | 0.54mi | 2/1.0 (-1) | 1,090 (-14%) | 24mo | $142,500 | $131 | 27 |
Match score weights: distance 35% · size 25% · config 20% · recency 20%. Top-matched comps best support the ARV.
Projected returns pro-forma
-3.0% appreciation · 6.21% rent growth · sell at horizon
- IRR
- -9.4%
- Equity multiple
- 0.65×
- Total profit
- $-17,711
- Equity at exit
- $26,689
- IRR
- 3.7%
- Equity multiple
- 1.30×
- Total profit
- $15,092
- Equity at exit
- $15,477
Cash invested: $50,120 (down + closing). Projections, not guarantees.
Landlord ↔ Tenant lean methodology
- Overall (STATE)
- 90 Strongly Landlord-Friendly
- State Indiana
- 90 Strongly Landlord-Friendly · R+11
- County
- — inherits STATE
- City
- — inherits STATE
ZIP-level market 46205
- Rents YoY
- 6.2%
- Active inventory
- 317
- Price-to-rent
- 9.6×
Monthly cashflow live
- Estimated rent
- $1,558 high interval (Pro) →
- Mortgage (P&I)
- −$939
- Tax from tax record
- −$121 /mo · $1,454/yr
- Insurance
- −$75
- HOA
- −$0
- Vacancy / Maint / Mgmt
- −$327
- Net cashflow
- $96
Break-even live
Sensitivity live
| Price | -10% $198 | -5% $147 | +0% $96 | +5% $46 | +10% $-5 |
|---|---|---|---|---|---|
| Rent | -10% $-27 | -5% $35 | +0% $96 | +5% $158 | +10% $220 |
| Rate | -1.0pp $187 | -0.5pp $142 | base $96 | +0.5pp $50 | +1.0pp $3 |
UW: 25.0% down · 7.5% · 30yr · 1.5% tax · 5.0% vac · 8.0% maint · 8.0% mgmt
Financing live
Cash to close
- Down payment
- $44,750
- Closing costs
- $5,370
- Reserves months
- —
- Total cash needed
- —
Loan-product check · same deal, 3 products live
Conventional
25% down · 7.5% · 30yr
- Down + closing
- —
- Monthly P&I
- —
- Monthly cashflow
- —
- DSCR
- —
- Eligible?
- —
Personal DTI + credit; lowest rate.
DSCR
20% down · 8.5% · 30yr
- Down + closing
- —
- Monthly P&I
- —
- Monthly cashflow
- —
- DSCR
- —
- Eligible?
- —
No personal income docs; deal must DSCR.
Hard money
10% down · 12.0% · 12mo
- Down + closing
- —
- Monthly P&I
- —
- Monthly cashflow
- —
- DSCR
- —
- Eligible?
- —
Short-term bridge; refi at stabilization.
Rent comps 40 comps
| Address | Beds | Baths | Sqft | Rent | $/sqft | DOM | Units | Dist |
|---|---|---|---|---|---|---|---|---|
| 728 E 34th St Indianapolis, IN | 3.0 | 1.0 | 1491 | $1,400 | $0.94 | 21d | 1 | 0.05mi |
| 728 E 34th St Indianapolis, IN | 3.0 | 1.0 | 1491 | $1,400 | $0.94 | 5d | 1 | 0.05mi |
| 3359 N College Ave Indianapolis, IN | 2.0 | 1.5 | 1450 | $1,795 | $1.24 | 11d | 1 | 0.10mi |
| 3359 N College Ave Unit 3359 Indianapolis, IN | 2.0 | 1.5 | 1082 | $1,895 | $1.75 | 24d | 1 | 0.10mi |
| 3370 N College Ave Indianapolis, IN | 3.0 | 1.0 | 1680 | $1,275 | $0.76 | 3d | 1 | 0.12mi |
| 3509 Guilford Ave Indianapolis, IN | 3.0 | 1.5 | 1351 | $1,445 | $1.07 | 15d | 1 | 0.14mi |
| 3365 Broadway St Indianapolis, IN | 3.0 | 2.0 | 1300 | $1,700 | $1.31 | 44d | 1 | 0.16mi |
| 3476 Birchwood Ave Indianapolis, IN | 3.0 | 1.5 | 1420 | $1,625 | $1.14 | 24d | 1 | 0.22mi |
| 916 Fairfield Ave Unit 918 Indianapolis, IN | 3.0 | 1.0 | 1000 | $1,300 | $1.30 | 8d | 1 | 0.22mi |
| 3541 Birchwood Ave Indianapolis, IN | 3.0 | 1.0 | 1400 | $1,549 | $1.11 | 13d | 1 | 0.30mi |
| 3203 Sutherland Ave Unit 1310761P Indianapolis, IN | 2.0 | 1.0 | 1097 | $3,668 | $3.34 | 3d | 1 | 0.34mi |
| 3208 Guilford Ave Indianapolis, IN | 3.0 | 3.0 | 1800 | $1,700 | $0.94 | 13d | 1 | 0.35mi |
| 514 E 33rd St Indianapolis, IN | 3.0 | 1.0 | 1208 | $1,200 | $0.99 | 24d | 1 | 0.36mi |
| 512 E 33rd St Indianapolis, IN | 3.0 | 1.0 | 1208 | $1,200 | $0.99 | 24d | 1 | 0.36mi |
| 3141 N Park Ave Indianapolis, IN | 3.0 | 1.0 | 1390 | $1,000 | $0.72 | 44d | 1 | 0.39mi |
| 3139 Guilford Ave Indianapolis, IN | 3.0 | 1.0 | 1068 | $1,345 | $1.26 | 44d | 1 | 0.39mi |
| 3106 N College Ave Indianapolis, IN | 3.0 | 1.5 | 1400 | $1,700 | $1.21 | 8d | 1 | 0.40mi |
| 3110 Guilford Ave Indianapolis, IN | 3.0 | 1.5 | 1250 | $1,295 | $1.04 | 24d | 1 | 0.43mi |
| 3558 Central Ave Indianapolis, IN | 3.0 | 1.0 | 1215 | $2,100 | $1.73 | 24d | 1 | 0.43mi |
| 3716 N College Ave Unit 3 Indianapolis, IN | 2.0 | 2.0 | 1100 | $1,450 | $1.32 | 44d | 1 | 0.43mi |
| 3132 Dr Andrew J Brown Ave Indianapolis, IN | 2.0 | 1.0–2.0 | 791 | $2,120 | $2.68 | 2d | 46 | 0.49mi |
| 3558 Washington Blvd Indianapolis, IN | 3.0 | 1.0 | 975 | $1,199 | $1.23 | 8d | 1 | 0.55mi |
| 2950 Winthrop Ave Indianapolis, IN | 3.0 | 2.0 | 1224 | $1,449 | $1.18 | 44d | 1 | 0.56mi |
| 3207 N Arsenal Ave Indianapolis, IN | 3.0 | 1.0 | 994 | $1,195 | $1.20 | 24d | 1 | 0.58mi |
| 2960 N Park Ave Indianapolis, IN | 3.0 | 2.0 | 1400 | $1,595 | $1.14 | 44d | 1 | 0.59mi |
| 2960 N Park Ave Indianapolis, IN | 3.0 | 1.5 | 1400 | $1,550 | $1.11 | 24d | 1 | 0.59mi |
| 2958 N Park Ave Unit 2958 Indianapolis, IN | 3.0 | 1.5 | 1350 | $1,450 | $1.07 | 4d | 1 | 0.59mi |
| 3851 Broadway St Indianapolis, IN | 3.0 | 1.0 | 1513 | $1,950 | $1.29 | 18d | 1 | 0.60mi |
| 321 E 31st St Indianapolis, IN | 3.0 | 1.0 | 1390 | $1,400 | $1.01 | 44d | 1 | 0.61mi |
| 2950 Ruckle St Indianapolis, IN | 3.0 | 1.0 | 1450 | $1,300 | $0.90 | 44d | 1 | 0.63mi |
| 3909 Winthrop Ave Unit B Indianapolis, IN | 2.0 | 1.5 | 931 | $1,550 | $1.66 | 13d | 1 | 0.64mi |
| 3815 Washington Blvd Indianapolis, IN | 2.0 | 1.0 | 1000 | $1,250 | $1.25 | 8d | 1 | 0.68mi |
| 2920 Ruckle St Indianapolis, IN | 3.0 | 1.5 | 1272 | $1,700 | $1.34 | 8d | 1 | 0.69mi |
| 2830 N Park Ave Indianapolis, IN | 2.0 | 3.0 | 1500 | $1,600 | $1.07 | 44d | 1 | 0.73mi |
| 1902 E 35th St Indianapolis, IN | 3.0 | 1.0 | 1100 | $1,600 | $1.45 | 44d | 1 | 0.73mi |
| 3541 N Meridian St Indianapolis, IN | 1.0–2.0 | 1.0 | 987 | $880 | $0.89 | 44d | 1 | 0.73mi |
| 2751 Guilford Ave Unit B Indianapolis, IN | 3.0 | 2.0 | 1250 | $1,750 | $1.40 | 15d | 1 | 0.76mi |
| 2751 Guilford Ave Unit Aunit Indianapolis, IN | 3.0 | 2.0 | 1250 | $1,750 | $1.40 | 44d | 1 | 0.76mi |
| 3004 N Delaware St Indianapolis, IN | 3.0 | 1.5 | 1600 | $1,599 | $1.00 | 8d | 1 | 0.76mi |
| 3707 N Meridian St Indianapolis, IN | 2.0 | 1.0–2.0 | 1042 | $1,199 | $1.15 | 44d | 1 | 0.78mi |
Listing history 22 events
-
2026-05-06status Pending 717-char remark
Show marketing remark (717 chars)
Step into style with this beautiful 3-bedroom townhome that perfectly balances modern luxury with urban convenience. The open-concept main floor features stunning luxury vinyl plank flooring and a bright, white chef's kitchen complete with stainless steel appliances, a sleek breakfast bar, and a custom tile backsplash. Upstairs, you'll find three spacious bedrooms and updated bathrooms designed with a contemporary flair. Rare for the area, this home boasts a fully fenced rear yard-perfect for pets, gardening, or private weekend BBQs. Located just minutes from the Monon Trail, The Children's Museum, and the Red Line, you are perfectly positioned between the energy of Downtown and the charm of Broad Ripple.
-
2026-04-27price $179,000 717-char remark
Show marketing remark (717 chars)
Step into style with this beautiful 3-bedroom townhome that perfectly balances modern luxury with urban convenience. The open-concept main floor features stunning luxury vinyl plank flooring and a bright, white chef's kitchen complete with stainless steel appliances, a sleek breakfast bar, and a custom tile backsplash. Upstairs, you'll find three spacious bedrooms and updated bathrooms designed with a contemporary flair. Rare for the area, this home boasts a fully fenced rear yard-perfect for pets, gardening, or private weekend BBQs. Located just minutes from the Monon Trail, The Children's Museum, and the Red Line, you are perfectly positioned between the energy of Downtown and the charm of Broad Ripple.
-
2026-03-26$189,000 Active 717-char remark
Show marketing remark (717 chars)
Step into style with this beautiful 3-bedroom townhome that perfectly balances modern luxury with urban convenience. The open-concept main floor features stunning luxury vinyl plank flooring and a bright, white chef's kitchen complete with stainless steel appliances, a sleek breakfast bar, and a custom tile backsplash. Upstairs, you'll find three spacious bedrooms and updated bathrooms designed with a contemporary flair. Rare for the area, this home boasts a fully fenced rear yard-perfect for pets, gardening, or private weekend BBQs. Located just minutes from the Monon Trail, The Children's Museum, and the Red Line, you are perfectly positioned between the energy of Downtown and the charm of Broad Ripple.
-
2026-01-13historical
-
2025-10-31$189,000 Active
-
2025-08-28historical
-
2025-05-30price $195,000
-
2025-02-24$205,000 Active
-
2024-10-02historical $1,595
-
2024-09-21price $1,595
-
2024-08-14$1,695
-
2024-08-13historical
-
2024-07-15price $199,000
-
2024-06-12$210,000 Active
-
2022-02-11soldstatus $185,000 Closed
-
2022-01-04status Pending
-
2021-11-30price $199,900
-
2021-11-15price $209,900
-
2021-11-02$224,900 Active
-
2012-03-22historical
-
2012-03-16soldstatus $16,000
-
2011-12-05$17,000
ⓘ Source: listings_history table (triggers on properties + properties_extension) + one-shot
backfill from property_details.listing_events for pre-trigger history.
Tax reassessment forecast IN · Partial reset (capped growth)
- Current annual tax
- $1,454 · $121/mo
- Projected year-2 tax
- $1,488 · $124/mo
- Expected delta
- +$34/yr (+$3/mo · 2.3%)
ⓘ Screening estimate from a state-policy table — verify with the county assessor before closing.
Climate risk First Street
- Flood 6/10 Major FEMA zone X (unshaded) · 72% chance over 30 yrs
- Wildfire 1/10 Low
- Heat 4/10 Moderate 7 d/yr ≥101°F today · 19 d/yr by 30 yrs out
- Wind 2/10 Low 0% chance of damaging wind over 30 yrs
- Air quality 4/10 Moderate 5 unhealthy d/yr today · 7 by 30 yrs out
Nearby sold comps map
Loading sold comps map…
Walkable amenities ~0.75 mi
Loading nearby amenities…
Taxation est. · year 1
- Rental income
- $18,697
- − Mortgage interest
- −$10,027
- − Property taxes
- −$1,454
- − Insurance
- −$895
- − Repairs & maintenance
- −$1,496
- − Management
- −$1,496
- − Depreciation
- −$5,207
- Taxable loss
- −$1,878
- Est. tax savings @ 24.0%
- +$451
- After-tax cash flow
- $1,608/yr
For passive investors: Depreciation is non-cash, so a rental often shows a tax loss while cash-flowing — sheltering income. Rental losses are passive: they offset passive income freely, and up to $25,000/yr can offset ordinary (W-2) income if you actively participate and your MAGI is under $100k (phasing out to $0 by $150k); unused losses carry forward. On sale, claimed depreciation is recaptured at up to 25%, and gains may owe capital-gains tax (a 1031 exchange can defer both). Figures are a year-1 estimate at your 24.0% rate — not tax advice; consult a CPA.
Schools (NCES district)
- District
- Indianapolis Public Schools
- NCES district ID
- 1804770
- Math proficiency
- 14% ▼ -7.00%
- Reading proficiency
- 20% ▼ -3.00%
- Median HH income
- $32,034
- Composite
- 13.69/100
- National rank
- #9499
- State rank
- #286 of 301 in IN
Livability — Indianapolis city (balance)
No livability data for this city. (Only ~50 U.S. cities are tracked.)
Census & demographics
- Census place
- Indianapolis city (balance), IN
- County
- Marion County · 998,460 people
- City population
- 881,119
- Metro
- Indianapolis-Carmel-Anderson, IN
- Population (ZIP)
- 28,259
- Household income
- $72,417
- Rent vs Own
- Severe rent burden
- 1149.0
Population outlook (Marion County) Hauer SSP2
- Today (2025)
- 1,025,572 people
- By 2030
- 1,065,727 · +3.9%
- By 2040
- 1,141,577 · +11.3%
- By 2050
- 1,208,920 · +17.9%
- By 2075
- 1,367,288 · +33.3%
- By 2100
- 1,438,201 · +40.2%
Race, ethnicity, and origin ACS 2023
- Neighborhood character
- Diverse neighborhood (Simpson 0.64)
- Race & ethnicity
- White 50% Black 32% Two or more races 10% Hispanic / Latino 7% Asian 3%
- Hispanic origin (detail)
- Mexican 4%
- Common ancestry
- Italian 3% Slovak 2% Romanian 2%
- Foreign-born
- 5% · Canada
- Languages at home
- 89% English-only · Spanish 6% Other Indo-European 2% German/W. Germanic 1%
Political lean MEDSL · Marion
- 2024 margin
- Strong D (+27.7) · D 63.0% · R 35.3% · Other 1.7%
- 2008→2024 swing
- -0.7pp no change · 2008: 28.4pp · 2024: 27.7pp
- All cycles
- 2024: D+27.7 2020: D+29.1 2016: D+22.8 2012: D+22.2 2008: D+28.4
Not yet ingested
- Civics
- —
Market trends
- HPI YoY
- ▼ -322.77%
- Current HPI
- 380.5407
- Rent YoY
- ▲ 6.21%
- Metro
- Indianapolis-Carmel-Anderson, IN
- State GDP YoY
- ▲ 2.90%
- F500 in state
- 18
Industry mix (Fortune 500 HQ in IN)
| Industry | F500 HQs | Revenue |
|---|---|---|
| Industrial Machinery | 2 | $37B |
|
||
| Healthcare | 1 | $177B |
|
||
| Pharmaceuticals | 1 | $45B |
|
||
| Metals / Steel | 1 | $18B |
|
||
| Agriculture | 1 | $17B |
|
||
| Packaging | 1 | $12B |
|
||
Price history
+952.9% since first listed22 events — show timeline
- 2026-05-06 Pending — MIBOR as Distributed by MLS Grid
- 2026-04-27 Price Changed $179,000 MIBOR as Distributed by MLS Grid
- 2026-03-26 Listed $189,000 MIBOR as Distributed by MLS Grid
- 2026-01-13 Listing Removed — MIBOR as Distributed by MLS Grid
- 2025-10-31 Listed $189,000 MIBOR as Distributed by MLS Grid
- 2025-08-28 Listing Removed — MIBOR as Distributed by MLS Grid
- 2025-05-30 Price Changed $195,000 MIBOR as Distributed by MLS Grid
- 2025-02-24 Listed $205,000 MIBOR as Distributed by MLS Grid
- 2024-10-02 Rental Removed $1,595 MIBOR
- 2024-09-21 Price Changed $1,595 MIBOR
- 2024-08-14 Listed for Rent $1,695 MIBOR
- 2024-08-13 Listing Removed — MIBOR as Distributed by MLS Grid
- 2024-07-15 Price Changed $199,000 MIBOR as Distributed by MLS Grid
- 2024-06-12 Listed $210,000 MIBOR as Distributed by MLS Grid
- 2022-02-11 Sold (MLS) $185,000 MIBOR as Distributed by MLS Grid
- 2022-01-04 Pending — MIBOR as Distributed by MLS Grid
- 2021-11-30 Price Changed $199,900 MIBOR as Distributed by MLS Grid
- 2021-11-15 Price Changed $209,900 MIBOR as Distributed by MLS Grid
- 2021-11-02 Listed $224,900 MIBOR as Distributed by MLS Grid
- 2012-03-22 Listing Removed — MIBOR as Distributed by MLS Grid
- 2012-03-16 Sold (MLS) $16,000 MIBOR as Distributed by MLS Grid
- 2011-12-05 Listed $17,000 MIBOR as Distributed by MLS Grid
Property tax history
-3.7%/yrLatest (2021): $1,454 · +4.8% YoY. Source: county tax records.
Cash-flow waterfall
monthlySold comps — $/sqft
last 12 mo · ≤1 miLoading sold comps…