Lot 10 Willow Creek Homesites Way · Chester, CA
Flood risk No data
- FEMA flood zone
- —
- Chance of flooding over 30 yrs
- —
- Est. flood insurance / yr
- —
Fire risk No data
- Est. fire insurance / yr
- —
Heat risk No data
- Hot days now (above threshold)
- —
- Hot days in 30 yrs
- —
Wind risk No data
- Chance of severe wind over 30 yrs
- —
Air-quality risk No data
- Unhealthy air days now
- —
- Unhealthy air days in 30 yrs
- —
Risk factors via First Street. Map © Google.
Why this score? — see what drove the C+ grade
The composite is a weighted blend of 9 inputs, each scored 0–100. Each bar is that input's sub-score; the figure is the points it added to the 100-point composite (weight × sub-score).
- Cash flow +21.3/30.0
- Appreciation +10.0/10.0
- ARV discount +7.5/15.0
- DSCR +6.8/10.0
- 1% rule +5.6/10.0
- Livability +3.0/5.0
- Schools +2.8/10.0
- Rent growth +2.5/5.0
- Condition / age +2.2/5.0
$92,000
🖨 Deal sheet (PDF) 📄 Offer letter ✓ Due diligence
Listing remarks
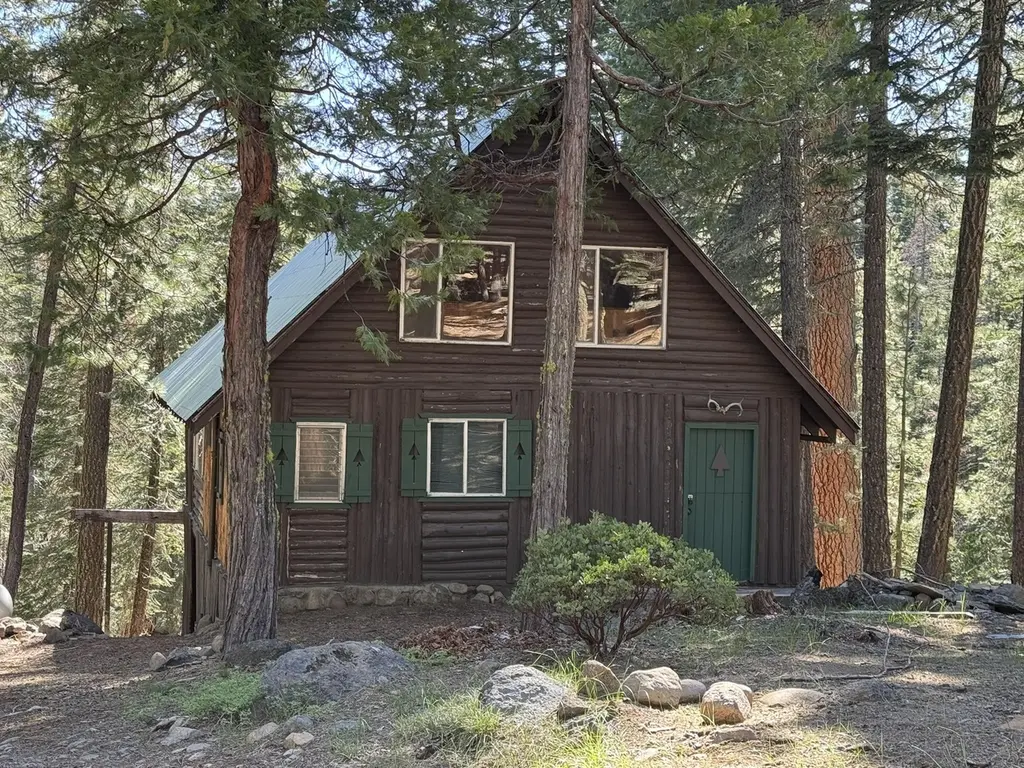
Look for the charming tree cutouts on the green shutters—a delightful touch that hints at the character and rustic appeal found throughout this unique mountain retreat. Nestled along Willow Creek in the secluded, off-the-grid Willow Creek Homesites, this seasonal cabin offers a peaceful escape surrounded by the beauty of the Plumas National Forest. Located approximately 8–9 miles from Chester, the property enjoys a picturesque forest setting where the soothing sounds of Willow Creek create the perfect backdrop for relaxation and outdoor enjoyment. The cabin features a spacious open-beam/rafters great room and creekside views, allowing nature to become part of the living experien
Key facts
- Mountain retreat
- Creekside views
- Loft
Tags
Property features AI
Finance
- Other: Located in Willow Creek Summer Home subdivision
- HOA & community: Association amenities (unspecified)
Exterior
- Parking: Other/unpaved parking
- Utilities: Electricity connected; Propane; Phone connected; Cable not available; Phone service not available in some areas; Other utility services
- Home design: Single-family residence; Two-story
- Construction: Log, stone, and wood siding construction; Metal roof; Slab and stone foundation; Built on 0.39 acres
- Exterior features: Deck; Wooded lot; Steep, sloped terrain; Waterfront frontage (river); Has views
Interior
- Kitchen: Gas oven; Gas range
- Flooring: Hardwood; Other flooring
- Bathrooms: 1 full bathroom
- Heating & cooling: Has heating; Other heating type; No cooling
- Interior features: High ceilings; Vaulted ceilings; Beamed ceilings; Masonry fireplace; Basement (has)
Neighborhood map
What this means for you Summary
Snapshot
- This is a 1-bed/1.0-bath single-family listed at $92k. Condition is rated fair.
Deal economics
- At list price, monthly cash flow is $135 ($2k/yr) — positive.
- The deal already cash-flows at list — no discount required.
- Meets the 1% rule at list price ($975 rent vs $92k).
- Recommended offer: $91k (1.5% below list) — sets the bar for market timing.
Location & tenants
- Location reads 60/100 on livability (#581 in CA) — a middle-class / working-renter tenant base. Strengths: housing A+, crime B+; Watch: cost of living D+, amenities F, commute F.
- Plumas Unified (rural): math 21% / reading 44% proficiency, ranked #306 of 517 in CA (top 59%) — families likely to look elsewhere, expect single-tenant / working-renter base with shorter leases.
- Zoned schools: C. Roy Carmichael Elementary (346 students, 72% FRL); Quincy Junior/Senior High (math 22% / reading 47%, grade F, #618 of 1,170 statewide, top 56%, 340 students, 48% FRL) — zoned schools average 60% FRL vs 41% district-wide (20 pts higher); higher-poverty schools than district average — tighter screening recommended.
- Market conditions: 73 active listings in the ZIP; 39 units permitted in Plumas County in 2024 (0 in 5+ unit buildings).
Forward outlook
- In year one you build about $10k of equity ($636 loan paydown + $9k appreciation (10.0% local appreciation)).
- Plumas County population projected at -42% by 2050 — secular population decline; favor cash flow + early exit over multi-decade hold.
- At projected returns (10.0% appreciation + 3.0% rent growth), your $26k cash investment doubles in ~3 years — after that, you're playing with house money.
- By year 4, paydown + projected appreciation supports a ~$35k cash-out refi (75% LTV) — recoverable capital for the next deal without selling this one.
Negotiation context
- It's been on market 16 days — a 2% lower offer ($91k) is reasonable based on typical stale-listing flexibility.
Risks & watch-outs
- Watch-outs: built in 1930 — expect roof / HVAC / electrical / plumbing capex.
Questions for the listing agent
- Have any recent inspections been done? Can we get a copy of the seller's disclosures and any deferred-maintenance estimates?
- Built in 1930 — when were the roof, HVAC, electrical panel, plumbing, and water heater last replaced?
- Is there a deadline driving the sale (1031 exchange, divorce, estate, relocation)? That informs how much negotiation room exists.
- What's the average days-on-market for RENTAL listings here right now (not sales)? A rising rental-DOM trend means longer vacancies and softer asking-rent achievability than the comps imply.
- What's the recent tenant-quality profile in this submarket — average credit score on applications, eviction rate, late-payment / NSF rate, and stable-employment percentage? A property-management company in the area should have these aggregated.
- How much new for-sale + rental construction is in the pipeline within 1–3 miles? Heavy new supply typically softens prices + rents 12–24 months out; constrained supply supports both.
Investment metrics
- 1% rule
- 1.06% ✓
- Cap rate
- 8.05%
- Cash-on-cash
- 6.27%
- DSCR
- 1.28
- GRM
- 7.9
CMA / ARV
- ARV (on-the-fly)
- $226,083
- Comps found
- 2
Show comp detail 2 sales within ~0.75 mi
| Address | Dist | Beds/Ba | Sqft | Sold | Price | $/sf | Match |
|---|---|---|---|---|---|---|---|
| 251 Myrtle St | 0.19mi | 2/1.0 (+1) | 1,080 (+6%) | 8mo | $225,000 | $208 | 71 |
| 336 First Avenue Ave | 0.23mi | 2/1.0 (+1) | 972 (-5%) | 10mo | $215,000 | $221 | 67 |
Match score weights: distance 35% · size 25% · config 20% · recency 20%. Top-matched comps best support the ARV.
Projected returns pro-forma
10.0% appreciation · 3.0% rent growth · sell at horizon
- IRR
- 28.8%
- Equity multiple
- 3.28×
- Total profit
- $58,693
- Equity at exit
- $82,881
- IRR
- 25.1%
- Equity multiple
- 7.45×
- Total profit
- $166,129
- Equity at exit
- $178,736
Cash invested: $25,760 (down + closing). Projections, not guarantees.
Landlord ↔ Tenant lean methodology
- Overall (STATE)
- 18 Strongly Tenant-Friendly
- State California
- 18 Strongly Tenant-Friendly · D+13
- County
- — inherits STATE
- City
- — inherits STATE
ZIP-level market 96020
- Home prices YoY
- 12.8%
- Active inventory
- 73
- Price-to-rent
- 7.9×
Monthly cashflow live
- Estimated rent
- $975 medium interval (Pro) →
- Mortgage (P&I)
- −$482
- Tax est. 1.5%
- −$115 /mo · $1,380/yr
- Insurance
- −$38
- HOA
- −$0
- Vacancy / Maint / Mgmt
- −$205
- Net cashflow
- $135
Break-even live
Sensitivity live
| Price | -10% $198 | -5% $166 | +0% $135 | +5% $103 | +10% $71 |
|---|---|---|---|---|---|
| Rent | -10% $58 | -5% $96 | +0% $135 | +5% $173 | +10% $212 |
| Rate | -1.0pp $181 | -0.5pp $158 | base $135 | +0.5pp $111 | +1.0pp $87 |
UW: 25.0% down · 7.5% · 30yr · 1.5% tax · 5.0% vac · 8.0% maint · 8.0% mgmt
Financing live
Cash to close
- Down payment
- $23,000
- Closing costs
- $2,760
- Reserves months
- —
- Total cash needed
- —
Loan-product check · same deal, 3 products live
Conventional
25% down · 7.5% · 30yr
- Down + closing
- —
- Monthly P&I
- —
- Monthly cashflow
- —
- DSCR
- —
- Eligible?
- —
Personal DTI + credit; lowest rate.
DSCR
20% down · 8.5% · 30yr
- Down + closing
- —
- Monthly P&I
- —
- Monthly cashflow
- —
- DSCR
- —
- Eligible?
- —
No personal income docs; deal must DSCR.
Hard money
10% down · 12.0% · 12mo
- Down + closing
- —
- Monthly P&I
- —
- Monthly cashflow
- —
- DSCR
- —
- Eligible?
- —
Short-term bridge; refi at stabilization.
Listing history 13 events
-
2026-06-22days on market $92,000 Active 16 DOM
-
2026-06-19days on market $92,000 Active 14 DOM
-
2026-06-18days on market $92,000 Active 13 DOM
-
2026-06-17days on market $92,000 Active 12 DOM
-
2026-06-16days on market $92,000 Active 11 DOM
-
2026-06-15days on market $92,000 Active 10 DOM
-
2026-06-14days on market $92,000 Active 8 DOM
-
2026-06-13days on market $92,000 Active 7 DOM
-
2026-06-10days on market $92,000 Active 5 DOM
-
2026-06-09days on market $92,000 Active 4 DOM
-
2026-06-08days on market $92,000 Active 3 DOM
-
2026-06-07remarks 687-char remark
-
2026-06-07$92,000 Active 2 DOM
ⓘ Source: listings_history table (triggers on properties + properties_extension) + one-shot
backfill from property_details.listing_events for pre-trigger history.
Nearby sold comps map
Loading sold comps map…
Walkable amenities ~0.75 mi
Loading nearby amenities…
Taxation est. · year 1
- Rental income
- $11,702
- − Mortgage interest
- −$5,153
- − Property taxes
- −$1,380
- − Insurance
- −$460
- − Repairs & maintenance
- −$936
- − Management
- −$936
- − Depreciation
- −$2,676
- Taxable income
- $160
- Est. tax owed @ 24.0%
- −$38
- After-tax cash flow
- $1,577/yr
For passive investors: Depreciation is non-cash, so a rental often shows a tax loss while cash-flowing — sheltering income. Rental losses are passive: they offset passive income freely, and up to $25,000/yr can offset ordinary (W-2) income if you actively participate and your MAGI is under $100k (phasing out to $0 by $150k); unused losses carry forward. On sale, claimed depreciation is recaptured at up to 25%, and gains may owe capital-gains tax (a 1031 exchange can defer both). Figures are a year-1 estimate at your 24.0% rate — not tax advice; consult a CPA.
Condition & rehab AI · 13 photos
This cabin requires moderate renovations to update the kitchen, bathroom, and HVAC system, and repair the exterior. With these updates, it could significantly increase its resale and rental value.
Repairs flagged
- Major kitchen cabinets — severely worn and outdated
- Major bathroom fixtures — dated and worn
- Major HVAC unit — likely outdated and inefficient
- Moderate exterior siding — some wear and tear
Value-add opportunities
- Resale update kitchen cabinets — modernizing the kitchen would significantly increase its appeal
- Both replace HVAC unit — improving energy efficiency and comfort
- Resale update bathroom fixtures — modernizing the bathroom would enhance the home's overall appeal
- Both repair and paint exterior — improving the home's curb appeal would attract more buyers/renters
Renovation cost estimate screening
| Repair item | Severity | Est. cost |
|---|---|---|
| kitchen cabinets · severely worn and outdated | Major | $15,000–50,000 |
| bathroom fixtures · dated and worn | Major | $15,000–50,000 |
| HVAC unit · likely outdated and inefficient | Major | $15,000–50,000 |
| exterior siding · some wear and tear | Moderate | $3,000–15,000 |
| Total estimated repair cost · 4 items | $48,000–165,000 |
Value-add ROI direction
- Resale update kitchen cabinets — modernizing the kitchen would significantly increase its appeal ↑
- Both replace HVAC unit — improving energy efficiency and comfort ↑
- Resale update bathroom fixtures — modernizing the bathroom would enhance the home's overall appeal ↑
- Both repair and paint exterior — improving the home's curb appeal would attract more buyers/renters ↑
ⓘ Cost ranges are severity-bucket heuristics (US national rule-of-thumb). Get contractor quotes + a written scope before underwriting a rehab budget.
Schools (NCES district)
- District
- Plumas Unified
- NCES district ID
- 0631170
- Math proficiency
- 21% ▼ -11.00%
- Reading proficiency
- 44% ▬ 0.00%
- Median HH income
- $46,935
- Composite
- 27.89/100
- National rank
- #6870
- State rank
- #306 of 517 in CA
Livability — Chester
- Score
- 60/100
- State rank
- #581
- US rank
- #18928
Category grades
Schools grade is shown separately in the Schools card above.
Census & demographics
- Census place
- Chester, CA
- Population (ZIP)
- 2,404
Population outlook (Plumas County) Hauer SSP2
- Today (2025)
- 15,564 people
- By 2030
- 14,014 · -10.0%
- By 2040
- 11,197 · -28.1%
- By 2050
- 9,069 · -41.7%
- By 2075
- 5,573 · -64.2%
- By 2100
- 3,392 · -78.2%
Race, ethnicity, and origin ACS 2023
- Neighborhood character
- Predominantly White (82%)
- Race & ethnicity
- White 82% Hispanic / Latino 15% Two or more races 4%
- Hispanic origin (detail)
- Mexican 8% Puerto Rican 4%
- Common ancestry
- Slovak 6% Italian 4% Iranian 2%
- Foreign-born
- 0%
- Languages at home
- 97% English-only · Spanish 3%
Political lean MEDSL · Plumas
- 2024 margin
- R (+16.9) · D 39.9% · R 56.9% · Other 3.2%
- 2008→2024 swing
- -5.0pp toward R · 2008: -12.0pp · 2024: -16.9pp
- All cycles
- 2024: R+16.9 2020: R+16.7 2016: R+21.0 2012: R+17.2 2008: R+12.0
Not yet ingested
- Civics
- —
Market trends
- HPI YoY
- ▲ 16.21%
- Current HPI
- 142.75
- Rent YoY
- —
- Metro
- —
- State GDP YoY
- ▲ 3.21%
- F500 in state
- 116
Industry mix (Fortune 500 HQ in CA)
| Industry | F500 HQs | Revenue |
|---|---|---|
| Technology | 27 | $1,492B |
|
||
| Financial Services | 3 | $174B |
|
||
| Retail | 3 | $44B |
|
||
| Insurance | 3 | $26B |
|
||
| Media / Entertainment | 2 | $115B |
|
||
| Pharmaceuticals / Biotech | 2 | $62B |
|
||
Price history
1 event — show timeline
- 2026-06-05 Listed $92,000 PAR
Cash-flow waterfall
monthlySold comps — $/sqft
last 12 mo · ≤1 miLoading sold comps…