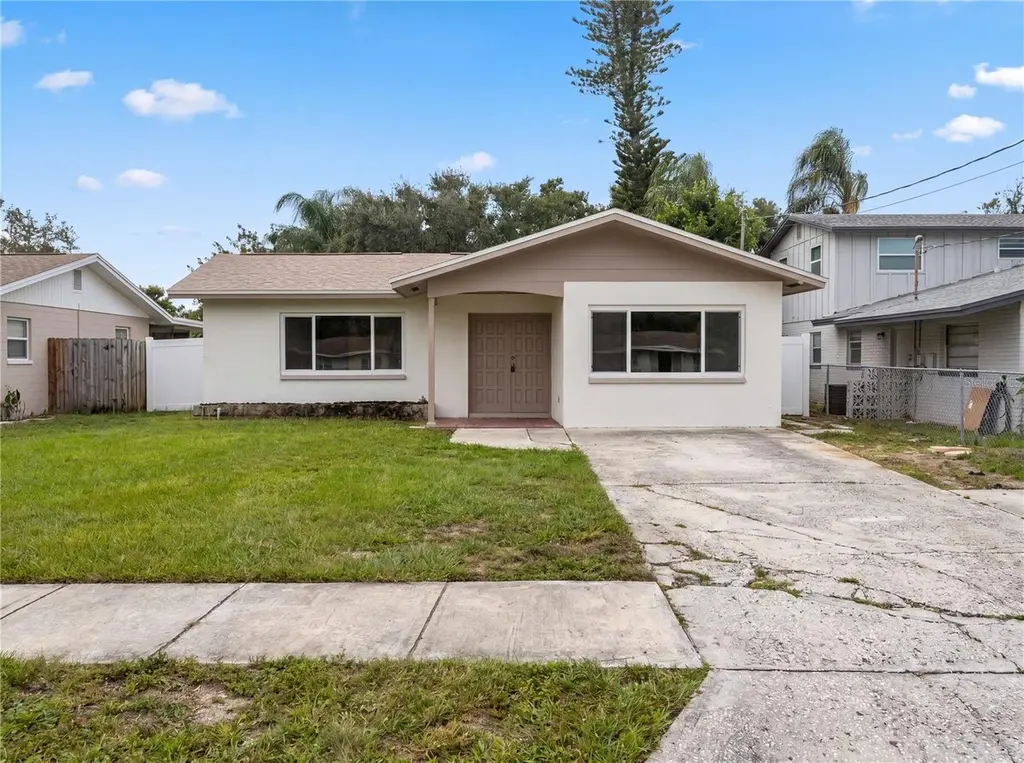
1431 Coburn Dr · Tarpon Springs, FL
Flood risk 5/10 · Moderate
- FEMA flood zone
- X (shaded)
- Chance of flooding over 30 yrs
- 0.44%
- Est. flood insurance / yr
- $507 – $1,088
Fire risk 1/10 · Minimal
- Est. fire insurance / yr
- $947 – $1,759
Heat risk 10/10 · Severe
- Hot days now (above 109°F)
- 7 days/yr
- Hot days in 30 yrs
- 27 days/yr
Wind risk 10/10 · Severe
- Chance of severe wind over 30 yrs
- 99.0%
Air-quality risk 3/10 · Minor
- Unhealthy air days now
- 3 days/yr
- Unhealthy air days in 30 yrs
- 3 days/yr
Risk factors via First Street. Map © Google.
Why this score? — see what drove the C grade
The composite is a weighted blend of 9 inputs, each scored 0–100. Each bar is that input's sub-score; the figure is the points it added to the 100-point composite (weight × sub-score).
- Cash flow +20.9/30.0
- ARV discount +15.0/15.0
- DSCR +6.6/10.0
- 1% rule +4.3/10.0
- Schools +4.3/10.0
- Livability +3.4/5.0
- Condition / age +2.5/5.0
- Rent growth +2.2/5.0
- Appreciation +0.0/10.0
$300,000
🖨 Deal sheet 📄 Offer letter ✓ Due diligence
Listing remarks
Discover this charming, move-in-ready home located just minutes from the sparkling Gulf waters and the highly regarded Tarpon Springs High School. Offering the perfect blend of comfort and convenience, this property features a bright, inviting kitchen with a breakfast bar, abundant cabinetry, and plenty of room for meal prep and gathering. With 3 well-appointed bedrooms and 1.5 baths, this home provides flexible living space for guests, hobbies, or everyday comfort. You’ll also appreciate the dedicated home office, ideal for remote work or creative projects. Step outside to a fully fenced backyard, perfect for pets, gardening, or weekend relaxation. Opportunities like this &md
Key facts
- Move-in-ready home
- Abundant cabinetry
- Breakfast bar
Tags
Property features AI
Finance
- Other: Residential zoning (RES)
- HOA & community: No HOA/association indicated; Pets allowed
Exterior
- Parking: Parking details not provided
- Utilities: Public water; Public sewer; Public utilities
- Home design: Single family residence; One story; North-facing
- Construction: Block and stucco construction; Shingle roof; Slab foundation; Built on a 0.16-acre lot
- Exterior features: Sliding doors; Paved road access
Interior
- Kitchen: Dishwasher; Range
- Bedrooms: 3 bedrooms
- Flooring: Carpet; Tile
- Bathrooms: 1 full bathroom; 1 half bathroom
- Heating & cooling: Central heating; Central air conditioning
- Interior features: Ceiling fans
- Laundry & utility: Washer hookup; Electric dryer hookup; Dedicated laundry room
Neighborhood map
What this means for you Summary
Snapshot
- This is a 3-bed/1.5-bath single-family listed at $300k.
Deal economics
- At list price, monthly cash flow is $415 ($5k/yr) — positive.
- The deal already cash-flows at list — no discount required.
- To meet the 1% rule (rent ≥ 1% of price), the offer needs to be $278k (7.2% below list).
- Recommended offer: $278k (7.2% below list) — sets the bar for 1% rule.
- Cap rate 8.0% vs local median 3.4% in Tarpon Springs — top-decile yield for the area; either an underpriced asset or a hidden risk that comps aren't pricing in. Stress-test before assuming the spread holds.
Location & tenants
- Location reads 68/100 on livability (#502 in FL) — a middle-class / working-renter tenant base. Strengths: housing A+, cost of living A, schools A-; Watch: employment C-, amenities F, commute F.
- Pinellas (suburban): math 51% / reading 51% proficiency, ranked #31 of 73 in FL (top 42%) — acceptable for families but not a draw, mixed tenant base, ~2y average lease.
- Market conditions: Rents soft (-1.2%/yr); 399 active listings in the ZIP; 17 comparable units currently listed for rent nearby; rentals leasing fast (median 12d on market — plan ~1-2 weeks tenant-placement turnaround); 2,676 units permitted in Pinellas County in 2024 (1,422 in 5+ unit buildings).
- This rent runs 45% of the median local income ($75k/yr) — at the standard rent-burdened threshold; future hikes will face affordability resistance.
Forward outlook
- Local home prices are declining (-3.0%/yr); year-one equity from $2k of loan paydown is wiped out by about $9k of value loss. Plan a longer hold.
- Pinellas County population projected at +14% by 2050 — modest demand growth; plan on rents tracking national, not racing it.
Negotiation context
- Only 9 days on market — expect competitive offers; lowballing is unlikely to land.
- 2 sale attempts since 19y ago with the ask held roughly flat each time — persistent listings suggest the price (not the market) is what's stuck; bring a comps-based counter.
Risks & watch-outs
- Climate carrying-cost: moderate flood risk; severe wind risk, 99% chance of damaging wind over 30y; extreme-heat days projected 7→27/yr by 2055 (HVAC capex compounding) — expect insurance premiums to compound above CPI over the hold.
Questions for the listing agent
- Built in 1969 — when were the roof, HVAC, electrical panel, plumbing, and water heater last replaced?
- Is there a deadline driving the sale (1031 exchange, divorce, estate, relocation)? That informs how much negotiation room exists.
- Schools are A-rated — typically a magnet for longer-tenancy family renters. What's the average tenant stay here, and is there a school-zone premium baked into asking?
- What's the average days-on-market for RENTAL listings here right now (not sales)? A rising rental-DOM trend means longer vacancies and softer asking-rent achievability than the comps imply.
- What's the recent tenant-quality profile in this submarket — average credit score on applications, eviction rate, late-payment / NSF rate, and stable-employment percentage? A property-management company in the area should have these aggregated.
- How much new for-sale + rental construction is in the pipeline within 1–3 miles? Heavy new supply typically softens prices + rents 12–24 months out; constrained supply supports both.
Investment metrics
- 1% rule
- 0.93% ✗
- Cap rate
- 7.95%
- Cash-on-cash
- 5.92%
- DSCR
- 1.26
- GRM
- 9.0
CMA / ARV
- ARV (on-the-fly)
- $430,848
- Comps found
- 12
Show comp detail 12 sales within ~0.75 mi
| Address | Dist | Beds/Ba | Sqft | Sold | Price | $/sf | Match |
|---|---|---|---|---|---|---|---|
| 1412 Coburn Dr | 0.04mi | 3/2.0 | 1,432 (-10%) | 11mo | $389,000 | $272 | 71 |
| 1408 Garden Ave | 0.42mi | 3/2.0 | 1,687 (+6%) | 3mo | $300,000 | $178 | 65 |
| 1312 Gulf Rd | 0.40mi | 3/2.0 | 1,450 (-8%) | 1mo | $440,000 | $303 | 65 |
| 111 Lakeside Colony Dr | 0.30mi | 3/2.0 | 1,500 (-5%) | 13mo | $315,000 | $210 | 64 |
| 1404 Oleander Dr | 0.40mi | 3/2.0 | 1,687 (+6%) | 7mo | $535,000 | $317 | 63 |
| 101 Colony South Dr | 0.39mi | 2/2.0 (-1) | 1,540 (-3%) | 13mo | $350,000 | $227 | 59 |
| 402 Village Dr | 0.58mi | 3/2.0 | 1,677 (+6%) | 3mo | $524,900 | $313 | 59 |
| 1210 Crossbow Ln | 0.68mi | 3/2.0 | 1,524 (-4%) | 4mo | $360,000 | $236 | 57 |
| 1403 Tallahassee Dr | 0.36mi | 4/2.0 (+1) | 1,690 (+7%) | 10mo | $420,000 | $249 | 57 |
| 1310 Meres Blvd | 0.59mi | 3/2.0 | 1,550 (-2%) | 14mo | $377,000 | $243 | 56 |
| 1509 Poinsettia Ave | 0.37mi | 3/2.0 | 1,800 (+14%) | 12mo | $550,000 | $306 | 48 |
| 701 Charlotte Ave | 0.74mi | 3/3.0 | 1,754 (+11%) | 4mo | $515,000 | $294 | 38 |
Match score weights: distance 35% · size 25% · config 20% · recency 20%. Top-matched comps best support the ARV.
Projected returns pro-forma
-3.0% appreciation · 0.0% rent growth · sell at horizon
- IRR
- -10.2%
- Equity multiple
- 0.64×
- Total profit
- $-30,494
- Equity at exit
- $44,731
- IRR
- -5.1%
- Equity multiple
- 0.71×
- Total profit
- $-24,621
- Equity at exit
- $25,939
Cash invested: $84,000 (down + closing). Projections, not guarantees.
Landlord ↔ Tenant lean methodology
- Overall (STATE)
- 87 Strongly Landlord-Friendly
- State Florida
- 87 Strongly Landlord-Friendly · R+3
- County
- — inherits STATE
- City
- — inherits STATE
ZIP-level market 34689
- Rents YoY
- -1.2%
- Active inventory
- 399
- Price-to-rent
- 9.0×
Monthly cashflow live
- Estimated rent
- $2,784 high interval (Pro) →
- Mortgage (P&I)
- −$1,573
- Tax from tax record
- −$86 /mo · $1,035/yr
- Insurance
- −$125
- HOA
- −$0
- Vacancy / Maint / Mgmt
- −$585
- Net cashflow
- $415
Break-even live
UW: 25.0% down · 7.5% · 30yr · 1.5% tax · 5.0% vac · 8.0% maint · 8.0% mgmt
Financing live
Cash to close
- Down payment
- $75,000
- Closing costs
- $9,000
- Reserves months
- —
- Total cash needed
- —
Loan-product check · same deal, 3 products live
Conventional
25% down · 7.5% · 30yr
- Down + closing
- —
- Monthly P&I
- —
- Monthly cashflow
- —
- DSCR
- —
- Eligible?
- —
Personal DTI + credit; lowest rate.
DSCR
20% down · 8.5% · 30yr
- Down + closing
- —
- Monthly P&I
- —
- Monthly cashflow
- —
- DSCR
- —
- Eligible?
- —
No personal income docs; deal must DSCR.
Hard money
10% down · 12.0% · 12mo
- Down + closing
- —
- Monthly P&I
- —
- Monthly cashflow
- —
- DSCR
- —
- Eligible?
- —
Short-term bridge; refi at stabilization.
Rent comps 17 comps
| Address | Beds | Baths | Sqft | Rent | $/sqft | DOM | Units | Dist |
|---|---|---|---|---|---|---|---|---|
| 1500 Sunset Rd Unit C4 Tarpon Springs, FL | 2.0 | 1.5 | 1170 | $2,100 | $1.79 | 24d | 1 | 0.22mi |
| 504 S Florida Ave #222 Tarpon Springs, FL | 2.0 | 2.0 | 1490 | $1,895 | $1.27 | 4d | 1 | 0.31mi |
| 1417 Poinsettia Ave Unit 1244469P Tarpon Springs, FL | 4.0 | 3.0 | 2098 | $6,739 | $3.21 | 7d | 1 | 0.45mi |
| 335 Windrush Loop #335 Tarpon Springs, FL | 2.0 | 2.0 | 1565 | $3,000 | $1.92 | 24d | 1 | 0.46mi |
| 787 Arthurs Ct Tarpon Springs, FL | 3.0 | 2.0 | 1225 | $2,295 | $1.87 | 4d | 1 | 0.46mi |
| 610 Charlotte Ave Tarpon Springs, FL | 4.0 | 2.5 | 1712 | $2,710 | $1.58 | 24d | 1 | 0.69mi |
| 723 Sunset Dr Tarpon Springs, FL | 3.0 | 2.0 | 1374 | $2,290 | $1.67 | 12d | 1 | 0.82mi |
| 1701 Avoca Dr Tarpon Springs, FL | 3.0 | 2.0 | 1712 | $3,000 | $1.75 | 24d | 1 | 0.90mi |
| 1669 Seascape Cir #1669 Tarpon Springs, FL | 2.0 | 2.0 | 1070 | $2,200 | $2.06 | 24d | 1 | 0.97mi |
| 1334 Belcher Dr Tarpon Springs, FL | 3.0 | 2.0 | 2055 | $3,500 | $1.70 | 1d | 1 | 1.16mi |
| 1805 Mariner Dr #52 Tarpon Springs, FL | 2.0 | 2.0 | 1065 | $2,000 | $1.88 | 21d | 1 | 1.23mi |
| 1806 Mariner Dr #214 Tarpon Springs, FL | 2.0 | 2.0 | 1150 | $2,100 | $1.83 | 24d | 1 | 1.27mi |
| 1814 Mariner Dr #159 Tarpon Springs, FL | 2.0 | 2.0 | 1065 | $2,000 | $1.88 | 14d | 1 | 1.34mi |
| 1813 Mariner Dr #151 Tarpon Springs, FL | 2.0 | 2.0 | 1065 | $2,500 | $2.35 | 4d | 1 | 1.36mi |
| 1913 Whispering Way Tarpon Springs, FL | 3.0 | 2.5 | 1564 | $2,295 | $1.47 | 4d | 1 | 1.38mi |
| 1900 Whispering Way Tarpon Springs, FL | 2.0 | 2.0 | 1173 | $2,750 | $2.34 | 3d | 1 | 1.39mi |
| 211 Timberlane Dr Palm Harbor, FL | 2.0 | 1.0 | 1422 | $2,500 | $1.76 | 3d | 1 | 1.45mi |
Listing history 7 events
-
2026-06-18days on market $300,000 Active 9 DOM
-
2026-06-17days on market $300,000 Active 8 DOM
-
2026-06-16days on market $300,000 Active 7 DOM
-
2026-06-15days on market $300,000 Active 6 DOM
-
2026-06-13days on market $300,000 Active 4 DOM
-
2026-06-10remarks 693-char remark
-
2026-06-10$300,000 Active 1 DOM
ⓘ Source: listings_history table (triggers on properties + properties_extension) + one-shot
backfill from property_details.listing_events for pre-trigger history.
Tax reassessment forecast FL · Resets to sale price
- Current annual tax
- $1,035 · $86/mo
- Projected year-2 tax
- $2,490 · $208/mo
- Expected delta
- +$1,455/yr (+$121/mo · 140.6%)
ⓘ Screening estimate from a state-policy table — verify with the county assessor before closing.
Climate risk First Street
- Flood 5/10 Major FEMA zone X (shaded) · 44% chance over 30 yrs
- Wildfire 1/10 Low
- Heat 10/10 Extreme 7 d/yr ≥109°F today · 27 d/yr by 30 yrs out
- Wind 10/10 Extreme 99% chance of damaging wind over 30 yrs
- Air quality 3/10 Moderate 3 unhealthy d/yr today · 3 by 30 yrs out
Nearby sold comps map
Loading sold comps map…
Walkable amenities ~0.75 mi
Loading nearby amenities…
Taxation est. · year 1
- Rental income
- $33,405
- − Mortgage interest
- −$16,805
- − Property taxes
- −$1,035
- − Insurance
- −$1,500
- − Repairs & maintenance
- −$2,672
- − Management
- −$2,672
- − Depreciation
- −$8,727
- Taxable loss
- −$6
- Est. tax savings @ 24.0%
- +$2
- After-tax cash flow
- $4,978/yr
For passive investors: Depreciation is non-cash, so a rental often shows a tax loss while cash-flowing — sheltering income. Rental losses are passive: they offset passive income freely, and up to $25,000/yr can offset ordinary (W-2) income if you actively participate and your MAGI is under $100k (phasing out to $0 by $150k); unused losses carry forward. On sale, claimed depreciation is recaptured at up to 25%, and gains may owe capital-gains tax (a 1031 exchange can defer both). Figures are a year-1 estimate at your 24.0% rate — not tax advice; consult a CPA.
Schools (NCES district)
- District
- Pinellas
- NCES district ID
- 1201560
- Math proficiency
- 51% ▼ -5.00%
- Reading proficiency
- 51% ▼ -3.00%
- Median HH income
- $46,270
- Composite
- 43.27/100
- National rank
- #3046
- State rank
- #31 of 73 in FL
Livability — Tarpon Springs
- Score
- 68/100
- State rank
- #502
- US rank
- #9244
Category grades
Schools grade is shown separately in the Schools card above.
Census & demographics
- Census place
- Tarpon Springs, FL
- County
- Pinellas County · 939,478 people
- City population
- 27,324
- Metro
- Tampa-St. Petersburg-Clearwater, FL
- Population (ZIP)
- 27,324
- Household income
- $74,854
- Rent vs Own
- Severe rent burden
- 721.0
Population outlook (Pinellas County) Hauer SSP2
- Today (2025)
- 1,027,532 people
- By 2030
- 1,063,586 · +3.5%
- By 2040
- 1,125,020 · +9.5%
- By 2050
- 1,168,637 · +13.7%
- By 2075
- 1,265,188 · +23.1%
- By 2100
- 1,260,357 · +22.7%
Race, ethnicity, and origin ACS 2023
- Neighborhood character
- Predominantly White (80%)
- Race & ethnicity
- White 80% Hispanic / Latino 10% Two or more races 7% Black 6%
- Hispanic origin (detail)
- Mexican 2% Puerto Rican 4%
- Common ancestry
- Romanian 6% Lithuanian 3% Slovak 2%
- Foreign-born
- 10% · Canada, Jamaica, Dominican Republic
- Languages at home
- 84% English-only · Other Indo-European 6% Spanish 6% French/Haitian/Cajun 1%
Political lean MEDSL · Pinellas
- 2024 margin
- Lean R (+5.2) · D 46.9% · R 52.1%
- 2008→2024 swing
- -13.5pp toward R · 2008: 8.3pp · 2024: -5.2pp
- All cycles
- 2024: R+5.2 2020: D+0.2 2016: R+1.1 2012: D+5.6 2008: D+8.3
Not yet ingested
- Civics
- —
Market trends
- HPI YoY
- ▼ -300.96%
- Current HPI
- 303.7434
- Rent YoY
- ▼ -1.16%
- Metro
- Tampa-St. Petersburg-Clearwater, FL
- State GDP YoY
- ▲ 3.28%
- F500 in state
- 36
Industry mix (Fortune 500 HQ in FL)
| Industry | F500 HQs | Revenue |
|---|---|---|
| Industrial Technology | 2 | $29B |
|
||
| Insurance | 2 | $17B |
|
||
| Retail | 1 | $60B |
|
||
| Technology Distribution | 1 | $58B |
|
||
| Homebuilding | 1 | $35B |
|
||
| Technology Manufacturing | 1 | $35B |
|
||
Price history
+46.3% since first listed3 events — show timeline
- 2026-06-09 Listed $300,000 Stellar MLS as Distributed by MLS Grid
- 2007-04-23 Listing Removed — Stellar MLS as Distributed by MLS Grid
- 2007-02-07 Listed $205,000 Stellar MLS as Distributed by MLS Grid
Property tax history
-3.4%/yrLatest (2025): $1,035 · +7.5% YoY. Source: county tax records.
Cash-flow waterfall
monthlySold comps — $/sqft
last 12 mo · ≤1 miLoading sold comps…