400 W Baseline Rd #220 · Tempe, AZ
Flood risk 1/10 · Minimal
- FEMA flood zone
- X (shaded)
- Chance of flooding over 30 yrs
- 0.0%
- Est. flood insurance / yr
- $507 – $1,088
Fire risk 1/10 · Minimal
- Est. fire insurance / yr
- $610 – $1,132
Heat risk 9/10 · Severe
- Hot days now (above 111°F)
- 6 days/yr
- Hot days in 30 yrs
- 17 days/yr
Wind risk 1/10 · Minimal
- Chance of severe wind over 30 yrs
- —
Air-quality risk 2/10 · Minimal
- Unhealthy air days now
- 1 days/yr
- Unhealthy air days in 30 yrs
- 1 days/yr
Risk factors via First Street. Map © Google.
Why this score? — see what drove the C grade
The composite is a weighted blend of 9 inputs, each scored 0–100. Each bar is that input's sub-score; the figure is the points it added to the 100-point composite (weight × sub-score).
- Cash flow +24.6/30.0
- DSCR +8.0/10.0
- ARV discount +7.5/15.0
- 1% rule +6.4/10.0
- Condition / age +4.0/5.0
- Livability +3.9/5.0
- Rent growth +2.0/5.0
- Schools +2.0/10.0
- Appreciation +0.0/10.0
$169,900
🖨 Deal sheet 📄 Offer letter ✓ Due diligence
Listing remarks
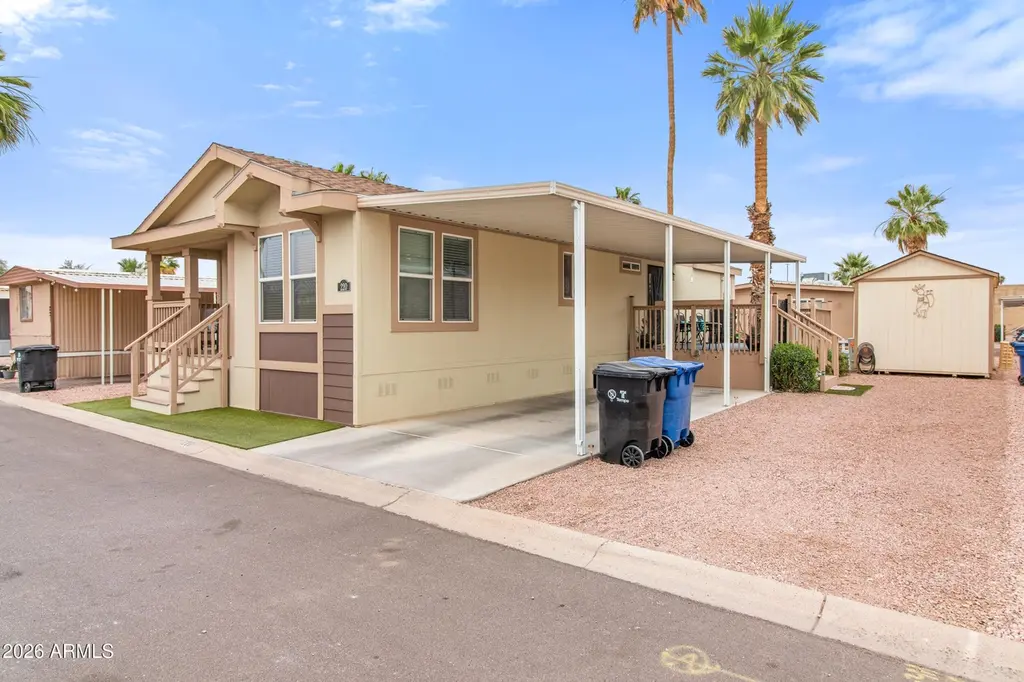
* * * ALL AGE PARK * * * LIKE NEW 2017 CAVCO 3 BEDROOM, 2 BATHROOM DOUBLEWIDE, 1248 SQ FT, VAULTED CEILINGS, FRONT STEPS TO QUAINT COVERED PORCH, BACK DECK WITH FRONT AND REAR STEPS TO THE LARGER SHED/WORKHOP, EXTERIOR JUST FRESHLY PAINTED, DUAL PANE WINDOWS, VAULTED CEILINGS, TWO-TONED PAINT, MASTER BEDROOM WALK IN CLOSET, MASTER BATHROOM WALK IN SHOWER/SEPERATE TOILETRY, NEW LUXURY PLANK FLOORING IN 2025,UPGRADES GALORE PRICED UNDER THE OTHER NEW HOMES IN THE PARK, HOME NICELY LOCATED IN PARK SURROUNDED BY NEW DOUBLEWIDE HOMES, BBQUE STAYS HOOKED TO GAS, Chaparral Village is a mobile home park in Tempe, Arizona with two pools, a baseball and soccer field, a basketball court, a playgr
Key facts
- Covered porch
- Freshly painted
- Back deck
Tags
Property features AI
Finance
- Other: Utilities: see remarks
- Financial info: Current financing: Other
- HOA & community: Land lease: $944 monthly; No association fees included; Community pool and heated spa; Community laundry (including coin-op); Community media room; Playground; Biking/walking path; Fitness center; Near bus stop
Exterior
- Parking: 2 covered parking spaces; 2 carport spaces
- Utilities: City water; Public sewer; 220 volts in kitchen
- Home design: Manufactured / mobile home; Leasehold ownership
- Construction: Wood siding and wood frame construction; Painted exterior; Composition roof; Building area reported by owner
- Exterior features: Private street; Storage; Built-in barbecue; Partial fencing; Gravel/stone front and back yards; Synthetic grass in back yard; City and city lights views; Asphalt road; Private maintained road
Interior
- Kitchen: Built-in microwave; Laminate counters; Pantry; 220-volt circuit in kitchen
- Bedrooms: Up to 4 possible bedrooms
- Flooring: Carpet; Laminate
- Bathrooms: 2 full bathrooms
- Heating & cooling: Natural gas heating; Central air; Ceiling fans; Programmable thermostat
- Interior features: High-speed internet; Double vanity in bathroom; Breakfast bar; No interior steps; Vaulted ceilings; Pantry; Full bathroom in primary bedroom; Laminate counters; Dual-pane windows with vinyl frames; Multiple entries/exits; Lever-style door handles; Lever-handle bath faucets
- Laundry & utility: Inside laundry; Refrigerator; Dishwasher; Disposal
Neighborhood map
What this means for you Summary
Snapshot
- This is a 3-bed/2.0-bath manufactured listed at $170k. Condition is rated good.
Deal economics
- At list price, monthly cash flow is $352 ($4k/yr) — positive.
- The deal already cash-flows at list — no discount required.
- Meets the 1% rule at list price ($2k rent vs $170k).
- Recommended offer: $165k (3.0% below list) — sets the bar for market timing.
- Cap rate 8.8% vs local median 3.4% in Tempe — top-decile yield for the area; either an underpriced asset or a hidden risk that comps aren't pricing in. Stress-test before assuming the spread holds.
Location & tenants
- Location reads 78/100 on livability (#10 in AZ, #2,527 nationally) — a middle-class / working-renter tenant base. Strengths: amenities A+, commute A+, housing A+; Watch: cost of living C-, health & safety D, crime F.
- Tempe School District (4258) (urban): math 17% / reading 29% proficiency, ranked #170 of 249 in AZ (top 68%) — low school quality limits family demand, transient renter base, plan for 1-2y turnover.
- Zoned schools: Curry Elementary School (math 11% / reading 29%, grade F, #742 of 1,109 statewide, top 67%, 464 students, 73% FRL) — zoned schools average 73% FRL vs 57% district-wide (16 pts higher); higher-poverty schools than district average — tighter screening recommended.
- Market conditions: Rents soft (-1.9%/yr); 141 active listings in the ZIP; 40 comparable units currently listed for rent nearby; rentals leasing fast (median 1d on market — plan ~1-2 weeks tenant-placement turnaround); solid renter incomes; 36,011 units permitted in Maricopa County in 2024 (12,801 in 5+ unit buildings).
Forward outlook
- Local home prices are declining (-3.0%/yr); year-one equity from $1k of loan paydown is wiped out by about $5k of value loss. Plan a longer hold.
- Maricopa County population projected at +38% by 2050 — long-run rental-demand tailwind backs the buy-and-hold thesis.
Negotiation context
- It's been on market 43 days — a 3% lower offer ($165k) is reasonable based on typical stale-listing flexibility.
Risks & watch-outs
- Climate carrying-cost: extreme-heat days projected 6→17/yr by 2055 (HVAC capex compounding) — expect insurance premiums to compound above CPI over the hold.
Questions for the listing agent
- It's been on market 43 days. Have you received any prior offers? Is the seller open to a 3% concession, seller financing, or rate buy-down credit?
- Is there a deadline driving the sale (1031 exchange, divorce, estate, relocation)? That informs how much negotiation room exists.
- Crime grade is F in this area — have there been break-ins, vandalism, or insurance claims at this property in the last 3 years? What carrier currently insures it and at what premium?
- What's the average days-on-market for RENTAL listings here right now (not sales)? A rising rental-DOM trend means longer vacancies and softer asking-rent achievability than the comps imply.
- What's the recent tenant-quality profile in this submarket — average credit score on applications, eviction rate, late-payment / NSF rate, and stable-employment percentage? A property-management company in the area should have these aggregated.
- How much new for-sale + rental construction is in the pipeline within 1–3 miles? Heavy new supply typically softens prices + rents 12–24 months out; constrained supply supports both.
Investment metrics
- 1% rule
- 1.14% ✓
- Cap rate
- 8.78%
- Cash-on-cash
- 8.88%
- DSCR
- 1.40
- GRM
- 7.3
CMA / ARV
- ARV (on-the-fly)
- $74,880
- Comps found
- 7
Show comp detail 7 sales within ~0.75 mi
| Address | Dist | Beds/Ba | Sqft | Sold | Price | $/sf | Match |
|---|---|---|---|---|---|---|---|
| 400 W Baseline Rd #77 | 0.08mi | 3/2.0 | 1,259 (+1%) | 13mo | $95,000 | $75 | 84 |
| 400 W Baseline Rd #281 | 0.00mi | 4/2.0 (+1) | 1,320 (+6%) | 3mo | $129,900 | $98 | 83 |
| 400 W Baseline Rd #251 | 0.03mi | 3/2.0 | 1,152 (-8%) | 10mo | $52,000 | $45 | 78 |
| 400 W Baseline Rd #72 | 0.08mi | 3/2.0 | 1,200 (-4%) | 17mo | $70,000 | $58 | 76 |
| 400 W Baseline Rd #215 | 0.08mi | 4/2.0 (+1) | 1,320 (+6%) | 11mo | $138,000 | $105 | 73 |
| 400 W Baseline Rd #308 | 0.08mi | 2/2.0 (-1) | 1,152 (-8%) | 14mo | $69,000 | $60 | 67 |
| 400 W Baseline Rd #24 | 0.08mi | 3/1.0 | 1,100 (-12%) | 12mo | $55,000 | $50 | 63 |
Match score weights: distance 35% · size 25% · config 20% · recency 20%. Top-matched comps best support the ARV.
Projected returns pro-forma
-3.0% appreciation · 0.0% rent growth · sell at horizon
- IRR
- -6.3%
- Equity multiple
- 0.77×
- Total profit
- $-10,745
- Equity at exit
- $25,333
- IRR
- -0.8%
- Equity multiple
- 0.95×
- Total profit
- $-2,251
- Equity at exit
- $14,690
Cash invested: $47,572 (down + closing). Projections, not guarantees.
Landlord ↔ Tenant lean methodology
- Overall (STATE)
- 87 Strongly Landlord-Friendly
- State Arizona
- 87 Strongly Landlord-Friendly · R+3
- County
- — inherits STATE
- City
- — inherits STATE
ZIP-level market 85283
- Rents YoY
- -1.9%
- Active inventory
- 141
- Price-to-rent
- 7.3×
Monthly cashflow live
- Estimated rent
- $1,932 high interval (Pro) →
- Mortgage (P&I)
- −$891
- Tax est. 1.5%
- −$212 /mo · $2,548/yr
- Insurance
- −$71
- HOA
- −$0
- Vacancy / Maint / Mgmt
- −$406
- Net cashflow
- $352
Break-even live
UW: 25.0% down · 7.5% · 30yr · 1.5% tax · 5.0% vac · 8.0% maint · 8.0% mgmt
Financing live
Cash to close
- Down payment
- $42,475
- Closing costs
- $5,097
- Reserves months
- —
- Total cash needed
- —
Loan-product check · same deal, 3 products live
Conventional
25% down · 7.5% · 30yr
- Down + closing
- —
- Monthly P&I
- —
- Monthly cashflow
- —
- DSCR
- —
- Eligible?
- —
Personal DTI + credit; lowest rate.
DSCR
20% down · 8.5% · 30yr
- Down + closing
- —
- Monthly P&I
- —
- Monthly cashflow
- —
- DSCR
- —
- Eligible?
- —
No personal income docs; deal must DSCR.
Hard money
10% down · 12.0% · 12mo
- Down + closing
- —
- Monthly P&I
- —
- Monthly cashflow
- —
- DSCR
- —
- Eligible?
- —
Short-term bridge; refi at stabilization.
Rent comps 40 comps
| Address | Beds | Baths | Sqft | Rent | $/sqft | DOM | Units | Dist |
|---|---|---|---|---|---|---|---|---|
| 4505 S Hardy Dr Tempe, AZ | 1.0–2.0 | 1.0–2.5 | 840 | $1,799 | $2.14 | 1d | 19 | 0.34mi |
| 505 W Baseline Rd Tempe, AZ | 1.0–2.0 | 1.0–2.0 | 863 | $1,525 | $1.77 | 1d | 33 | 0.39mi |
| 30 W Carter Dr Tempe, AZ | 2.0 | 1.0–2.0 | 652 | $1,635 | $2.51 | 1d | 28 | 0.39mi |
| 15 E Carter Dr Tempe, AZ | 2.0 | 1.5 | 1119 | $1,695 | $1.51 | 21d | 1 | 0.41mi |
| 15 E Carter Dr Tempe, AZ | 2.0 | 1.5 | 1088 | $1,695 | $1.56 | 18d | 1 | 0.41mi |
| 5038 S Hardy Dr Tempe, AZ | 1.0–3.0 | 1.0–2.0 | 1082 | $1,959 | $1.81 | 1d | 21 | 0.43mi |
| 4130 S Mill Ave Tempe, AZ | 2.0 | 1.0–2.0 | 675 | $1,399 | $2.07 | 1d | 61 | 0.46mi |
| 517 W Duke Dr Tempe, AZ | 3.0 | 2.0 | 1426 | $2,150 | $1.51 | 1d | 1 | 0.47mi |
| 208 E Baseline Rd Tempe, AZ | 1.0–2.0 | 1.0–2.0 | 800 | $1,399 | $1.75 | 1d | 20 | 0.54mi |
| 530 W La Jolla Dr Tempe, AZ | 2.0 | 1.0 | 881 | $1,650 | $1.87 | 1d | 1 | 0.58mi |
| 528 W La Jolla Dr Tempe, AZ | 3.0 | 2.0 | 1374 | $2,399 | $1.75 | 10d | 1 | 0.59mi |
| 106 E Duke Dr Tempe, AZ | 3.0 | 2.0 | 1478 | $2,150 | $1.45 | 23d | 1 | 0.60mi |
| 422 W Pebble Beach Dr Unit 418 Tempe, AZ | 2.0 | 1.0 | 950 | $1,500 | $1.58 | 1d | 1 | 0.61mi |
| 418 W Pebble Beach Dr Tempe, AZ | 2.0 | 1.0 | 950 | $1,500 | $1.58 | 1d | 1 | 0.61mi |
| 3730 S Mill Ave Tempe, AZ | 2.0 | 1.0–2.0 | 628 | $1,487 | $2.37 | 1d | 28 | 0.62mi |
| 515 W Pebble Beach Dr Unit 513 Tempe, AZ | 4.0 | 2.0 | 1100 | $3,200 | $2.91 | 1d | 1 | 0.62mi |
| 515 W Pebble Beach Dr Unit 515 Tempe, AZ | 2.0 | 1.0 | 800 | $2,000 | $2.50 | 1d | 1 | 0.62mi |
| 951 W La Jolla Dr Tempe, AZ | 3.0 | 2.0 | 1383 | $3,500 | $2.53 | 1d | 1 | 0.63mi |
| 1222 W Baseline Rd #261 Tempe, AZ | 2.0 | 2.0 | 980 | $1,400 | $1.43 | 1d | 1 | 0.67mi |
| 1133 W Baseline Rd Tempe, AZ | 1.0–3.0 | 1.0–2.0 | 957 | $2,100 | $2.19 | 1d | 1 | 0.69mi |
| 633 W Southern Ave #1147 Tempe, AZ | 3.0 | 2.0 | 1000 | $1,550 | $1.55 | 10d | 1 | 0.69mi |
| 524 W Malibu Dr Unit 4 Tempe, AZ | 2.0 | 1.0 | 750 | $1,299 | $1.73 | 1d | 1 | 0.70mi |
| 743 W Fordham Dr Tempe, AZ | 2.0 | 1.0 | 988 | $1,695 | $1.72 | 15d | 1 | 0.71mi |
| 4839 S Darrow Dr Tempe, AZ | 1.0–2.0 | 1.0–2.0 | 712 | $1,695 | $2.38 | 1d | 12 | 0.74mi |
| 1145 W Baseline Rd Tempe, AZ | 2.0 | 1.0–2.0 | 825 | $1,425 | $1.73 | 1d | 10 | 0.75mi |
| 909 W Malibu Dr Tempe, AZ | 3.0 | 2.0 | 1092 | $1,850 | $1.69 | 1d | 1 | 0.75mi |
| 407 E Harvard Dr Tempe, AZ | 3.0 | 2.0 | 1267 | $2,299 | $1.81 | 23d | 1 | 0.79mi |
| 1311 W Baseline Rd Tempe, AZ | 1.0–2.0 | 1.0–2.0 | 695 | $1,519 | $2.19 | 1d | 25 | 0.83mi |
| 1118 W Tulane Dr Tempe, AZ | 3.0 | 2.0 | 1253 | $2,879 | $2.30 | 1d | 1 | 0.84mi |
| 577 E Baseline Rd Tempe, AZ | 1.0–2.0 | 1.0–2.0 | 1033 | $2,159 | $2.09 | 1d | 14 | 0.85mi |
| 515 E Dunbar Dr Apt 10 Tempe, AZ | 2.0 | 1.0 | 820 | $1,550 | $1.89 | 3d | 1 | 0.85mi |
| 515 E Dunbar Dr Tempe, AZ | 2.0 | 1.0 | 820 | $1,695 | $2.07 | 1d | 1 | 0.85mi |
| 5105 S La Rosa Dr Tempe, AZ | 2.0 | 1.0 | 819 | $1,495 | $1.83 | 1d | 1 | 0.90mi |
| 1210 W Tulane Dr Tempe, AZ | 3.0 | 1.0 | 910 | $2,100 | $2.31 | 1d | 1 | 0.93mi |
| 200 E Southern Ave Tempe, AZ | 1.0–2.0 | 1.0–2.0 | 782 | $1,600 | $2.05 | 1d | 4 | 0.96mi |
| 314 E Malibu Dr Tempe, AZ | 3.0 | 2.0 | 1408 | $2,000 | $1.42 | 12d | 1 | 0.97mi |
| 15 W Geneva Dr Tempe, AZ | 4.0 | 2.0 | 1260 | $2,748 | $2.18 | 1d | 1 | 0.97mi |
| 1222 W Auburn Dr Tempe, AZ | 2.0 | 1.0 | 1074 | $2,200 | $2.05 | 10d | 1 | 0.98mi |
| 1040 W Yale Dr Tempe, AZ | 2.0 | 1.0 | 910 | $1,575 | $1.73 | 1d | 1 | 0.98mi |
| 427 E Malibu Dr Tempe, AZ | 3.0 | 2.0 | 1274 | $1,895 | $1.49 | 1d | 1 | 1.01mi |
Listing history 15 events
-
2026-06-18days on market $169,900 Active 43 DOM
-
2026-06-17days on market $169,900 Active 42 DOM
-
2026-06-16days on market $169,900 Active 41 DOM
-
2026-06-15days on market $169,900 Active 40 DOM
-
2026-06-13days on market $169,900 Active 38 DOM
-
2026-06-13days on market $169,900 Active 37 DOM
-
2026-06-09days on market $169,900 Active 34 DOM
-
2026-06-08days on market $169,900 Active 33 DOM
-
2026-06-07days on market $169,900 Active 32 DOM
-
2026-06-04days on market $169,900 Active 29 DOM
-
2026-06-03days on market $169,900 Active 28 DOM
-
2026-06-02days on market $169,900 Active 27 DOM
-
2026-06-01days on market $169,900 Active 26 DOM
-
2026-05-31days on market $169,900 Active 25 DOM
-
2026-05-01$169,900 Active
ⓘ Source: listings_history table (triggers on properties + properties_extension) + one-shot
backfill from property_details.listing_events for pre-trigger history.
Climate risk First Street
- Flood 1/10 Low FEMA zone X (shaded) · 0% chance over 30 yrs
- Wildfire 1/10 Low
- Heat 9/10 Extreme 6 d/yr ≥111°F today · 17 d/yr by 30 yrs out
- Wind 1/10 Low
- Air quality 2/10 Low 1 unhealthy d/yr today · 1 by 30 yrs out
Nearby sold comps map
Loading sold comps map…
Walkable amenities ~0.75 mi
Loading nearby amenities…
Taxation est. · year 1
- Rental income
- $23,182
- − Mortgage interest
- −$9,517
- − Property taxes
- −$2,548
- − Insurance
- −$850
- − Repairs & maintenance
- −$1,855
- − Management
- −$1,855
- − Depreciation
- −$4,943
- Taxable income
- $1,615
- Est. tax owed @ 24.0%
- −$388
- After-tax cash flow
- $3,836/yr
For passive investors: Depreciation is non-cash, so a rental often shows a tax loss while cash-flowing — sheltering income. Rental losses are passive: they offset passive income freely, and up to $25,000/yr can offset ordinary (W-2) income if you actively participate and your MAGI is under $100k (phasing out to $0 by $150k); unused losses carry forward. On sale, claimed depreciation is recaptured at up to 25%, and gains may owe capital-gains tax (a 1031 exchange can defer both). Figures are a year-1 estimate at your 24.0% rate — not tax advice; consult a CPA.
Condition & rehab AI · 6 photos
This well-maintained, recently updated manufactured home in a desirable park setting is ready for a new owner. It features modern finishes, a covered porch, and a large shed/workshop. The home is priced competitively and offers a great location with community amenities.
Value-add opportunities
- Both landscaping — enhances curb appeal and adds value
- Both painting — fresh paint can make a significant difference in curb appeal and value
- Resale upgrading appliances — modern appliances can attract more buyers
Renovation cost estimate screening
Value-add ROI direction
- Both landscaping — enhances curb appeal and adds value ↑
- Both painting — fresh paint can make a significant difference in curb appeal and value ↑
- Resale upgrading appliances — modern appliances can attract more buyers ↑
ⓘ Cost ranges are severity-bucket heuristics (US national rule-of-thumb). Get contractor quotes + a written scope before underwriting a rehab budget.
Schools (NCES district)
- District
- Tempe School District (4258)
- NCES district ID
- 0408310
- Math proficiency
- 17% ▼ -19.00%
- Reading proficiency
- 29% ▼ -10.00%
- Median HH income
- $43,112
- Composite
- 19.7/100
- National rank
- #8721
- State rank
- #170 of 249 in AZ
Livability — Tempe
- Score
- 78/100
- State rank
- #10
- US rank
- #2527
Category grades
Schools grade is shown separately in the Schools card above.
Census & demographics
- Census place
- Tempe, AZ
- County
- Maricopa County · 4,537,380 people
- City population
- 193,337
- Metro
- Phoenix-Mesa-Chandler, AZ
- Population (ZIP)
- 47,459
- Household income
- $84,568
- Rent vs Own
- Severe rent burden
- 2128.0
Population outlook (Maricopa County) Hauer SSP2
- Today (2025)
- 4,979,203 people
- By 2030
- 5,378,229 · +8.0%
- By 2040
- 6,156,598 · +23.6%
- By 2050
- 6,872,376 · +38.0%
- By 2075
- 8,401,270 · +68.7%
- By 2100
- 9,247,439 · +85.7%
Race, ethnicity, and origin ACS 2023
- Neighborhood character
- Diverse neighborhood (Simpson 0.69)
- Race & ethnicity
- White 46% Hispanic / Latino 30% Two or more races 15% Asian 8% Black 7% Native American 6%
- Hispanic origin (detail)
- Mexican 26%
- Common ancestry
- Portuguese 2% Romanian 2% Italian 2%
- Foreign-born
- 12% · Canada, China, Vietnam
- Languages at home
- 73% English-only · Spanish 17% Other Asian/Pacific 2% Other Indo-European 2%
Political lean MEDSL · Maricopa
- 2024 margin
- Toss-up / Even · D 47.7% · R 51.2% · Other 1.1%
- 2008→2024 swing
- +7.1pp toward D · 2008: -10.6pp · 2024: -3.5pp
- All cycles
- 2024: R+3.5 2020: D+2.2 2016: R+3.5 2012: R+12.0 2008: R+10.6
Not yet ingested
- Civics
- —
Market trends
- HPI YoY
- ▼ -390.57%
- Current HPI
- 328.638
- Rent YoY
- ▼ -1.95%
- Metro
- Phoenix-Mesa-Chandler, AZ
- State GDP YoY
- ▲ 4.54%
- F500 in state
- 20
Industry mix (Fortune 500 HQ in AZ)
| Industry | F500 HQs | Revenue |
|---|---|---|
| Technology | 2 | $13B |
|
||
| Mining / Metals | 1 | $23B |
|
||
| Environmental Services | 1 | $16B |
|
||
| Metals / Steel | 1 | $14B |
|
||
| Technology Distribution | 1 | $9B |
|
||
| Homebuilding | 1 | $8B |
|
||
Price history
1 event — show timeline
- 2026-05-01 Listed $169,900 ARMLS
Cash-flow waterfall
monthlySold comps — $/sqft
last 12 mo · ≤1 miLoading sold comps…