 Duplex
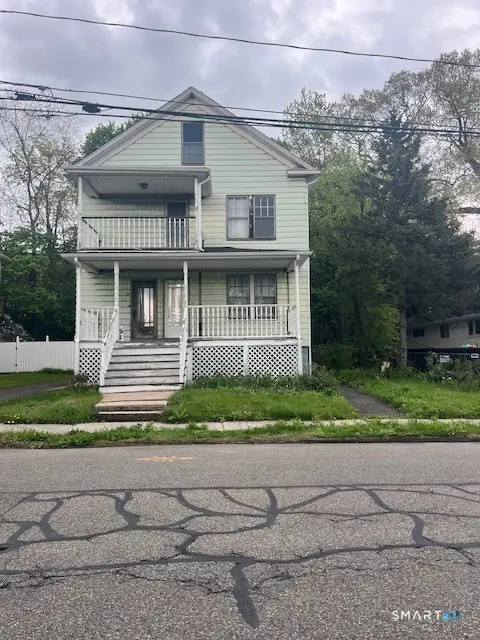
85 Hicks St · Meriden, CT
Flood risk 7/10 · Major
- FEMA flood zone
- X (unshaded)
- Chance of flooding over 30 yrs
- 0.77%
- Est. flood insurance / yr
- $473 – $860
Fire risk 1/10 · Minimal
- Est. fire insurance / yr
- $829 – $1,539
Heat risk 6/10 · Moderate
- Hot days now (above 98°F)
- 7 days/yr
- Hot days in 30 yrs
- 17 days/yr
Wind risk 6/10 · Moderate
- Chance of severe wind over 30 yrs
- 27.0%
Air-quality risk 3/10 · Minor
- Unhealthy air days now
- 3 days/yr
- Unhealthy air days in 30 yrs
- 4 days/yr
Risk factors via First Street. Map © Google.
Why this score? — see what drove the B+ grade
The composite is a weighted blend of 9 inputs, each scored 0–100. Each bar is that input's sub-score; the figure is the points it added to the 100-point composite (weight × sub-score).
- Cash flow +30.0/30.0
- ARV discount +15.0/15.0
- 1% rule +10.0/10.0
- DSCR +10.0/10.0
- Livability +4.2/5.0
- Schools +3.0/10.0
- Rent growth +2.9/5.0
- Condition / age +2.5/5.0
- Appreciation +0.0/10.0
$249,900
🖨 Deal sheet 📄 Offer letter ✓ Due diligence
Multi-family units
County records classify this as Multi-Family (2-4 Unit). Listing-text estimate: 2 units. confirmed
Listing remarks
Lovely 2 Family on a dead end street. 1st floor offers living room dining room and eat in kitchen 2 Bedrooms and full bath. 2nd floor is living room dining room and eat in kitchen with full bath. Porches in front and rear! Walk Up attic for future expansion. Units have separate utilities . Detached 2 car garage. Home is in as is condition. Will not pass government financing !!!. cash offers preferred!!!
Key facts
- Separate utilities
- Walk up attic
- Eat in kitchen
Tags
Property features AI
Exterior
- Parking: Detached garage; Paved parking; 4 total parking spaces; 2-car garage
- Utilities: Public water connected; Public sewer connected; Natural gas hot water (30-gallon tank)
- Home design: Multi-family (2-family) property
- Construction: Frame construction; Concrete foundation; Asphalt shingle roof
- Exterior features: Lightly wooded lot; White exterior siding
Interior
- Bedrooms: 4 bedrooms
- Bathrooms: 2 full bathrooms
- Heating & cooling: Hot air heating; Natural gas heat
- Interior features: 10 total rooms; Full basement; Walk-up attic
Neighborhood map
What this means for you Summary
Snapshot
- This is a 2 × 2-bed/1.0-bath units multifamily listed at $250k.
Deal economics
- At list price, monthly cash flow is $1k ($14k/yr) — positive. Per door: $593/mo.
- The deal already cash-flows at list — no discount required.
- Meets the 1% rule at list price ($4k rent vs $250k).
- Cap rate 12.3% vs local median 4.2% in Meriden — top-decile yield for the area; either an underpriced asset or a hidden risk that comps aren't pricing in. Stress-test before assuming the spread holds.
Location & tenants
- Location reads 85/100 on livability (#4 in CT, #505 nationally) — a professional / high-income tenant draw. Strengths: amenities A+, housing A+, health & safety A+.
- Meriden School District (suburban): math 27% / reading 41% proficiency, ranked #116 of 153 in CT (top 76%) — families likely to look elsewhere, expect single-tenant / working-renter base with shorter leases; 61% free/reduced lunch — lower-income household profile, screen leases tightly.
- Market conditions: Rents rising (+1.6%/yr); 98 active listings in the ZIP; 10 comparable units currently listed for rent nearby; rentals at typical pace (median 23d on market — plan ~3-4 weeks tenant-placement turnaround); 40% of comp listings sitting > 30 days — soft ceiling on asking rent; 1,059 units permitted in South Central Connecticut Planning Region in 2024 (779 in 5+ unit buildings).
- At $3,870/mo this rent would consume 65% of the median local household income ($71k/yr) (locally 1516% of renters already pay >50% of income on rent) — very limited rent-growth headroom before tenants either downsize or default.
Forward outlook
- Local home prices are declining (-3.0%/yr); year-one equity from $2k of loan paydown is wiped out by about $7k of value loss. Plan a longer hold.
- At projected returns (-3.0% appreciation + 1.6% rent growth), your $70k cash investment doubles in ~7 years — after that, you're playing with house money.
Negotiation context
- Only 2 days on market — expect competitive offers; lowballing is unlikely to land.
Risks & watch-outs
- Watch-outs: flood insurance adds $56/mo; built in 1900 — expect roof / HVAC / electrical / plumbing capex.
- Climate carrying-cost: major flood risk; major wind risk, 27% chance of damaging wind over 30y; extreme-heat days projected 7→17/yr by 2055 (HVAC capex compounding) — expect insurance premiums to compound above CPI over the hold.
Questions for the listing agent
- Can we see the unit-by-unit rent roll, current vacancy, and any below-market leases? What's the average tenancy length?
- What capital expenditures (roof, boiler, parking lot, exteriors) have been made in the last 5 years, and what's planned in the next 2?
- Built in 1900 — when were the roof, HVAC, electrical panel, plumbing, and water heater last replaced?
- What's the actual annual flood-insurance premium (NFIP or private), and is the property in a SFHA with mandatory coverage?
- Is there a deadline driving the sale (1031 exchange, divorce, estate, relocation)? That informs how much negotiation room exists.
- What's the average days-on-market for RENTAL listings here right now (not sales)? A rising rental-DOM trend means longer vacancies and softer asking-rent achievability than the comps imply.
- What's the recent tenant-quality profile in this submarket — average credit score on applications, eviction rate, late-payment / NSF rate, and stable-employment percentage? A property-management company in the area should have these aggregated.
- How much new apartment / multifamily construction is in the pipeline within 1–3 miles? Heavy new supply (>2% of stock underway) typically softens rents 12–24 months out; light construction supports rent growth.
Investment metrics
- 1% rule
- 1.55% ✓
- Cap rate
- 12.25%
- Cash-on-cash
- 21.28%
- DSCR
- 1.95
- GRM
- 5.4
CMA / ARV
- ARV (on-the-fly)
- $375,648
- Comps found
- 5
Show comp detail 5 sales within ~0.75 mi
| Address | Dist | Beds/Ba | Sqft | Sold | Price | $/sf | Match |
|---|---|---|---|---|---|---|---|
| 85 Hicks St | 0.00mi | 4/2.0 | 2,184 (0%) | 0mo | $260,000 | $119 | 100 |
| 52 Webster St | 0.42mi | 4/2.0 | 2,063 (-6%) | 5mo | $420,000 | $204 | 67 |
| 110 Wilcox Ave | 0.38mi | 4/2.0 | 1,974 (-10%) | 9mo | $405,000 | $205 | 59 |
| 82 Woodland St | 0.38mi | 5/3.0 (+1) | 1,980 (-9%) | 9mo | $340,000 | $172 | 50 |
| 125 Bailey Ave | 0.70mi | 4/2.0 | 2,464 (+13%) | 21mo | $350,000 | $142 | 28 |
Match score weights: distance 35% · size 25% · config 20% · recency 20%. Top-matched comps best support the ARV.
Projected returns pro-forma
-3.0% appreciation · 1.65% rent growth · sell at horizon
- IRR
- 11.0%
- Equity multiple
- 1.43×
- Total profit
- $29,953
- Equity at exit
- $37,261
- IRR
- 18.9%
- Equity multiple
- 2.47×
- Total profit
- $103,168
- Equity at exit
- $21,607
Cash invested: $69,972 (down + closing). Projections, not guarantees.
Landlord ↔ Tenant lean methodology
- Overall (STATE)
- 27 Tenant-Leaning
- State Connecticut
- 27 Tenant-Leaning · D+7
- County
- — inherits STATE
- City
- — inherits STATE
ZIP-level market 06450
- Rents YoY
- 1.6%
- Active inventory
- 98
- Price-to-rent
- 10.8×
Monthly cashflow live
- Estimated rent
- $3,870 high interval (Pro) →
- Mortgage (P&I)
- −$1,311
- Tax from tax record
- −$402 /mo · $4,823/yr
- Insurance
- −$104
- Flood insurance flood zone
- −$56 /mo · $666/yr
- HOA
- −$0
- Vacancy / Maint / Mgmt
- −$813
- Net cashflow
- $1,185
Break-even live
2-unit breakdown (identical units grouped — click to expand)
| Units | Beds | Baths | Est. rent |
|---|---|---|---|
| 2× units | 2 | 1 | $3,870 |
| #1 | 2 | 1 | $1,935 |
| #2 | 2 | 1 | $1,935 |
| Total (2 units) | $3,870 | ||
UW: 25.0% down · 7.5% · 30yr · 1.5% tax · 5.0% vac · 8.0% maint · 8.0% mgmt
Financing live
Cash to close
- Down payment
- $62,475
- Closing costs
- $7,497
- Reserves months
- —
- Total cash needed
- —
Loan-product check · same deal, 3 products live
Conventional
25% down · 7.5% · 30yr
- Down + closing
- —
- Monthly P&I
- —
- Monthly cashflow
- —
- DSCR
- —
- Eligible?
- —
Personal DTI + credit; lowest rate.
DSCR
20% down · 8.5% · 30yr
- Down + closing
- —
- Monthly P&I
- —
- Monthly cashflow
- —
- DSCR
- —
- Eligible?
- —
No personal income docs; deal must DSCR.
Hard money
10% down · 12.0% · 12mo
- Down + closing
- —
- Monthly P&I
- —
- Monthly cashflow
- —
- DSCR
- —
- Eligible?
- —
Short-term bridge; refi at stabilization.
Rent comps 10 comps
| Address | Beds | Baths | Sqft | Rent | $/sqft | DOM | Units | Dist |
|---|---|---|---|---|---|---|---|---|
| 25 Amity St Meriden, CT | 3.0 | 1.5 | 1776 | $2,500 | $1.41 | 23d | 1 | 0.44mi |
| 75 Wilcox Ave Meriden, CT | 4.0 | 1.0 | 1763 | $2,350 | $1.33 | 43d | 1 | 0.45mi |
| 58 Leonard St #204 Meriden, CT | 4.0 | 3.5 | 2535 | $3,500 | $1.38 | 43d | 1 | 0.66mi |
| 200 Sams Rd Meriden, CT | 2.0–3.0 | 1.5–2.5 | 855 | $2,700 | $3.16 | 1d | 4 | 0.82mi |
| 6 Springdale Ave Unit 6A Meriden, CT | 3.0 | 1.0 | 2692 | $2,000 | $0.74 | 43d | 1 | 1.10mi |
| 39 N Spring St Unit 2 Meriden, CT | 3.0 | 1.0 | 1650 | $2,400 | $1.45 | 43d | 1 | 1.12mi |
| 48 Prospect St Unit 1st floor Meriden, CT | 3.0 | 1.0 | 2292 | $2,000 | $0.87 | 23d | 1 | 1.19mi |
| 1 Barristers Ct Unit 2nd Flr Meriden, CT | 3.0 | 1.0 | 1512 | $2,200 | $1.46 | 23d | 1 | 1.21mi |
| 55 Liberty St Meriden, CT | 5.0 | 3.0 | 2215 | $2,900 | $1.31 | 3d | 1 | 1.21mi |
| 11 Nutmeg Dr Meriden, CT | 2.0–3.0 | 1.5–2.5 | 1600 | $2,600 | $1.62 | 1d | 4 | 1.45mi |
Listing history 2 events
-
2026-05-06status Under Contract
-
2026-05-04$249,900 Active
ⓘ Source: listings_history table (triggers on properties + properties_extension) + one-shot
backfill from property_details.listing_events for pre-trigger history.
Tax reassessment forecast CT · Partial reset (capped growth)
- Current annual tax
- $4,823 · $402/mo
- Projected year-2 tax
- $5,085 · $424/mo
- Expected delta
- +$262/yr (+$22/mo · 5.4%)
ⓘ Screening estimate from a state-policy table — verify with the county assessor before closing.
Climate risk First Street
- Flood 7/10 Severe FEMA zone X (unshaded) · 77% chance over 30 yrs
- Wildfire 1/10 Low
- Heat 6/10 Major 7 d/yr ≥98°F today · 17 d/yr by 30 yrs out
- Wind 6/10 Major 27% chance of damaging wind over 30 yrs
- Air quality 3/10 Moderate 3 unhealthy d/yr today · 4 by 30 yrs out
Nearby sold comps map
Loading sold comps map…
Walkable amenities ~0.75 mi
Loading nearby amenities…
Taxation est. · year 1
- Rental income
- $46,440
- − Mortgage interest
- −$13,998
- − Property taxes
- −$4,823
- − Insurance
- −$1,916
- − Repairs & maintenance
- −$3,715
- − Management
- −$3,715
- − Depreciation
- −$7,270
- Taxable income
- $11,002
- Est. tax owed @ 24.0%
- −$2,641
- After-tax cash flow
- $11,582/yr
For passive investors: Depreciation is non-cash, so a rental often shows a tax loss while cash-flowing — sheltering income. Rental losses are passive: they offset passive income freely, and up to $25,000/yr can offset ordinary (W-2) income if you actively participate and your MAGI is under $100k (phasing out to $0 by $150k); unused losses carry forward. On sale, claimed depreciation is recaptured at up to 25%, and gains may owe capital-gains tax (a 1031 exchange can defer both). Figures are a year-1 estimate at your 24.0% rate — not tax advice; consult a CPA.
Schools (NCES district)
- District
- Meriden School District
- NCES district ID
- 0902400
- Math proficiency
- 27% ▼ -8.00%
- Reading proficiency
- 41% ▼ -6.00%
- Median HH income
- $53,883
- Composite
- 29.84/100
- National rank
- #6413
- State rank
- #116 of 153 in CT
Livability — Meriden
- Score
- 85/100
- State rank
- #4
- US rank
- #505
Category grades
Schools grade is shown separately in the Schools card above.
Census & demographics
- Census place
- Meriden, CT
- County
- New Haven County · 688,236 people
- City population
- 60,545
- Metro
- New Haven-Milford, CT
- Population (ZIP)
- 35,694
- Household income
- $71,250
- Rent vs Own
- Severe rent burden
- 1516.0
Population outlook (South Central Connecticut County) Hauer SSP2
- By 2040
- 608,362
Race, ethnicity, and origin ACS 2023
- Neighborhood character
- Diverse neighborhood (Simpson 0.60)
- Race & ethnicity
- White 51% Hispanic / Latino 36% Two or more races 16% Black 7% Asian 3%
- Hispanic origin (detail)
- Mexican 6% Puerto Rican 23% Dominican 3%
- Common ancestry
- Romanian 8% Lithuanian 4% Scotch-Irish 2%
- Foreign-born
- 10% · Canada, China, South Korea
- Languages at home
- 70% English-only · Spanish 25% Russian/Polish/Slavic 1% Other Indo-European 1%
Political lean MEDSL · South Central Connecticut
- 2024 margin
- Strong D (+20.1) · D 59.0% · R 38.9% · Other 2.1%
- All cycles
- 2024: D+20.1
Not yet ingested
- Civics
- —
Market trends
- HPI YoY
- ▼ -154.37%
- Current HPI
- 263.7288
- Rent YoY
- ▲ 1.65%
- Metro
- New Haven-Milford, CT
- State GDP YoY
- ▲ 1.06%
- F500 in state
- 38
Industry mix (Fortune 500 HQ in CT)
| Industry | F500 HQs | Revenue |
|---|---|---|
| Industrial Machinery | 4 | $38B |
|
||
| Insurance | 3 | $71B |
|
||
| Financial Services | 2 | $25B |
|
||
| Transportation / Logistics | 2 | $18B |
|
||
| Healthcare | 1 | $247B |
|
||
| Telecommunications | 1 | $55B |
|
||
Price history
2 events — show timeline
- 2026-05-06 Pending — Smart MLS
- 2026-05-04 Listed $249,900 Smart MLS
Property tax history
-0.1%/yrLatest (2023): $4,823 · +6.0% YoY. Source: county tax records.
Cash-flow waterfall
monthlySold comps — $/sqft
last 12 mo · ≤1 miLoading sold comps…