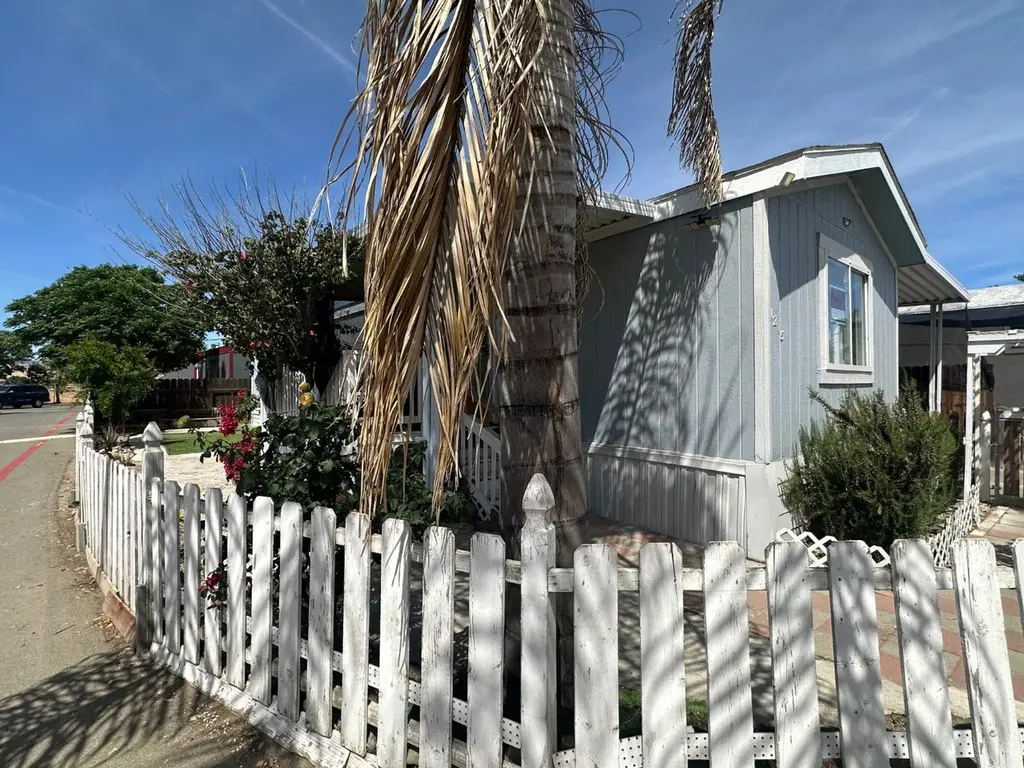
1215 Michelle Way #32 · Coalinga, CA
Flood risk 4/10 · Minor
- FEMA flood zone
- X (shaded)
- Chance of flooding over 30 yrs
- 0.22%
- Est. flood insurance / yr
- $507 – $1,088
Fire risk 8/10 · Major
- Est. fire insurance / yr
- $659 – $1,223
Heat risk 8/10 · Major
- Hot days now (above 106°F)
- 5 days/yr
- Hot days in 30 yrs
- 11 days/yr
Wind risk 1/10 · Minimal
- Chance of severe wind over 30 yrs
- —
Air-quality risk 10/10 · Severe
- Unhealthy air days now
- 23 days/yr
- Unhealthy air days in 30 yrs
- 24 days/yr
Risk factors via First Street. Map © Google.
Why this score? — see what drove the B- grade
The composite is a weighted blend of 9 inputs, each scored 0–100. Each bar is that input's sub-score; the figure is the points it added to the 100-point composite (weight × sub-score).
- Cash flow +30.0/30.0
- 1% rule +10.0/10.0
- DSCR +10.0/10.0
- ARV discount +7.0/15.0
- Condition / age +4.0/5.0
- Livability +2.7/5.0
- Rent growth +2.5/5.0
- Schools +2.3/10.0
- Appreciation +0.0/10.0
$45,000
🖨 Deal sheet 📄 Offer letter ✓ Due diligence
Listing remarks MLS
Price to sell !! Located in Coalinga CA. Short distance to the park, shools and freeway. This special single wide mobile features 2 extra large bedrooms and two bathrooms. Call a REALTOR today for your private showing.
Key facts
- Built 1991
- Listed 48 days
Property features AI
Exterior
- Parking: Carport
- Utilities: Electric service on; Public sewer; Public utilities
- Home design: Manufactured home; Mobile home (Make: 2602A)
- Construction: Composition roof; Wood and metal siding; Wood subfloor foundation
- Exterior features: One-level; Composition roof; Wood siding and metal siding; Wood subfloor foundation; Urban lot setting; Park space rented
Interior
- Bathrooms: 2 bathrooms
- Heating & cooling: Central heating and cooling
- Interior features: Laundry located inside; Central heat and air conditioning
- Laundry & utility: Indoor laundry
Neighborhood map
What this means for you Summary
Snapshot
- This is a 2-bed/2.0-bath manufactured listed at $45k. Condition is rated good.
Deal economics
- At list price, monthly cash flow is $609 ($7k/yr) — positive.
- The deal already cash-flows at list — no discount required.
- Meets the 1% rule at list price ($1k rent vs $45k).
- Recommended offer: $44k (3.0% below list) — sets the bar for market timing.
- Cap rate 22.5% vs local median 3.9% in Coalinga — top-decile yield for the area; either an underpriced asset or a hidden risk that comps aren't pricing in. Stress-test before assuming the spread holds.
Location & tenants
- Location reads 53/100 on livability (#946 in CA) — a working-class tenant base; expect higher turnover. Strengths: housing A+; Watch: cost of living D+, amenities F, commute F.
- Coalinga-Huron Unified (town): math 14% / reading 40% proficiency, ranked #384 of 517 in CA (top 74%) — low school quality limits family demand, transient renter base, plan for 1-2y turnover; 73% free/reduced lunch — lower-income household profile, screen leases tightly.
- Zoned schools: Annie E. Cheney Kindergarten (61 students, 80% FRL); Coalinga Middle (684 students, 84% FRL); Coalinga High (math 17% / reading 42%, grade F, #750 of 1,170 statewide, top 66%, 1,266 students, 89% FRL).
- Market conditions: 76 active listings in the ZIP; 4 comparable units currently listed for rent nearby; rentals leasing fast (median 12d on market — plan ~1-2 weeks tenant-placement turnaround); 2,426 units permitted in Fresno County in 2024 (296 in 5+ unit buildings).
Forward outlook
- Local home prices are declining (-3.0%/yr); year-one equity from $311 of loan paydown is wiped out by about $1k of value loss. Plan a longer hold.
- Fresno County population projected at +11% by 2050 — modest demand growth; plan on rents tracking national, not racing it.
- At projected returns (-3.0% appreciation + 3.0% rent growth), your $13k cash investment doubles in ~2 years — after that, you're playing with house money.
Negotiation context
- It's been on market 49 days — a 3% lower offer ($44k) is reasonable based on typical stale-listing flexibility.
- 2 sale attempts since 2y ago with the ask held roughly flat each time — persistent listings suggest the price (not the market) is what's stuck; bring a comps-based counter.
Risks & watch-outs
- Climate carrying-cost: severe wildfire risk; extreme-heat days projected 5→11/yr by 2055 (HVAC capex compounding) — expect insurance premiums to compound above CPI over the hold.
Questions for the listing agent
- It's been on market 49 days. Have you received any prior offers? Is the seller open to a 3% concession, seller financing, or rate buy-down credit?
- Is there a deadline driving the sale (1031 exchange, divorce, estate, relocation)? That informs how much negotiation room exists.
- Schools are F-rated, which usually means shorter tenancies and higher turnover. Who's the typical renter profile here, and what's been the actual vacancy rate?
- What's the average days-on-market for RENTAL listings here right now (not sales)? A rising rental-DOM trend means longer vacancies and softer asking-rent achievability than the comps imply.
- What's the recent tenant-quality profile in this submarket — average credit score on applications, eviction rate, late-payment / NSF rate, and stable-employment percentage? A property-management company in the area should have these aggregated.
- How much new for-sale + rental construction is in the pipeline within 1–3 miles? Heavy new supply typically softens prices + rents 12–24 months out; constrained supply supports both.
Investment metrics
- 1% rule
- 2.59% ✓
- Cap rate
- 22.52%
- Cash-on-cash
- 57.95%
- DSCR
- 3.58
- GRM
- 3.2
CMA / ARV
- ARV (on-the-fly)
- $44,550
- Comps found
- 2
Show comp detail 2 sales within ~0.75 mi
| Address | Dist | Beds/Ba | Sqft | Sold | Price | $/sf | Match |
|---|---|---|---|---|---|---|---|
| 599 Childers | 0.71mi | 2/1.0 | 802 (-1%) | 20mo | $44,000 | $55 | 44 |
| 520 Sullivan St #27 | 0.69mi | 3/1.0 (+1) | 862 (+6%) | 15mo | $10,000 | $12 | 36 |
Match score weights: distance 35% · size 25% · config 20% · recency 20%. Top-matched comps best support the ARV.
Projected returns pro-forma
-3.0% appreciation · 3.0% rent growth · sell at horizon
- IRR
- 56.5%
- Equity multiple
- 3.50×
- Total profit
- $31,483
- Equity at exit
- $6,710
- IRR
- 61.5%
- Equity multiple
- 7.14×
- Total profit
- $77,392
- Equity at exit
- $3,891
Cash invested: $12,600 (down + closing). Projections, not guarantees.
Landlord ↔ Tenant lean methodology
- Overall (STATE)
- 18 Strongly Tenant-Friendly
- State California
- 18 Strongly Tenant-Friendly · D+13
- County
- — inherits STATE
- City
- — inherits STATE
ZIP-level market 93210
- Home prices YoY
- -11.7%
- Active inventory
- 76
- Price-to-rent
- 3.2×
Monthly cashflow live
- Estimated rent
- $1,164 medium interval (Pro) →
- Mortgage (P&I)
- −$236
- Tax est. 1.5%
- −$56 /mo · $675/yr
- Insurance
- −$19
- HOA
- −$0
- Vacancy / Maint / Mgmt
- −$244
- Net cashflow
- $609
Break-even live
UW: 25.0% down · 7.5% · 30yr · 1.5% tax · 5.0% vac · 8.0% maint · 8.0% mgmt
Financing live
Cash to close
- Down payment
- $11,250
- Closing costs
- $1,350
- Reserves months
- —
- Total cash needed
- —
Loan-product check · same deal, 3 products live
Conventional
25% down · 7.5% · 30yr
- Down + closing
- —
- Monthly P&I
- —
- Monthly cashflow
- —
- DSCR
- —
- Eligible?
- —
Personal DTI + credit; lowest rate.
DSCR
20% down · 8.5% · 30yr
- Down + closing
- —
- Monthly P&I
- —
- Monthly cashflow
- —
- DSCR
- —
- Eligible?
- —
No personal income docs; deal must DSCR.
Hard money
10% down · 12.0% · 12mo
- Down + closing
- —
- Monthly P&I
- —
- Monthly cashflow
- —
- DSCR
- —
- Eligible?
- —
Short-term bridge; refi at stabilization.
Rent comps 4 comps
| Address | Beds | Baths | Sqft | Rent | $/sqft | DOM | Units | Dist |
|---|---|---|---|---|---|---|---|---|
| 250 Truman St Coalinga, CA | 2.0 | 1.0–2.0 | 867 | $1,162 | $1.34 | 2d | 5 | 0.64mi |
| 720 E Elm Ave Unit D Coalinga, CA | 3.0 | 2.0 | 1100 | $1,245 | $1.13 | 11d | 1 | 0.66mi |
| 760 E Elm Ave Unit A Coalinga, CA | 2.0 | 1.0 | 800 | $1,095 | $1.37 | 16d | 1 | 0.66mi |
| 546 E Polk St Unit 546 Coalinga, CA | 2.0 | 1.0 | 896 | $1,275 | $1.42 | 10d | 1 | 1.00mi |
Listing history 20 events
-
2026-06-19days on market $45,000 Active 49 DOM
-
2026-06-18days on market $45,000 Active 48 DOM
-
2026-06-17days on market $45,000 Active 47 DOM
-
2026-06-16days on market $45,000 Active 46 DOM
-
2026-06-15days on market $45,000 Active 45 DOM
-
2026-06-14days on market $45,000 Active 43 DOM
-
2026-06-13days on market $45,000 Active 42 DOM
-
2026-06-10days on market $45,000 Active 40 DOM
-
2026-06-09days on market $45,000 Active 39 DOM
-
2026-06-08days on market $45,000 Active 38 DOM
-
2026-06-07days on market $45,000 Active 37 DOM
-
2026-06-02days on market $45,000 Active 32 DOM
-
2026-06-01days on market $45,000 Active 31 DOM
-
2026-05-31days on market $45,000 Active 30 DOM
-
2026-05-30days on market $45,000 Active 29 DOM
-
2026-04-30$45,000 Active 217-char remark
-
2024-11-03status Pending 218-char remark
Show marketing remark (218 chars)
Price to sell !! Located in Coalinga CA. Short distance to the park, shools and freeway. This special single wide mobile features 2 extra large bedrooms and two bathrooms. Call a REALTOR today for your private showing.
-
2024-10-31soldstatus $48,000 Closed 218-char remark
Show marketing remark (218 chars)
Price to sell !! Located in Coalinga CA. Short distance to the park, shools and freeway. This special single wide mobile features 2 extra large bedrooms and two bathrooms. Call a REALTOR today for your private showing.
-
2024-09-25price $49,000 218-char remark
Show marketing remark (218 chars)
Price to sell !! Located in Coalinga CA. Short distance to the park, shools and freeway. This special single wide mobile features 2 extra large bedrooms and two bathrooms. Call a REALTOR today for your private showing.
-
2024-09-11$58,000 Active 218-char remark
Show marketing remark (218 chars)
Price to sell !! Located in Coalinga CA. Short distance to the park, shools and freeway. This special single wide mobile features 2 extra large bedrooms and two bathrooms. Call a REALTOR today for your private showing.
ⓘ Source: listings_history table (triggers on properties + properties_extension) + one-shot
backfill from property_details.listing_events for pre-trigger history.
Climate risk First Street
- Flood 4/10 Moderate FEMA zone X (shaded) · 22% chance over 30 yrs
- Wildfire 8/10 Severe
- Heat 8/10 Severe 5 d/yr ≥106°F today · 11 d/yr by 30 yrs out
- Wind 1/10 Low
- Air quality 10/10 Extreme 23 unhealthy d/yr today · 24 by 30 yrs out
Nearby sold comps map
Loading sold comps map…
Walkable amenities ~0.75 mi
Loading nearby amenities…
Taxation est. · year 1
- Rental income
- $13,967
- − Mortgage interest
- −$2,521
- − Property taxes
- −$675
- − Insurance
- −$225
- − Repairs & maintenance
- −$1,117
- − Management
- −$1,117
- − Depreciation
- −$1,309
- Taxable income
- $7,003
- Est. tax owed @ 24.0%
- −$1,681
- After-tax cash flow
- $5,622/yr
For passive investors: Depreciation is non-cash, so a rental often shows a tax loss while cash-flowing — sheltering income. Rental losses are passive: they offset passive income freely, and up to $25,000/yr can offset ordinary (W-2) income if you actively participate and your MAGI is under $100k (phasing out to $0 by $150k); unused losses carry forward. On sale, claimed depreciation is recaptured at up to 25%, and gains may owe capital-gains tax (a 1031 exchange can defer both). Figures are a year-1 estimate at your 24.0% rate — not tax advice; consult a CPA.
Condition & rehab AI · 12 photos
This recently updated mobile home in Coalinga, CA, offers two spacious bedrooms, two updated bathrooms, and a well-maintained exterior. It is move-in ready and presents a good investment opportunity.
Value-add opportunities
- Both Painting the exterior and interior walls — Fresh paint can enhance curb appeal and interior aesthetics
- Both Updating the kitchen backsplash — A new backsplash can modernize the kitchen and add value
- Both Upgrading the flooring in the bathrooms — New flooring can improve the look and feel of the bathrooms
Renovation cost estimate screening
Value-add ROI direction
- Both Painting the exterior and interior walls — Fresh paint can enhance curb appeal and interior aesthetics ↑
- Both Updating the kitchen backsplash — A new backsplash can modernize the kitchen and add value ↑
- Both Upgrading the flooring in the bathrooms — New flooring can improve the look and feel of the bathrooms ↑
ⓘ Cost ranges are severity-bucket heuristics (US national rule-of-thumb). Get contractor quotes + a written scope before underwriting a rehab budget.
Schools (NCES district)
- District
- Coalinga-Huron Unified
- NCES district ID
- 0609120
- Math proficiency
- 14% ▼ -3.00%
- Reading proficiency
- 40% ▲ 10.00%
- Median HH income
- $40,366
- Composite
- 22.69/100
- National rank
- #8040
- State rank
- #384 of 517 in CA
Livability — Coalinga
- Score
- 53/100
- State rank
- #946
- US rank
- #24409
Category grades
Schools grade is shown separately in the Schools card above.
Census & demographics
- Census place
- Coalinga, CA
- County
- Fresno County · 834,801 people
- City population
- 18,491
- Metro
- Fresno, CA
- Population (ZIP)
- 18,491
- Household income
- $74,817
- Rent vs Own
- Severe rent burden
- 336.0
Population outlook (Fresno County) Hauer SSP2
- Today (2025)
- 1,042,971 people
- By 2030
- 1,072,198 · +2.8%
- By 2040
- 1,122,408 · +7.6%
- By 2050
- 1,157,251 · +11.0%
- By 2075
- 1,182,575 · +13.4%
- By 2100
- 1,105,899 · +6.0%
Race, ethnicity, and origin ACS 2023
- Neighborhood character
- Predominantly Hispanic (66%)
- Race & ethnicity
- Hispanic / Latino 66% White 24% Two or more races 18% Black 4% Asian 3% Native American 2%
- Hispanic origin (detail)
- Mexican 59% Puerto Rican 1%
- Common ancestry
- Lithuanian 2% Italian 1% Slovak 1%
- Foreign-born
- 22% · Canada
- Languages at home
- 47% English-only · Spanish 50% Other Asian/Pacific 1% Tagalog/Filipino 1%
Political lean MEDSL · Fresno
- 2024 margin
- Toss-up / Even · D 46.5% · R 50.9% · Other 2.6%
- 2008→2024 swing
- -6.5pp toward R · 2008: 2.1pp · 2024: -4.4pp
- All cycles
- 2024: R+4.4 2020: D+7.8 2016: D+3.9 2012: R+2.9 2008: D+2.1
Not yet ingested
- Civics
- —
Market trends
- HPI YoY
- ▼ -39.35%
- Current HPI
- 296.6031
- Rent YoY
- —
- Metro
- Fresno, CA
- State GDP YoY
- ▲ 3.21%
- F500 in state
- 116
Industry mix (Fortune 500 HQ in CA)
| Industry | F500 HQs | Revenue |
|---|---|---|
| Technology | 27 | $1,492B |
|
||
| Financial Services | 3 | $174B |
|
||
| Retail | 3 | $44B |
|
||
| Insurance | 3 | $26B |
|
||
| Media / Entertainment | 2 | $115B |
|
||
| Pharmaceuticals / Biotech | 2 | $62B |
|
||
Price history
-22.4% since first listed5 events — show timeline
- 2026-04-30 Listed $45,000 FRESNOMLS
- 2024-11-03 Pending — FRESNOMLS
- 2024-10-31 Sold (MLS) $48,000 FRESNOMLS
- 2024-09-25 Price Changed $49,000 FRESNOMLS
- 2024-09-11 Listed $58,000 FRESNOMLS
Cash-flow waterfall
monthlySold comps — $/sqft
last 12 mo · ≤1 miLoading sold comps…