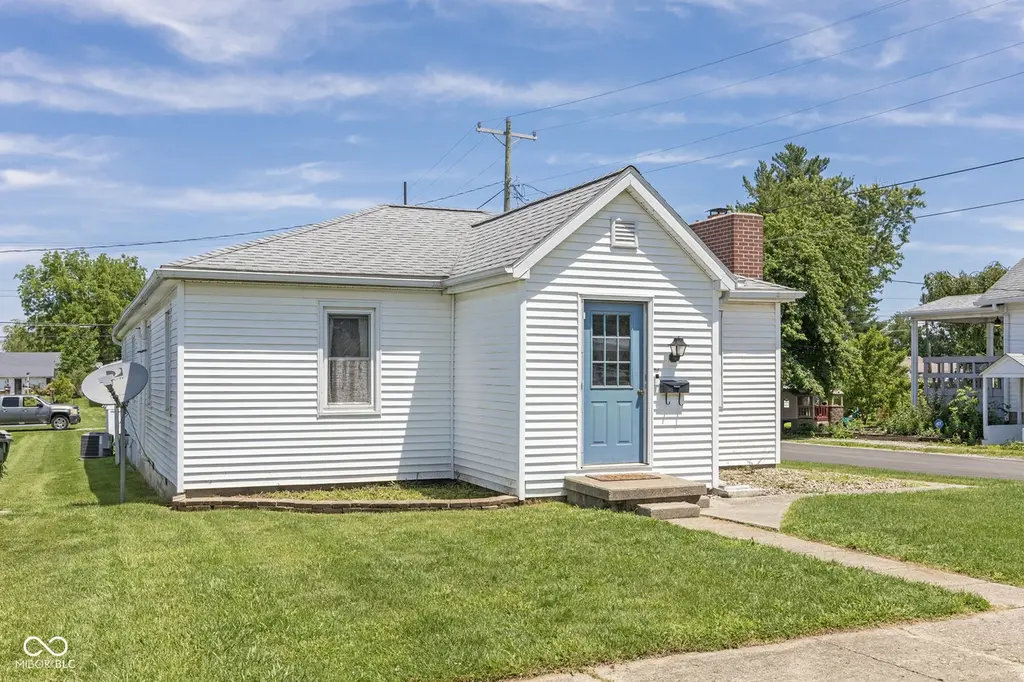
202 W 2nd St · Greensburg, IN
Flood risk 1/10 · Minimal
- FEMA flood zone
- X (unshaded)
- Chance of flooding over 30 yrs
- 0.0%
- Est. flood insurance / yr
- $507 – $1,088
Fire risk 1/10 · Minimal
- Est. fire insurance / yr
- $717 – $1,331
Heat risk 4/10 · Minor
- Hot days now (above 102°F)
- 7 days/yr
- Hot days in 30 yrs
- 19 days/yr
Wind risk 2/10 · Minimal
- Chance of severe wind over 30 yrs
- 1.0%
Air-quality risk 2/10 · Minimal
- Unhealthy air days now
- 1 days/yr
- Unhealthy air days in 30 yrs
- 2 days/yr
Risk factors via First Street. Map © Google.
Why this score? — see what drove the B grade
The composite is a weighted blend of 9 inputs, each scored 0–100. Each bar is that input's sub-score; the figure is the points it added to the 100-point composite (weight × sub-score).
- Cash flow +30.0/30.0
- ARV discount +10.2/15.0
- DSCR +10.0/10.0
- 1% rule +8.8/10.0
- Schools +3.8/10.0
- Livability +3.5/5.0
- Rent growth +2.5/5.0
- Condition / age +2.5/5.0
- Appreciation +0.0/10.0
$199,500
🖨 Deal sheet 📄 Offer letter ✓ Due diligence
Listing remarks MLS
Extremely well maintained home located on a corner lot. Large living room w/ WB fireplace adjoins ample sized dining area. Kitchen is fully equipped and has room for dining table. 3 bedrooms, master features 1/2 bath. Additional full bath w/ tub/shower combo. Separate laundry room, oversized 1 car attached garage w/ loads of room for storage. Vinyl tilt windows, central heat/air. Immediate possession.
Key facts
- Attached garage
- Great location
- Storage shed
Tags
Property features AI
Exterior
- Parking: Attached garage (1 car); Guest street parking
- Utilities: Public water; Municipal sewer connection; Cable available
- Home design: Single-family residence; One story
- Construction: Vinyl siding; Block foundation
- Exterior features: Front porch; Corner lot with sidewalks
Interior
- Kitchen: Dishwasher; Disposal; Electric oven; Microwave hood; Refrigerator; Eat-in kitchen
- Bedrooms: Three bedrooms on the main level (sizes: 15x14; 13x9; 11x10)
- Bathrooms: One full bathroom; One half bathroom; Primary bath described as a half bath
- Interior features: Attic access; Eat-in kitchen; Smoke alarm; One fireplace in the living room
- Laundry & utility: Main level laundry; Electric water heater
Neighborhood map
What this means for you Summary
Snapshot
- This is a 3-bed/1.5-bath single-family listed at $200k.
Deal economics
- At list price, monthly cash flow is $979 ($12k/yr) — positive.
- The deal already cash-flows at list — no discount required.
- Meets the 1% rule at list price ($3k rent vs $200k).
- Recommended offer: $197k (1.5% below list) — sets the bar for market timing.
- Cap rate 12.2% vs local median 5.9% in Greensburg — top-decile yield for the area; either an underpriced asset or a hidden risk that comps aren't pricing in. Stress-test before assuming the spread holds.
Location & tenants
- Location reads 69/100 on livability (#200 in IN) — a middle-class / working-renter tenant base. Strengths: cost of living A+, housing A+, crime B+; Watch: employment C-, amenities F, commute F.
- Greensburg Community Schools (town): math 38% / reading 51% proficiency, ranked #102 of 301 in IN (top 34%) — families likely to look elsewhere, expect single-tenant / working-renter base with shorter leases.
- Zoned schools: Greensburg Elementary (math 60% / reading 47%, grade C, #225 of 994 statewide, top 23%, 1,037 students, 55% FRL); Greensburg Community High School (math 27% / reading 67%, grade D-, #143 of 369 statewide, top 44%, 671 students, 44% FRL).
- Market conditions: 155 active listings in the ZIP; 5 comparable units currently listed for rent nearby; rentals at typical pace (median 15d on market — plan ~3-4 weeks tenant-placement turnaround); 66 units permitted in Decatur County in 2024 (0 in 5+ unit buildings).
Forward outlook
- Local home prices are declining (-3.0%/yr); year-one equity from $1k of loan paydown is wiped out by about $6k of value loss. Plan a longer hold.
- Decatur County population projected at +6% by 2050 — modest demand growth; plan on rents tracking national, not racing it.
- At projected returns (-3.0% appreciation + 3.0% rent growth), your $56k cash investment doubles in ~6 years — after that, you're playing with house money.
Negotiation context
- It's been on market 17 days — a 2% lower offer ($197k) is reasonable based on typical stale-listing flexibility.
- 3 sale attempts since 5y ago with the ask held roughly flat each time — persistent listings suggest the price (not the market) is what's stuck; bring a comps-based counter.
- Current owner paid $150k; 33% above their basis — modest negotiation headroom, anchor on the comps not their cost.
Risks & watch-outs
- Watch-outs: built in 1952 — expect roof / HVAC / electrical / plumbing capex.
Questions for the listing agent
- Built in 1952 — when were the roof, HVAC, electrical panel, plumbing, and water heater last replaced?
- Is there a deadline driving the sale (1031 exchange, divorce, estate, relocation)? That informs how much negotiation room exists.
- Schools are D-rated, which usually means shorter tenancies and higher turnover. Who's the typical renter profile here, and what's been the actual vacancy rate?
- What's the average days-on-market for RENTAL listings here right now (not sales)? A rising rental-DOM trend means longer vacancies and softer asking-rent achievability than the comps imply.
- What's the recent tenant-quality profile in this submarket — average credit score on applications, eviction rate, late-payment / NSF rate, and stable-employment percentage? A property-management company in the area should have these aggregated.
- How much new for-sale + rental construction is in the pipeline within 1–3 miles? Heavy new supply typically softens prices + rents 12–24 months out; constrained supply supports both.
Investment metrics
- 1% rule
- 1.38% ✓
- Cap rate
- 12.18%
- Cash-on-cash
- 21.02%
- DSCR
- 1.94
- GRM
- 6.0
CMA / ARV
- ARV (on-the-fly)
- $212,027
- Comps found
- 12
Show comp detail 12 sales within ~0.75 mi
| Address | Dist | Beds/Ba | Sqft | Sold | Price | $/sf | Match |
|---|---|---|---|---|---|---|---|
| 820 N Broadway St | 0.13mi | 3/1.5 | 1,472 (+3%) | 6mo | $224,000 | $152 | 83 |
| 210 W 5th St | 0.24mi | 4/2.0 (+1) | 1,492 (+5%) | 2mo | $228,000 | $153 | 72 |
| 304 W Shortridge Dr | 0.36mi | 3/1.0 | 1,475 (+4%) | 13mo | $195,000 | $132 | 64 |
| 420 N East St | 0.43mi | 3/2.0 | 1,477 (+4%) | 10mo | $212,000 | $144 | 64 |
| 402 W Washington St | 0.52mi | 3/1.0 | 1,328 (-7%) | 2mo | $170,000 | $128 | 61 |
| 513 W North St | 0.51mi | 3/2.0 | 1,500 (+5%) | 7mo | $230,000 | $153 | 59 |
| 328 N Carver St | 0.47mi | 3/2.0 | 1,340 (-6%) | 11mo | $200,000 | $149 | 58 |
| 633 W Sheridan St | 0.39mi | 3/1.0 | 1,249 (-12%) | 5mo | $112,000 | $90 | 55 |
| 705 N Davidson St | 0.73mi | 3/1.0 | 1,473 (+4%) | 11mo | $235,000 | $160 | 49 |
| 505 W Main St | 0.64mi | 2/1.0 (-1) | 1,248 (-12%) | 2mo | $85,000 | $68 | 41 |
| 904 N Hamilton Dr | 0.66mi | 2/2.0 (-1) | 1,587 (+12%) | 7mo | $249,000 | $157 | 37 |
| 905 N Hamilton Dr | 0.64mi | 2/1.0 (-1) | 1,608 (+13%) | 9mo | $235,000 | $146 | 34 |
Match score weights: distance 35% · size 25% · config 20% · recency 20%. Top-matched comps best support the ARV.
Projected returns pro-forma
-3.0% appreciation · 3.0% rent growth · sell at horizon
- IRR
- 13.4%
- Equity multiple
- 1.54×
- Total profit
- $29,939
- Equity at exit
- $29,746
- IRR
- 22.3%
- Equity multiple
- 2.90×
- Total profit
- $106,062
- Equity at exit
- $17,249
Cash invested: $55,860 (down + closing). Projections, not guarantees.
Landlord ↔ Tenant lean methodology
- Overall (STATE)
- 90 Strongly Landlord-Friendly
- State Indiana
- 90 Strongly Landlord-Friendly · R+11
- County
- — inherits STATE
- City
- — inherits STATE
ZIP-level market 47240
- Home prices YoY
- -25.0%
- Active inventory
- 155
- Price-to-rent
- 6.0×
Monthly cashflow live
- Estimated rent
- $2,760 high interval (Pro) →
- Mortgage (P&I)
- −$1,046
- Tax from tax record
- −$72 /mo · $868/yr
- Insurance
- −$83
- HOA
- −$0
- Vacancy / Maint / Mgmt
- −$580
- Net cashflow
- $979
Break-even live
UW: 25.0% down · 7.5% · 30yr · 1.5% tax · 5.0% vac · 8.0% maint · 8.0% mgmt
Financing live
Cash to close
- Down payment
- $49,875
- Closing costs
- $5,985
- Reserves months
- —
- Total cash needed
- —
Loan-product check · same deal, 3 products live
Conventional
25% down · 7.5% · 30yr
- Down + closing
- —
- Monthly P&I
- —
- Monthly cashflow
- —
- DSCR
- —
- Eligible?
- —
Personal DTI + credit; lowest rate.
DSCR
20% down · 8.5% · 30yr
- Down + closing
- —
- Monthly P&I
- —
- Monthly cashflow
- —
- DSCR
- —
- Eligible?
- —
No personal income docs; deal must DSCR.
Hard money
10% down · 12.0% · 12mo
- Down + closing
- —
- Monthly P&I
- —
- Monthly cashflow
- —
- DSCR
- —
- Eligible?
- —
Short-term bridge; refi at stabilization.
Rent comps 5 comps
| Address | Beds | Baths | Sqft | Rent | $/sqft | DOM | Units | Dist |
|---|---|---|---|---|---|---|---|---|
| 1011 N Anderson St Greensburg, IN | 3.0 | 2.5 | 1620 | $3,995 | $2.47 | 12d | 1 | 0.27mi |
| 2193 N Broadway St Greensburg, IN | 2.0 | 2.0 | 1013 | $1,324 | $1.31 | 14d | 1 | 0.89mi |
| 2303 N Broadway St Greensburg, IN | 2.0 | 2.0 | 1100 | $1,399 | $1.27 | 23d | 1 | 0.99mi |
| 1304 E Liberty Cir Greensburg, IN | 2.0 | 1.0 | 958 | $1,249 | $1.30 | 12d | 1 | 1.04mi |
| 1651 W Kole Dr Unit A Greensburg, IN | 3.0 | 2.0 | 1075 | $1,350 | $1.26 | 23d | 1 | 1.39mi |
Listing history 13 events
-
2026-06-18days on market $199,500 Active 17 DOM
-
2026-06-17days on market $199,500 Active 16 DOM
-
2026-06-16days on market $199,500 Active 15 DOM
-
2026-06-15days on market $199,500 Active 14 DOM
-
2026-06-13days on market $199,500 Active 12 DOM
-
2026-06-12days on market $199,500 Active 11 DOM
-
2026-06-09days on market $199,500 Active 8 DOM
-
2026-06-08days on market $199,500 Active 7 DOM
-
2026-06-07days on market $199,500 Active 6 DOM
-
2026-06-05days on market $199,500 Active 4 DOM
-
2026-06-04days on market $199,500 Active 2 DOM
-
2026-06-02remarks 467-char remark
-
2026-06-02$199,500 Active 1 DOM
ⓘ Source: listings_history table (triggers on properties + properties_extension) + one-shot
backfill from property_details.listing_events for pre-trigger history.
Tax reassessment forecast IN · Partial reset (capped growth)
- Current annual tax
- $868 · $72/mo
- Projected year-2 tax
- $1,282 · $107/mo
- Expected delta
- +$414/yr (+$34/mo · 47.7%)
ⓘ Screening estimate from a state-policy table — verify with the county assessor before closing.
Climate risk First Street
- Flood 1/10 Low FEMA zone X (unshaded) · 0% chance over 30 yrs
- Wildfire 1/10 Low
- Heat 4/10 Moderate 7 d/yr ≥102°F today · 19 d/yr by 30 yrs out
- Wind 2/10 Low 100% chance of damaging wind over 30 yrs
- Air quality 2/10 Low 1 unhealthy d/yr today · 2 by 30 yrs out
Nearby sold comps map
Loading sold comps map…
Walkable amenities ~0.75 mi
Loading nearby amenities…
Taxation est. · year 1
- Rental income
- $33,120
- − Mortgage interest
- −$11,175
- − Property taxes
- −$868
- − Insurance
- −$998
- − Repairs & maintenance
- −$2,650
- − Management
- −$2,650
- − Depreciation
- −$5,804
- Taxable income
- $8,976
- Est. tax owed @ 24.0%
- −$2,154
- After-tax cash flow
- $9,590/yr
For passive investors: Depreciation is non-cash, so a rental often shows a tax loss while cash-flowing — sheltering income. Rental losses are passive: they offset passive income freely, and up to $25,000/yr can offset ordinary (W-2) income if you actively participate and your MAGI is under $100k (phasing out to $0 by $150k); unused losses carry forward. On sale, claimed depreciation is recaptured at up to 25%, and gains may owe capital-gains tax (a 1031 exchange can defer both). Figures are a year-1 estimate at your 24.0% rate — not tax advice; consult a CPA.
Schools (NCES district)
- District
- Greensburg Community Schools
- NCES district ID
- 1804080
- Math proficiency
- 38% ▼ -7.00%
- Reading proficiency
- 51% ▼ -2.00%
- Median HH income
- $47,723
- Composite
- 37.96/100
- National rank
- #4301
- State rank
- #102 of 301 in IN
Livability — Greensburg
- Score
- 69/100
- State rank
- #200
- US rank
- #8922
Category grades
Schools grade is shown separately in the Schools card above.
Census & demographics
- Census place
- Greensburg, IN
- Population (ZIP)
- 21,514
Population outlook (Decatur County) Hauer SSP2
- Today (2025)
- 27,709 people
- By 2030
- 28,278 · +2.1%
- By 2040
- 29,195 · +5.4%
- By 2050
- 29,512 · +6.5%
- By 2075
- 29,835 · +7.7%
- By 2100
- 27,192 · -1.9%
Race, ethnicity, and origin ACS 2023
- Neighborhood character
- Predominantly White (93%)
- Race & ethnicity
- White 93% Two or more races 5% Hispanic / Latino 3%
- Common ancestry
- Slovak 2% Serbian 1% Romanian 1%
- Foreign-born
- 1% · Canada
- Languages at home
- 98% English-only · Spanish 2%
Political lean MEDSL · Decatur
- 2024 margin
- Solid R (+58.5) · D 19.9% · R 78.4% · Other 1.8%
- 2008→2024 swing
- -34.1pp toward R · 2008: -24.4pp · 2024: -58.5pp
- All cycles
- 2024: R+58.5 2020: R+58.1 2016: R+57.4 2012: R+40.5 2008: R+24.4
Not yet ingested
- Civics
- —
Market trends
- HPI YoY
- ▼ -70.13%
- Current HPI
- 210.3591
- Rent YoY
- —
- Metro
- —
- State GDP YoY
- ▲ 2.90%
- F500 in state
- 18
Industry mix (Fortune 500 HQ in IN)
| Industry | F500 HQs | Revenue |
|---|---|---|
| Industrial Machinery | 2 | $37B |
|
||
| Healthcare | 1 | $177B |
|
||
| Pharmaceuticals | 1 | $45B |
|
||
| Metals / Steel | 1 | $18B |
|
||
| Agriculture | 1 | $17B |
|
||
| Packaging | 1 | $12B |
|
||
Price history
+13.7% since first listed7 events — show timeline
- 2026-06-01 Listed $199,500 MIBOR as Distributed by MLS Grid
- 2021-12-21 Sold (MLS) $150,000 MIBOR as Distributed by MLS Grid
- 2021-11-19 Pending — MIBOR as Distributed by MLS Grid
- 2021-10-28 Listing Removed — MIBOR as Distributed by MLS Grid
- 2021-10-28 Listed $164,000 MIBOR as Distributed by MLS Grid
- 2021-10-04 Price Changed $169,000 MIBOR as Distributed by MLS Grid
- 2021-09-22 Listed $175,500 MIBOR as Distributed by MLS Grid
Property tax history
-6.4%/yrLatest (2023): $868 · +40.7% YoY. Source: county tax records.
Cash-flow waterfall
monthlySold comps — $/sqft
last 12 mo · ≤1 miLoading sold comps…