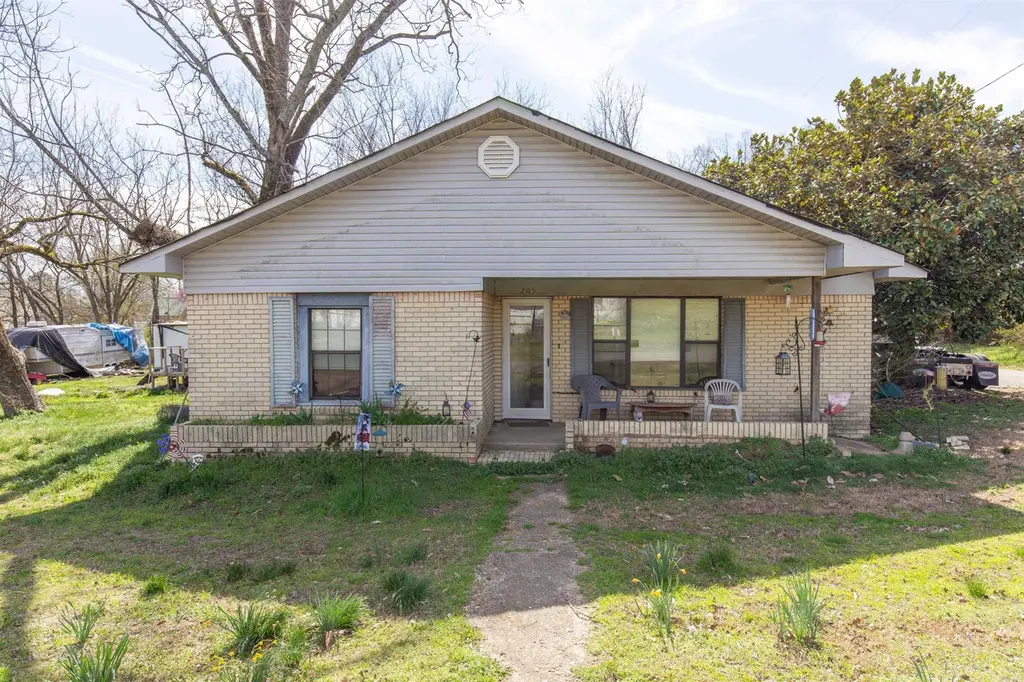
205 Highway 291 · Traskwood, AR
Flood risk 1/10 · Minimal
- FEMA flood zone
- X (unshaded)
- Chance of flooding over 30 yrs
- 0.0%
- Est. flood insurance / yr
- $507 – $1,088
Fire risk 7/10 · Major
- Est. fire insurance / yr
- $1,499 – $2,785
Heat risk 6/10 · Moderate
- Hot days now (above 111°F)
- 7 days/yr
- Hot days in 30 yrs
- 20 days/yr
Wind risk 4/10 · Minor
- Chance of severe wind over 30 yrs
- 12.0%
Air-quality risk 2/10 · Minimal
- Unhealthy air days now
- 0 days/yr
- Unhealthy air days in 30 yrs
- 1 days/yr
Risk factors via First Street. Map © Google.
Why this score? — see what drove the B+ grade
The composite is a weighted blend of 9 inputs, each scored 0–100. Each bar is that input's sub-score; the figure is the points it added to the 100-point composite (weight × sub-score).
- Cash flow +30.0/30.0
- 1% rule +10.0/10.0
- DSCR +10.0/10.0
- ARV discount +7.5/15.0
- Appreciation +7.2/10.0
- Schools +3.2/10.0
- Livability +2.9/5.0
- Rent growth +2.5/5.0
- Condition / age +2.5/5.0
$69,900
🖨 Deal sheet (PDF) 📄 Offer letter ✓ Due diligence
Listing remarks
Hello Investors! This is a great opportunity to purchase a fixer-upper that is spacious, with 4 bedrooms and 2 bathrooms. This home includes 1959 sq ft, and with some TLC has potential! This property is located in the Glen Rose School District. The HVAC is 6 years old and the hot water tank is 12 years old. PROPERTY IS SOLD "AS IS. " Second bathroom has the water shut off to it. Cash or conventional financing only. AGENTS PLEASE REVIEW REMARKS
Key facts
- Hvac is 6 years old
- Detached
- 0.49 acre lot
Tags
Property features AI
Finance
- Financial info: Financing accepted: Cash, in-house financing, conventional loan
Exterior
- Parking: 3-car parking
- Utilities: Septic; Public water; Municipal electric (Entergy); Natural gas; Fiber internet available
- Home design: Brick exterior
- Construction: Composition roof; Piers foundation
- Exterior features: Outside storage area; RV parking; Paved road access; Level, rural lot; Inside city limits
Interior
- Kitchen: Gas range; Dishwasher; Refrigerator stays; Ice maker connection
- Flooring: Laminate flooring; Wood flooring
- Bathrooms: 2 full bathrooms
- Heating & cooling: Central heat (natural gas); Central electric cooling
- Interior features: Den/Family Room; Washer connection; Gas dryer connection; Paneling on walls/ceilings
- Laundry & utility: Washer connection; Gas dryer connection
Neighborhood map
What this means for you Summary
Snapshot
- This is a 4-bed/2.0-bath single-family listed at $70k.
Deal economics
- At list price, monthly cash flow is $583 ($7k/yr) — positive.
- The deal already cash-flows at list — no discount required.
- Meets the 1% rule at list price ($1k rent vs $70k).
- Recommended offer: $68k (3.0% below list) — sets the bar for market timing.
Location & tenants
- Location reads 57/100 on livability (#332 in AR) — a working-class tenant base; expect higher turnover. Strengths: cost of living A+, housing A-; Watch: crime F, amenities F, commute F.
- Glen Rose School District (rural): math 42% / reading 33% proficiency, ranked #84 of 238 in AR (top 35%) — families likely to look elsewhere, expect single-tenant / working-renter base with shorter leases.
- Zoned schools: Glen Rose High School (math 32% / reading 22%, grade F, #164 of 292 statewide, top 61%, 304 students, 34% FRL).
- Market conditions: 4 active listings in the ZIP; 446 units permitted in Saline County in 2024 (0 in 5+ unit buildings).
Forward outlook
- In year one you build about $4k of equity ($483 loan paydown + $3k appreciation (4.4% local appreciation)).
- Saline County population projected at +39% by 2050 — long-run rental-demand tailwind backs the buy-and-hold thesis.
- At projected returns (4.4% appreciation + 3.0% rent growth), your $20k cash investment doubles in ~2 years — after that, you're playing with house money.
- By year 9, paydown + projected appreciation supports a ~$31k cash-out refi (75% LTV) — recoverable capital for the next deal without selling this one.
Negotiation context
- It's been on market 34 days — a 3% lower offer ($68k) is reasonable based on typical stale-listing flexibility.
- 4 sale attempts; this cycle's ask has dropped $15k (18%) from the opening price — seller is motivated, your offer sets the floor, not the list.
Risks & watch-outs
- Watch-outs: built in 1959 — expect roof / HVAC / electrical / plumbing capex.
- Climate carrying-cost: major wildfire risk; extreme-heat days projected 7→20/yr by 2055 (HVAC capex compounding) — expect insurance premiums to compound above CPI over the hold.
Questions for the listing agent
- It's been on market 34 days. Have you received any prior offers? Is the seller open to a 3% concession, seller financing, or rate buy-down credit?
- Built in 1959 — when were the roof, HVAC, electrical panel, plumbing, and water heater last replaced?
- Is there a deadline driving the sale (1031 exchange, divorce, estate, relocation)? That informs how much negotiation room exists.
- Schools are F-rated, which usually means shorter tenancies and higher turnover. Who's the typical renter profile here, and what's been the actual vacancy rate?
- Crime grade is F in this area — have there been break-ins, vandalism, or insurance claims at this property in the last 3 years? What carrier currently insures it and at what premium?
- What's the average days-on-market for RENTAL listings here right now (not sales)? A rising rental-DOM trend means longer vacancies and softer asking-rent achievability than the comps imply.
- What's the recent tenant-quality profile in this submarket — average credit score on applications, eviction rate, late-payment / NSF rate, and stable-employment percentage? A property-management company in the area should have these aggregated.
- How much new for-sale + rental construction is in the pipeline within 1–3 miles? Heavy new supply typically softens prices + rents 12–24 months out; constrained supply supports both.
Investment metrics
- 1% rule
- 1.93% ✓
- Cap rate
- 16.30%
- Cash-on-cash
- 35.74%
- DSCR
- 2.59
- GRM
- 4.3
CMA / ARV
- ARV (median comp)
- $254,886
- List price
- $69,900
- Delta
- -72.58%
- Verdict
- UNDERPRICED
- Comps
- 5 within 1.0 mi
Projected returns pro-forma
4.39% appreciation · 3.0% rent growth · sell at horizon
- IRR
- 43.5%
- Equity multiple
- 3.60×
- Total profit
- $50,835
- Equity at exit
- $37,036
- IRR
- 42.0%
- Equity multiple
- 7.28×
- Total profit
- $122,859
- Equity at exit
- $61,885
Cash invested: $19,572 (down + closing). Projections, not guarantees.
Landlord ↔ Tenant lean methodology
- Overall (STATE)
- 92 Strongly Landlord-Friendly
- State Arkansas
- 92 Strongly Landlord-Friendly · R+14
- County
- — inherits STATE
- City
- — inherits STATE
ZIP-level market 72167
- Home prices YoY
- 2.4%
- Active inventory
- 4
- Price-to-rent
- 4.3×
Monthly cashflow live
- Estimated rent
- $1,349 medium interval (Pro) →
- Mortgage (P&I)
- −$367
- Tax est. 1.5%
- −$87 /mo · $1,048/yr
- Insurance
- −$29
- HOA
- −$0
- Vacancy / Maint / Mgmt
- −$283
- Net cashflow
- $583
Break-even live
Sensitivity live
| Price | -10% $631 | -5% $607 | +0% $583 | +5% $559 | +10% $535 |
|---|---|---|---|---|---|
| Rent | -10% $476 | -5% $530 | +0% $583 | +5% $636 | +10% $689 |
| Rate | -1.0pp $618 | -0.5pp $601 | base $583 | +0.5pp $565 | +1.0pp $546 |
UW: 25.0% down · 7.5% · 30yr · 1.5% tax · 5.0% vac · 8.0% maint · 8.0% mgmt
Financing live
Cash to close
- Down payment
- $17,475
- Closing costs
- $2,097
- Reserves months
- —
- Total cash needed
- —
Loan-product check · same deal, 3 products live
Conventional
25% down · 7.5% · 30yr
- Down + closing
- —
- Monthly P&I
- —
- Monthly cashflow
- —
- DSCR
- —
- Eligible?
- —
Personal DTI + credit; lowest rate.
DSCR
20% down · 8.5% · 30yr
- Down + closing
- —
- Monthly P&I
- —
- Monthly cashflow
- —
- DSCR
- —
- Eligible?
- —
No personal income docs; deal must DSCR.
Hard money
10% down · 12.0% · 12mo
- Down + closing
- —
- Monthly P&I
- —
- Monthly cashflow
- —
- DSCR
- —
- Eligible?
- —
Short-term bridge; refi at stabilization.
Listing history 24 events
-
2026-06-18days on market $69,900 Active 34 DOM
-
2026-06-17days on market $69,900 Active 33 DOM
-
2026-06-16days on market $69,900 Active 32 DOM
-
2026-06-15days on market $69,900 Active 31 DOM
-
2026-06-14days on market $69,900 Active 29 DOM
-
2026-06-13days on market $69,900 Active 28 DOM
-
2026-06-10days on market $69,900 Active 26 DOM
-
2026-06-09days on market $69,900 Active 25 DOM
-
2026-06-08days on market $69,900 Active 24 DOM
-
2026-06-07statusdays on market $69,900 Active 23 DOM
-
2026-06-03days on market $69,900 Price Change 19 DOM
-
2026-06-02days on market $69,900 Price Change 18 DOM
-
2026-06-01days on market $69,900 Price Change 17 DOM
-
2026-05-31days on market $69,900 Price Change 16 DOM
-
2026-05-31pricestatusdays on market $69,900 Price Change 15 DOM
-
2026-05-15$85,000 New Listing 459-char remark
-
2026-05-09historical
-
2026-04-28$95,000 New Listing
-
2025-07-13historical
-
2025-06-20status Back on Market
-
2025-06-13historical Take Backups
-
2025-05-23price $119,900
-
2025-05-01$124,900 New Listing
-
2007-08-07soldstatus $63,000
ⓘ Source: listings_history table (triggers on properties + properties_extension) + one-shot
backfill from property_details.listing_events for pre-trigger history.
Climate risk First Street
- Flood 1/10 Low FEMA zone X (unshaded) · 0% chance over 30 yrs
- Wildfire 7/10 Severe
- Heat 6/10 Major 7 d/yr ≥111°F today · 20 d/yr by 30 yrs out
- Wind 4/10 Moderate 12% chance of damaging wind over 30 yrs
- Air quality 2/10 Low 0 unhealthy d/yr today · 1 by 30 yrs out
Nearby sold comps map
Loading sold comps map…
Walkable amenities ~0.75 mi
Loading nearby amenities…
Taxation est. · year 1
- Rental income
- $16,192
- − Mortgage interest
- −$3,915
- − Property taxes
- −$1,048
- − Insurance
- −$350
- − Repairs & maintenance
- −$1,295
- − Management
- −$1,295
- − Depreciation
- −$2,033
- Taxable income
- $6,254
- Est. tax owed @ 24.0%
- −$1,501
- After-tax cash flow
- $5,494/yr
For passive investors: Depreciation is non-cash, so a rental often shows a tax loss while cash-flowing — sheltering income. Rental losses are passive: they offset passive income freely, and up to $25,000/yr can offset ordinary (W-2) income if you actively participate and your MAGI is under $100k (phasing out to $0 by $150k); unused losses carry forward. On sale, claimed depreciation is recaptured at up to 25%, and gains may owe capital-gains tax (a 1031 exchange can defer both). Figures are a year-1 estimate at your 24.0% rate — not tax advice; consult a CPA.
Schools (NCES district)
- District
- Glen Rose School District
- NCES district ID
- 0506630
- Math proficiency
- 42% ▼ -13.00%
- Reading proficiency
- 33% ▼ -7.00%
- Median HH income
- $47,423
- Composite
- 32.22/100
- National rank
- #5772
- State rank
- #84 of 238 in AR
Livability — Traskwood
- Score
- 57/100
- State rank
- #332
- US rank
- #21576
Category grades
Schools grade is shown separately in the Schools card above.
Census & demographics
- Census place
- Traskwood, AR
- Population (ZIP)
- 1,567
Population outlook (Saline County) Hauer SSP2
- Today (2025)
- 140,141 people
- By 2030
- 151,233 · +7.9%
- By 2040
- 173,100 · +23.5%
- By 2050
- 194,368 · +38.7%
- By 2075
- 245,295 · +75.0%
- By 2100
- 279,117 · +99.2%
Race, ethnicity, and origin ACS 2023
- Neighborhood character
- Predominantly White (78%)
- Race & ethnicity
- White 78% Hispanic / Latino 20% Two or more races 2%
- Hispanic origin (detail)
- Mexican 20%
- Common ancestry
- Italian 9%
- Foreign-born
- 4% · Canada
- Languages at home
- 94% English-only · Spanish 5%
Political lean MEDSL · Saline
- 2024 margin
- Solid R (+40.1) · D 28.8% · R 69.0% · Other 2.2%
- 2008→2024 swing
- +0.8pp no change · 2008: -41.0pp · 2024: -40.1pp
- All cycles
- 2024: R+40.1 2020: R+41.2 2016: R+43.5 2012: R+42.7 2008: R+41.0
Not yet ingested
- Civics
- —
Market trends
- HPI YoY
- ▲ 4.39%
- Current HPI
- 191.3429
- Rent YoY
- —
- Metro
- —
- State GDP YoY
- ▲ 3.80%
- F500 in state
- 10
Industry mix (Fortune 500 HQ in AR)
| Industry | F500 HQs | Revenue |
|---|---|---|
| Retail | 1 | $681B |
|
||
| Food / Agriculture | 1 | $53B |
|
||
| Retail / Energy | 1 | $22B |
|
||
| Transportation / Logistics | 1 | $12B |
|
||
| Energy | 1 | $4B |
|
||
Price history
+11.0% since first listed10 events — show timeline
- 2026-05-30 Price Changed $69,900 CARMLS
- 2026-05-15 Listed $85,000 CARMLS
- 2026-05-09 Listing Removed — CARMLS
- 2026-04-28 Listed $95,000 CARMLS
- 2025-07-13 Listing Removed — CARMLS
- 2025-06-20 Relisted — CARMLS
- 2025-06-13 Contingent — CARMLS
- 2025-05-23 Price Changed $119,900 CARMLS
- 2025-05-01 Listed $124,900 CARMLS
- 2007-08-07 Sold (Public Records) $63,000 Public Records
Property tax history
-10.7%/yrLatest (2025): $97 · +0.0% YoY. Source: county tax records.
Cash-flow waterfall
monthlySold comps — $/sqft
last 12 mo · ≤1 miLoading sold comps…