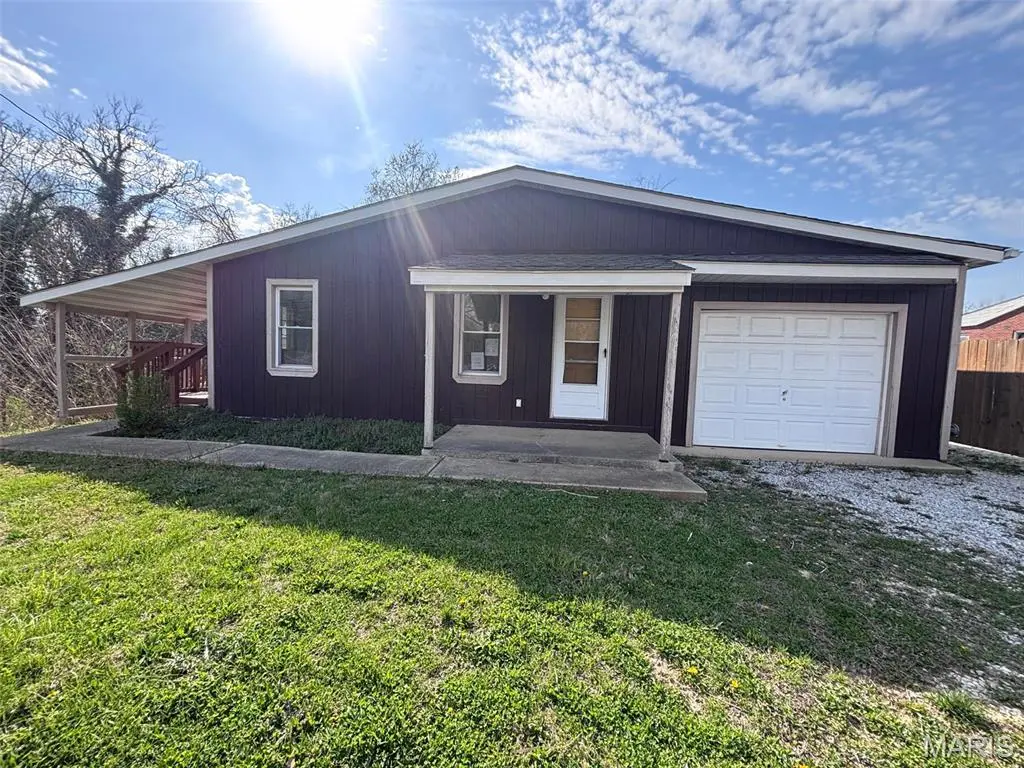
7919 N Illinois St · Caseyville, IL
Flood risk 1/10 · Minimal
- FEMA flood zone
- X
- Chance of flooding over 30 yrs
- 0.0%
- Est. flood insurance / yr
- $473 – $860
Fire risk 1/10 · Minimal
- Est. fire insurance / yr
- $804 – $1,492
Heat risk 5/10 · Moderate
- Hot days now (above 107°F)
- 7 days/yr
- Hot days in 30 yrs
- 21 days/yr
Wind risk 2/10 · Minimal
- Chance of severe wind over 30 yrs
- 1.0%
Air-quality risk 3/10 · Minor
- Unhealthy air days now
- 2 days/yr
- Unhealthy air days in 30 yrs
- 4 days/yr
Risk factors via First Street. Map © Google.
Why this score? — see what drove the B- grade
The composite is a weighted blend of 9 inputs, each scored 0–100. Each bar is that input's sub-score; the figure is the points it added to the 100-point composite (weight × sub-score).
- Cash flow +30.0/30.0
- 1% rule +10.0/10.0
- DSCR +10.0/10.0
- ARV discount +7.5/15.0
- Livability +3.7/5.0
- Rent growth +2.5/5.0
- Condition / age +2.5/5.0
- Schools +1.6/10.0
- Appreciation +0.0/10.0
$66,000
🖨 Deal sheet 📄 Offer letter ✓ Due diligence
Listing remarks MLS
Well maintained 2 bed 1 bath home on over 1 acre. Large 1 car finished garage. Nice size deck perfect for entertaining. New flooring 2021, new Kitchen counter tops, back splash, sink and refrigerator.
Key facts
- Large lot
- Full basement
- 2 decks
Tags
Property features AI
Finance
- Other: Living area listed as 672 (public records)
Exterior
- Parking: Attached 1-car garage
- Utilities: Public water; Aerobic septic system; Electricity connected (Ameren)
- Home design: Single-family residence; One level
- Construction: Frame construction; Architectural shingle roof
- Exterior features: Property sits on approximately 1.11 acres; Adjoins wooded area
Interior
- Kitchen: Kitchen on the main level
- Bedrooms: 2 bedrooms on the main level
- Bathrooms: 1 full bathroom on the main level
- Heating & cooling: Forced air heating; Central air conditioning
- Interior features: Unfinished basement; Adjoins wooded area
Neighborhood map
What this means for you Summary
Snapshot
- This is a 2-bed/2.0-bath single-family listed at $66k.
Deal economics
- At list price, monthly cash flow is $255 ($3k/yr) — positive.
- The deal already cash-flows at list — no discount required.
- Meets the 1% rule at list price ($1k rent vs $66k).
- Recommended offer: $64k (3.0% below list) — sets the bar for market timing.
- Cap rate 10.9% vs local median 3.3% in Caseyville — top-decile yield for the area; either an underpriced asset or a hidden risk that comps aren't pricing in. Stress-test before assuming the spread holds.
Location & tenants
- Location reads 74/100 on livability (#241 in IL, #4,389 nationally) — a middle-class / working-renter tenant base. Strengths: commute A+, cost of living A+, housing A+; Watch: health & safety C-, amenities F.
- Collinsville CUSD 10 (suburban): math 14% / reading 20% proficiency, ranked #465 of 620 in IL (top 75%) — low school quality limits family demand, transient renter base, plan for 1-2y turnover.
- Zoned schools: Collinsville High School (math 16% / reading 21%, grade F, #427 of 693 statewide, top 62%, 1,978 students, 0% FRL) — zoned schools average 0% FRL vs 52% district-wide (52 pts lower); this property's tenant base skews higher-income than the district average.
- Market conditions: 50 active listings in the ZIP; 2 comparable units currently listed for rent nearby; 783 units permitted in St. Clair County in 2024 (378 in 5+ unit buildings).
Forward outlook
- Local home prices are declining (-3.0%/yr); year-one equity from $456 of loan paydown is wiped out by about $2k of value loss. Plan a longer hold.
- St. Clair County population projected at -23% by 2050 — secular population decline; favor cash flow + early exit over multi-decade hold.
- At projected returns (-3.0% appreciation + 3.0% rent growth), your $18k cash investment doubles in ~8 years — after that, you're playing with house money.
Negotiation context
- It's been on market 38 days — a 3% lower offer ($64k) is reasonable based on typical stale-listing flexibility.
- 3 sale attempts since 4y ago with the ask held roughly flat each time — persistent listings suggest the price (not the market) is what's stuck; bring a comps-based counter.
- Current owner paid $52k; 27% above their basis — modest negotiation headroom, anchor on the comps not their cost.
Risks & watch-outs
- Watch-outs: property tax is 2.9% of price; built in 1936 — expect roof / HVAC / electrical / plumbing capex.
- Climate carrying-cost: extreme-heat days projected 7→21/yr by 2055 (HVAC capex compounding) — expect insurance premiums to compound above CPI over the hold.
Questions for the listing agent
- It's been on market 38 days. Have you received any prior offers? Is the seller open to a 3% concession, seller financing, or rate buy-down credit?
- Built in 1936 — when were the roof, HVAC, electrical panel, plumbing, and water heater last replaced?
- Property tax is high relative to price — has the assessment been appealed recently, and will the sale trigger a re-assessment?
- Is there a deadline driving the sale (1031 exchange, divorce, estate, relocation)? That informs how much negotiation room exists.
- Schools are F-rated, which usually means shorter tenancies and higher turnover. Who's the typical renter profile here, and what's been the actual vacancy rate?
- What's the average days-on-market for RENTAL listings here right now (not sales)? A rising rental-DOM trend means longer vacancies and softer asking-rent achievability than the comps imply.
- What's the recent tenant-quality profile in this submarket — average credit score on applications, eviction rate, late-payment / NSF rate, and stable-employment percentage? A property-management company in the area should have these aggregated.
- How much new for-sale + rental construction is in the pipeline within 1–3 miles? Heavy new supply typically softens prices + rents 12–24 months out; constrained supply supports both.
Investment metrics
- 1% rule
- 1.52% ✓
- Cap rate
- 10.93%
- Cash-on-cash
- 16.55%
- DSCR
- 1.74
- GRM
- 5.5
CMA / ARV
No comps found within radius.
Projected returns pro-forma
-3.0% appreciation · 3.0% rent growth · sell at horizon
- IRR
- 7.7%
- Equity multiple
- 1.30×
- Total profit
- $5,601
- Equity at exit
- $9,841
- IRR
- 17.1%
- Equity multiple
- 2.41×
- Total profit
- $26,037
- Equity at exit
- $5,706
Cash invested: $18,480 (down + closing). Projections, not guarantees.
Landlord ↔ Tenant lean methodology
- Overall (STATE)
- 43 Moderately Tenant-Leaning
- State Illinois
- 43 Moderately Tenant-Leaning · D+7
- County
- — inherits STATE
- City
- — inherits STATE
ZIP-level market 62232
- Active inventory
- 50
- Price-to-rent
- 5.5×
Monthly cashflow live
- Estimated rent
- $1,000 medium interval (Pro) →
- Mortgage (P&I)
- −$346
- Tax from tax record
- −$162 /mo · $1,938/yr
- Insurance
- −$28
- HOA
- −$0
- Vacancy / Maint / Mgmt
- −$210
- Net cashflow
- $255
Break-even live
UW: 25.0% down · 7.5% · 30yr · 1.5% tax · 5.0% vac · 8.0% maint · 8.0% mgmt
Financing live
Cash to close
- Down payment
- $16,500
- Closing costs
- $1,980
- Reserves months
- —
- Total cash needed
- —
Loan-product check · same deal, 3 products live
Conventional
25% down · 7.5% · 30yr
- Down + closing
- —
- Monthly P&I
- —
- Monthly cashflow
- —
- DSCR
- —
- Eligible?
- —
Personal DTI + credit; lowest rate.
DSCR
20% down · 8.5% · 30yr
- Down + closing
- —
- Monthly P&I
- —
- Monthly cashflow
- —
- DSCR
- —
- Eligible?
- —
No personal income docs; deal must DSCR.
Hard money
10% down · 12.0% · 12mo
- Down + closing
- —
- Monthly P&I
- —
- Monthly cashflow
- —
- DSCR
- —
- Eligible?
- —
Short-term bridge; refi at stabilization.
Rent comps 2 comps
| Address | Beds | Baths | Sqft | Rent | $/sqft | DOM | Units | Dist |
|---|---|---|---|---|---|---|---|---|
| 1003 S Morrison Ave Unit IB-23 Collinsville, IL | 1.0 | 1.0 | 700 | $1,000 | $1.43 | 10d | 1 | 1.36mi |
| 1003 S Morrison Ave Unit IB-37 Collinsville, IL | 1.0 | 1.0 | 700 | $1,000 | $1.43 | 2d | 1 | 1.36mi |
Listing history 23 events
-
2026-06-18days on market $66,000 Active 38 DOM
-
2026-06-17days on market $66,000 Active 37 DOM
-
2026-06-16days on market $66,000 Active 36 DOM
-
2026-06-15days on market $66,000 Active 35 DOM
-
2026-06-13days on market $66,000 Active 33 DOM
-
2026-06-13days on market $66,000 Active 32 DOM
-
2026-06-09days on market $66,000 Active 29 DOM
-
2026-06-08days on market $66,000 Active 28 DOM
-
2026-06-07days on market $66,000 Active 27 DOM
-
2026-06-05days on market $66,000 Active 24 DOM
-
2026-06-03days on market $66,000 Active 23 DOM
-
2026-06-02days on market $66,000 Active 22 DOM
-
2026-06-01days on market $66,000 Active 21 DOM
-
2026-05-31days on market $66,000 Active 20 DOM
-
2026-05-18status Active
-
2026-04-13status Pending
-
2026-04-02$66,000 Active
-
2022-04-04soldstatus Closed 200-char remark
Show marketing remark (200 chars)
Well maintained 2 bed 1 bath home on over 1 acre. Large 1 car finished garage. Nice size deck perfect for entertaining. New flooring 2021, new Kitchen counter tops, back splash, sink and refrigerator.
-
2022-03-04historical Active Under Contract 200-char remark
Show marketing remark (200 chars)
Well maintained 2 bed 1 bath home on over 1 acre. Large 1 car finished garage. Nice size deck perfect for entertaining. New flooring 2021, new Kitchen counter tops, back splash, sink and refrigerator.
-
2022-03-01price $122,500 200-char remark
Show marketing remark (200 chars)
Well maintained 2 bed 1 bath home on over 1 acre. Large 1 car finished garage. Nice size deck perfect for entertaining. New flooring 2021, new Kitchen counter tops, back splash, sink and refrigerator.
-
2022-01-31$132,500 Active 200-char remark
Show marketing remark (200 chars)
Well maintained 2 bed 1 bath home on over 1 acre. Large 1 car finished garage. Nice size deck perfect for entertaining. New flooring 2021, new Kitchen counter tops, back splash, sink and refrigerator.
-
1989-03-03soldstatus $52,000
-
1989-03-03soldstatus $52,000
ⓘ Source: listings_history table (triggers on properties + properties_extension) + one-shot
backfill from property_details.listing_events for pre-trigger history.
Tax reassessment forecast IL · Partial reset (capped growth)
- Current annual tax
- $1,938 · $162/mo
- Projected year-2 tax
- $1,938 · $162/mo
- Expected delta
- $0/yr ($0/mo · 0.0%)
ⓘ Screening estimate from a state-policy table — verify with the county assessor before closing.
Climate risk First Street
- Flood 1/10 Low FEMA zone X · 0% chance over 30 yrs
- Wildfire 1/10 Low
- Heat 5/10 Major 7 d/yr ≥107°F today · 21 d/yr by 30 yrs out
- Wind 2/10 Low 100% chance of damaging wind over 30 yrs
- Air quality 3/10 Moderate 2 unhealthy d/yr today · 4 by 30 yrs out
Nearby sold comps map
Loading sold comps map…
Walkable amenities ~0.75 mi
Loading nearby amenities…
Taxation est. · year 1
- Rental income
- $12,000
- − Mortgage interest
- −$3,697
- − Property taxes
- −$1,938
- − Insurance
- −$330
- − Repairs & maintenance
- −$960
- − Management
- −$960
- − Depreciation
- −$1,920
- Taxable income
- $2,195
- Est. tax owed @ 24.0%
- −$527
- After-tax cash flow
- $2,532/yr
For passive investors: Depreciation is non-cash, so a rental often shows a tax loss while cash-flowing — sheltering income. Rental losses are passive: they offset passive income freely, and up to $25,000/yr can offset ordinary (W-2) income if you actively participate and your MAGI is under $100k (phasing out to $0 by $150k); unused losses carry forward. On sale, claimed depreciation is recaptured at up to 25%, and gains may owe capital-gains tax (a 1031 exchange can defer both). Figures are a year-1 estimate at your 24.0% rate — not tax advice; consult a CPA.
Schools (NCES district)
- District
- Collinsville CUSD 10
- NCES district ID
- 1710650
- Math proficiency
- 14% ▼ -9.00%
- Reading proficiency
- 20% ▼ -7.00%
- Median HH income
- $52,504
- Composite
- 15.65/100
- National rank
- #9288
- State rank
- #465 of 620 in IL
Livability — Caseyville
- Score
- 74/100
- State rank
- #241
- US rank
- #4389
Category grades
Schools grade is shown separately in the Schools card above.
Census & demographics
- City population
- 7,480
- Population (ZIP)
- 7,480
Population outlook (St. Clair County) Hauer SSP2
- Today (2025)
- 250,366 people
- By 2030
- 240,511 · -3.9%
- By 2040
- 217,391 · -13.2%
- By 2050
- 192,699 · -23.0%
- By 2075
- 140,637 · -43.8%
- By 2100
- 100,499 · -59.9%
Race, ethnicity, and origin ACS 2023
- Neighborhood character
- Predominantly White (66%)
- Race & ethnicity
- White 66% Hispanic / Latino 18% Black 9% Two or more races 9%
- Hispanic origin (detail)
- Mexican 14% Puerto Rican 2%
- Common ancestry
- Lithuanian 4% Romanian 3% Portuguese 3%
- Foreign-born
- 4% · Canada
- Languages at home
- 89% English-only · Spanish 10%
Political lean MEDSL · St. Clair
- 2024 margin
- Lean D (+7.9) · D 53.0% · R 45.1% · Other 1.8%
- 2008→2024 swing
- -14.6pp toward R · 2008: 22.4pp · 2024: 7.9pp
- All cycles
- 2024: D+7.9 2020: D+8.7 2016: D+5.6 2012: D+14.5 2008: D+22.4
Not yet ingested
- Civics
- —
Market trends
- HPI YoY
- ▼ -83.21%
- Current HPI
- 124.0291
- Rent YoY
- —
- Metro
- —
- State GDP YoY
- ▲ 1.59%
- F500 in state
- 60
Industry mix (Fortune 500 HQ in IL)
| Industry | F500 HQs | Revenue |
|---|---|---|
| Insurance | 4 | $201B |
|
||
| Consumer Goods | 4 | $87B |
|
||
| Industrial Machinery | 3 | $64B |
|
||
| Healthcare | 2 | $55B |
|
||
| Retail / Pharmacy | 1 | $148B |
|
||
| Agriculture / Food | 1 | $86B |
|
||
Price history
+26.9% since first listed9 events — show timeline
- 2026-05-18 Relisted — MARIS as Distributed by MLS Grid
- 2026-04-13 Pending — MARIS as Distributed by MLS Grid
- 2026-04-02 Listed $66,000 MARIS as Distributed by MLS Grid
- 2022-04-04 Sold (MLS) — MARIS as Distributed by MLS Grid
- 2022-03-04 Contingent — MARIS as Distributed by MLS Grid
- 2022-03-01 Price Changed $122,500 MARIS as Distributed by MLS Grid
- 2022-01-31 Listed $132,500 MARIS as Distributed by MLS Grid
- 1989-03-03 Sold (Public Records) $52,000 Public Records
- 1989-03-03 Sold (Public Records) $52,000 Public Records
Property tax history
+5.1%/yrLatest (2024): $1,938 · +8.6% YoY. Source: county tax records.
Cash-flow waterfall
monthlySold comps — $/sqft
last 12 mo · ≤1 miLoading sold comps…