 Triplex
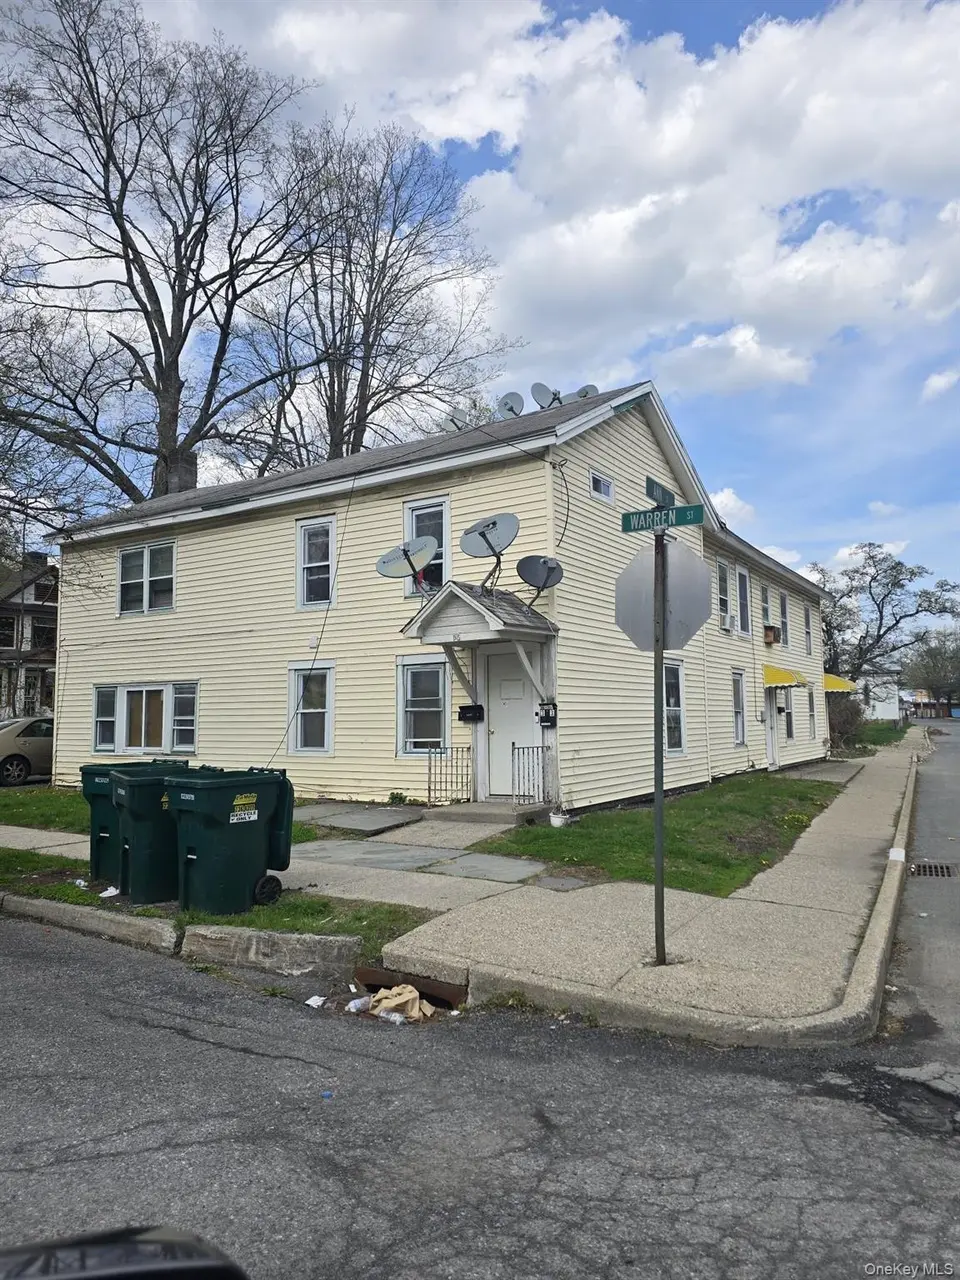
56 Warren St · Ellenville, NY
Flood risk 10/10 · Severe
- FEMA flood zone
- X (unshaded)
- Chance of flooding over 30 yrs
- 0.99%
- Est. flood insurance / yr
- $473 – $860
Fire risk 2/10 · Minimal
- Est. fire insurance / yr
- $691 – $1,283
Heat risk 4/10 · Minor
- Hot days now (above 96°F)
- 9 days/yr
- Hot days in 30 yrs
- 20 days/yr
Wind risk 3/10 · Minor
- Chance of severe wind over 30 yrs
- 8.0%
Air-quality risk 2/10 · Minimal
- Unhealthy air days now
- 1 days/yr
- Unhealthy air days in 30 yrs
- 1 days/yr
Risk factors via First Street. Map © Google.
Why this score? — see what drove the C- grade
The composite is a weighted blend of 9 inputs, each scored 0–100. Each bar is that input's sub-score; the figure is the points it added to the 100-point composite (weight × sub-score).
- Cash flow +14.7/30.0
- Appreciation +10.0/10.0
- ARV discount +7.5/15.0
- DSCR +4.5/10.0
- 1% rule +4.0/10.0
- Schools +3.3/10.0
- Livability +3.0/5.0
- Rent growth +2.5/5.0
- Condition / age +2.5/5.0
$600,000
🖨 Deal sheet (PDF) 📄 Offer letter ✓ Due diligence
Multi-family units
County records classify this as Multi-Family (2-4 Unit). Listing-text estimate: 3 units. confirmed
Listing remarks
Investors Alert. Beeautifully updated, fully occupied multi family in the town of Ellenville. 2 three bedroom and 2 two bedroom units generating a monthly income of over $7,000! This multi family will be a fantastic income producer in your portfolio. Schedule your showing today.
Key facts
- 6,534 sq ft lot
- Built 1900
- Listed 21 days
Property features AI
Exterior
- Parking: Driveway access; No carport
- Utilities: Public sewer; Electricity connected
- Home design: Quadruplex
- Construction: Frame construction
- Exterior features: Frame construction; Not on the waterfront
Interior
- Kitchen: Eat-in kitchen(s)
- Bedrooms: Two 3-bedroom units; Two 2-bedroom units
- Bathrooms: Four full bathrooms (total)
- Heating & cooling: Baseboard heating; Electric heating; Wall/window air conditioning units
- Interior features: Eat-in kitchen; Partial basement
- Laundry & utility: Basement space suitable for utilities
Neighborhood map
What this means for you Summary
Snapshot
- This is a 3 × 2-bed/?-bath units multifamily listed at $600k.
Deal economics
- At list price, monthly cash flow is $96 ($1k/yr) — positive. Per door: $32/mo.
- The deal already cash-flows at list — no discount required.
- To meet the 1% rule (rent ≥ 1% of price), the offer needs to be $538k (10.3% below list).
- Recommended offer: $538k (10.3% below list) — sets the bar for 1% rule.
Location & tenants
- Location reads 60/100 on livability (#961 in NY) — a middle-class / working-renter tenant base. Strengths: cost of living A, housing A-; Watch: crime C-, amenities F, commute F.
- Ellenville Central School District (town): math 32% / reading 46% proficiency, ranked #534 of 590 in NY (top 90%) — families likely to look elsewhere, expect single-tenant / working-renter base with shorter leases.
- Zoned schools: Ellenville Elementary School (math 17% / reading 42%, grade F, #1,729 of 2,108 statewide, top 84%, 674 students, 61% FRL); Ellenville Junior/Senior High School (math 82% / reading 82%, grade A, #452 of 1,100 statewide, top 44%, 731 students, 64% FRL).
- Zoned-school proficiency averages 56% at this address vs 39% district-wide (+17 pts) — the actual schools serving this property are materially stronger than the Ellenville Central School District average implies; a family-tenant draw the district grade alone would hide.
- Market conditions: 72 active listings in the ZIP; 464 units permitted in Ulster County in 2024 (170 in 5+ unit buildings).
Forward outlook
- In year one you build about $64k of equity ($4k loan paydown + $60k appreciation (10.0% local appreciation)).
- Ulster County population projected at -14% by 2050 — secular population decline; favor cash flow + early exit over multi-decade hold.
- At projected returns (10.0% appreciation + 3.0% rent growth), your $168k cash investment doubles in ~3 years — after that, you're playing with house money.
- By year 2, paydown + projected appreciation supports a ~$103k cash-out refi (75% LTV) — recoverable capital for the next deal without selling this one.
Negotiation context
- It's been on market 21 days — a 2% lower offer ($591k) is reasonable based on typical stale-listing flexibility.
- Current owner paid $190k; list at $600k implies a 216% gain — meaningful room to come down on a strong offer.
Risks & watch-outs
- Watch-outs: flood insurance adds $56/mo; built in 1900 — expect roof / HVAC / electrical / plumbing capex.
- Climate carrying-cost: severe flood risk — expect insurance premiums to compound above CPI over the hold.
Questions for the listing agent
- Can we see the unit-by-unit rent roll, current vacancy, and any below-market leases? What's the average tenancy length?
- What capital expenditures (roof, boiler, parking lot, exteriors) have been made in the last 5 years, and what's planned in the next 2?
- Built in 1900 — when were the roof, HVAC, electrical panel, plumbing, and water heater last replaced?
- What's the actual annual flood-insurance premium (NFIP or private), and is the property in a SFHA with mandatory coverage?
- Is there a deadline driving the sale (1031 exchange, divorce, estate, relocation)? That informs how much negotiation room exists.
- Schools are D-rated, which usually means shorter tenancies and higher turnover. Who's the typical renter profile here, and what's been the actual vacancy rate?
- What's the average days-on-market for RENTAL listings here right now (not sales)? A rising rental-DOM trend means longer vacancies and softer asking-rent achievability than the comps imply.
- What's the recent tenant-quality profile in this submarket — average credit score on applications, eviction rate, late-payment / NSF rate, and stable-employment percentage? A property-management company in the area should have these aggregated.
- How much new apartment / multifamily construction is in the pipeline within 1–3 miles? Heavy new supply (>2% of stock underway) typically softens rents 12–24 months out; light construction supports rent growth.
Investment metrics
- 1% rule
- 0.90% ✗
- Cap rate
- 6.60%
- Cash-on-cash
- 1.08%
- DSCR
- 1.05
- GRM
- 9.3
CMA / ARV
- ARV (on-the-fly)
- $322,240
- Comps found
- 3
Show comp detail 3 sales within ~0.75 mi
| Address | Dist | Beds/Ba | Sqft | Sold | Price | $/sf | Match |
|---|---|---|---|---|---|---|---|
| 59 Warren St | 0.03mi | 6/3.0 | 3,076 (+1%) | 5mo | $325,000 | $106 | 92 |
| 4 Broadhead St | 0.41mi | 7/2.0 (+1) | 3,090 (+2%) | 22mo | $330,000 | $107 | 51 |
| 6 Lincoln St | 0.54mi | 6/5.0 | 3,360 (+10%) | 7mo | $300,000 | $89 | 43 |
Match score weights: distance 35% · size 25% · config 20% · recency 20%. Top-matched comps best support the ARV.
Projected returns pro-forma
10.0% appreciation · 3.0% rent growth · sell at horizon
- IRR
- 24.8%
- Equity multiple
- 2.98×
- Total profit
- $332,967
- Equity at exit
- $540,528
- IRR
- 21.9%
- Equity multiple
- 6.81×
- Total profit
- $975,906
- Equity at exit
- $1,165,668
Cash invested: $168,000 (down + closing). Projections, not guarantees.
Landlord ↔ Tenant lean methodology
- Overall (STATE)
- 15 Strongly Tenant-Friendly
- State New York
- 15 Strongly Tenant-Friendly · D+10
- County
- — inherits STATE
- City
- — inherits STATE
ZIP-level market 12428
- Home prices YoY
- 20.0%
- Active inventory
- 72
- Price-to-rent
- 27.9×
Monthly cashflow live
- Estimated rent
- $5,382 medium interval (Pro) →
- Mortgage (P&I)
- −$3,146
- Tax from tax record
- −$704 /mo · $8,447/yr
- Insurance
- −$250
- Flood insurance flood zone
- −$56 /mo · $666/yr
- HOA
- −$0
- Vacancy / Maint / Mgmt
- −$1,130
- Net cashflow
- $96
Break-even live
Sensitivity live
| Price | -10% $435 | -5% $266 | +0% $96 | +5% $-74 | +10% $-244 |
|---|---|---|---|---|---|
| Rent | -10% $-329 | -5% $-117 | +0% $96 | +5% $308 | +10% $521 |
| Rate | -1.0pp $398 | -0.5pp $248 | base $96 | +0.5pp $-60 | +1.0pp $-218 |
3-unit breakdown (identical units grouped — click to expand)
| Units | Beds | Baths | Est. rent |
|---|---|---|---|
| 3× units | 2 | — | $5,382 |
| #1 | 2 | — | $1,794 |
| #2 | 2 | — | $1,794 |
| #3 | 2 | — | $1,794 |
| Total (3 units) | $5,382 | ||
UW: 25.0% down · 7.5% · 30yr · 1.5% tax · 5.0% vac · 8.0% maint · 8.0% mgmt
Financing live
Cash to close
- Down payment
- $150,000
- Closing costs
- $18,000
- Reserves months
- —
- Total cash needed
- —
Loan-product check · same deal, 3 products live
Conventional
25% down · 7.5% · 30yr
- Down + closing
- —
- Monthly P&I
- —
- Monthly cashflow
- —
- DSCR
- —
- Eligible?
- —
Personal DTI + credit; lowest rate.
DSCR
20% down · 8.5% · 30yr
- Down + closing
- —
- Monthly P&I
- —
- Monthly cashflow
- —
- DSCR
- —
- Eligible?
- —
No personal income docs; deal must DSCR.
Hard money
10% down · 12.0% · 12mo
- Down + closing
- —
- Monthly P&I
- —
- Monthly cashflow
- —
- DSCR
- —
- Eligible?
- —
Short-term bridge; refi at stabilization.
Listing history 17 events
-
2026-06-21days on market $600,000 Active 21 DOM
-
2026-06-21days on market $600,000 Active 20 DOM
-
2026-06-18days on market $600,000 Active 18 DOM
-
2026-06-17days on market $600,000 Active 17 DOM
-
2026-06-16days on market $600,000 Active 16 DOM
-
2026-06-15days on market $600,000 Active 15 DOM
-
2026-06-13days on market $600,000 Active 13 DOM
-
2026-06-12pricedays on market $600,000 Active 12 DOM
-
2026-06-09days on market $650,000 Active 9 DOM
-
2026-06-08days on market $650,000 Active 8 DOM
-
2026-06-07days on market $650,000 Active 7 DOM
-
2026-06-07days on market $650,000 Active 6 DOM
-
2026-06-04status $650,000 Active 3 DOM
-
2026-05-01status Pending
-
2026-04-28$650,000 Active
-
2022-02-03soldstatus $190,000
-
1997-01-21soldstatus $34,000
ⓘ Source: listings_history table (triggers on properties + properties_extension) + one-shot
backfill from property_details.listing_events for pre-trigger history.
Tax reassessment forecast NY · Partial reset (capped growth)
- Current annual tax
- $8,447 · $704/mo
- Projected year-2 tax
- $9,294 · $774/mo
- Expected delta
- +$846/yr (+$71/mo · 10.0%)
ⓘ Screening estimate from a state-policy table — verify with the county assessor before closing.
Climate risk First Street
- Flood 10/10 Extreme FEMA zone X (unshaded) · 99% chance over 30 yrs
- Wildfire 2/10 Low
- Heat 4/10 Moderate 9 d/yr ≥96°F today · 20 d/yr by 30 yrs out
- Wind 3/10 Moderate 8% chance of damaging wind over 30 yrs
- Air quality 2/10 Low 1 unhealthy d/yr today · 1 by 30 yrs out
Nearby sold comps map
Loading sold comps map…
Walkable amenities ~0.75 mi
Loading nearby amenities…
Taxation est. · year 1
- Rental income
- $64,584
- − Mortgage interest
- −$33,609
- − Property taxes
- −$8,447
- − Insurance
- −$3,666
- − Repairs & maintenance
- −$5,167
- − Management
- −$5,167
- − Depreciation
- −$17,455
- Taxable loss
- −$8,927
- Est. tax savings @ 24.0%
- +$2,142
- After-tax cash flow
- $3,293/yr
For passive investors: Depreciation is non-cash, so a rental often shows a tax loss while cash-flowing — sheltering income. Rental losses are passive: they offset passive income freely, and up to $25,000/yr can offset ordinary (W-2) income if you actively participate and your MAGI is under $100k (phasing out to $0 by $150k); unused losses carry forward. On sale, claimed depreciation is recaptured at up to 25%, and gains may owe capital-gains tax (a 1031 exchange can defer both). Figures are a year-1 estimate at your 24.0% rate — not tax advice; consult a CPA.
Schools (NCES district)
- District
- Ellenville Central School District
- NCES district ID
- 3610500
- Math proficiency
- 32% ▼ -6.00%
- Reading proficiency
- 46% ▲ 10.00%
- Median HH income
- $45,937
- Composite
- 33.22/100
- National rank
- #5525
- State rank
- #534 of 590 in NY
Livability — Ellenville
- Score
- 60/100
- State rank
- #961
- US rank
- #18871
Category grades
Schools grade is shown separately in the Schools card above.
Census & demographics
- Census place
- Ellenville, NY
- Population (ZIP)
- 6,972
Population outlook (Ulster County) Hauer SSP2
- Today (2025)
- 175,887 people
- By 2030
- 171,876 · -2.3%
- By 2040
- 161,771 · -8.0%
- By 2050
- 151,470 · -13.9%
- By 2075
- 133,023 · -24.4%
- By 2100
- 113,504 · -35.5%
Race, ethnicity, and origin ACS 2023
- Neighborhood character
- Majority White (63%)
- Race & ethnicity
- White 63% Hispanic / Latino 28% Two or more races 9% Black 4%
- Hispanic origin (detail)
- Mexican 1% Puerto Rican 17% Dominican 4%
- Common ancestry
- Romanian 5% Italian 3% Lithuanian 3%
- Foreign-born
- 9% · Canada, Jamaica, Dominican Republic
- Languages at home
- 75% English-only · Spanish 20% Russian/Polish/Slavic 4% Other Indo-European 1%
Political lean MEDSL · Ulster
- 2024 margin
- D (+18.7) · D 59.3% · R 40.7%
- 2008→2024 swing
- -4.9pp toward R · 2008: 23.6pp · 2024: 18.7pp
- All cycles
- 2024: D+18.7 2020: D+20.9 2016: D+9.1 2012: D+21.9 2008: D+23.6
Not yet ingested
- Civics
- —
Market trends
- HPI YoY
- ▲ 62.17%
- Current HPI
- 372.5352
- Rent YoY
- —
- Metro
- —
- State GDP YoY
- ▲ 2.60%
- F500 in state
- 92
Industry mix (Fortune 500 HQ in NY)
| Industry | F500 HQs | Revenue |
|---|---|---|
| Financial Services | 10 | $950B |
|
||
| Consumer Goods | 9 | $162B |
|
||
| Insurance | 4 | $225B |
|
||
| Telecommunications | 2 | $144B |
|
||
| Pharmaceuticals | 2 | $112B |
|
||
| Media / Entertainment | 2 | $69B |
|
||
Price history
+1811.8% since first listed4 events — show timeline
- 2026-05-01 Pending — OneKey® MLS as Distributed by MLS Grid
- 2026-04-28 Listed $650,000 OneKey® MLS as Distributed by MLS Grid
- 2022-02-03 Sold (Public Records) $190,000 Public Records
- 1997-01-21 Sold (Public Records) $34,000 Public Records
Property tax history
+2.1%/yrLatest (2025): $8,447 · +51.9% YoY. Source: county tax records.
Cash-flow waterfall
monthlySold comps — $/sqft
last 12 mo · ≤1 miLoading sold comps…