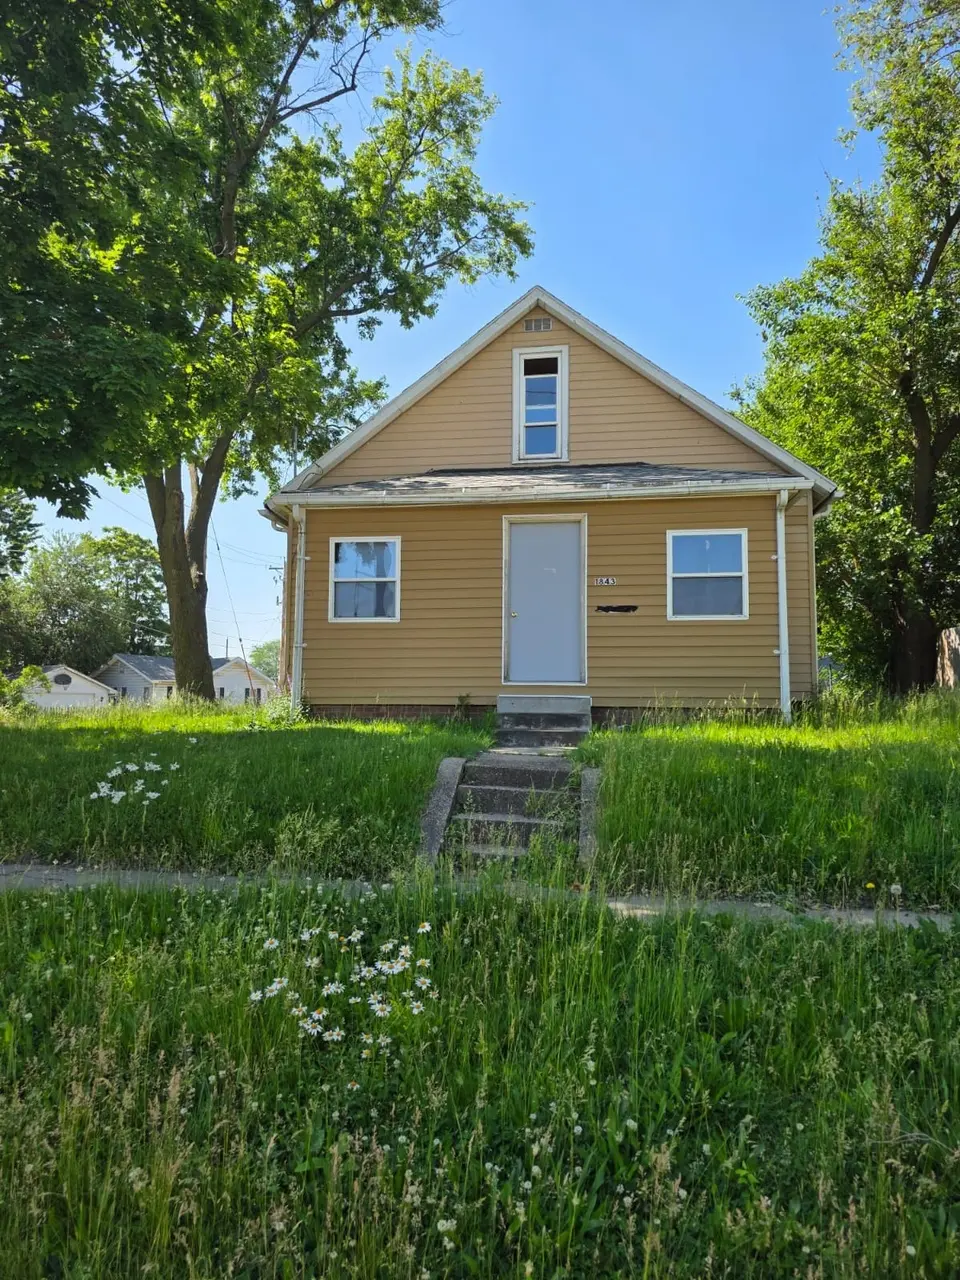
1843 Walker St · Des Moines, IA
Flood risk 1/10 · Minimal
- FEMA flood zone
- X (unshaded)
- Chance of flooding over 30 yrs
- 0.0%
- Est. flood insurance / yr
- $473 – $860
Fire risk 1/10 · Minimal
- Est. fire insurance / yr
- $902 – $1,676
Heat risk 3/10 · Minor
- Hot days now (above 103°F)
- 7 days/yr
- Hot days in 30 yrs
- 15 days/yr
Wind risk 2/10 · Minimal
- Chance of severe wind over 30 yrs
- —
Air-quality risk 2/10 · Minimal
- Unhealthy air days now
- 1 days/yr
- Unhealthy air days in 30 yrs
- 2 days/yr
Risk factors via First Street. Map © Google.
Why this score? — see what drove the B+ grade
The composite is a weighted blend of 9 inputs, each scored 0–100. Each bar is that input's sub-score; the figure is the points it added to the 100-point composite (weight × sub-score).
- Cash flow +30.0/30.0
- ARV discount +15.0/15.0
- 1% rule +10.0/10.0
- DSCR +10.0/10.0
- Livability +4.0/5.0
- Schools +3.8/10.0
- Rent growth +2.5/5.0
- Condition / age +2.5/5.0
- Appreciation +0.0/10.0
$85,000
🖨 Deal sheet (PDF) 📄 Offer letter ✓ Due diligence
Listing remarks
Attention Investors: This charming 2-bedroom, 1-bath property in Des Moines is the fixer-upper you?ve been waiting for. Located just minutes from downtown and highway 235, this property is a handyman special priced as a bargain for those ready to build equity. Being sold as-is, this home is a prime candidate for a rehab or flip. Whether you are looking for a renovation project or a high-potential investment, the cozy layout provides a solid foundation for your vision. Ideal TLC project bring your tools and your vision to this high-potential fixer and capitalize on one of the city's most convenient locations.
Key facts
- 5,410 sq ft lot
- 2 garage spots
- Built 1900
Property features AI
Exterior
- Parking: Detached 2-car garage
- Utilities: Public water
- Home design: Facing information not provided; Entry level not provided
- Construction: Metal siding; Brick/mortar foundation; Asphalt shingle roof; Built year not provided
- Exterior features: Rectangular lot; 50 x 108 lot dimensions; Concrete road/access
Interior
- Bathrooms: 1 full bathroom
- Heating & cooling: Forced air heating; Natural gas heating
- Interior features: Eat-in kitchen; Unfinished basement
Neighborhood map
What this means for you Summary
Snapshot
- This is a 2-bed/1.0-bath single-family listed at $85k.
Deal economics
- At list price, monthly cash flow is $479 ($6k/yr) — positive.
- The deal already cash-flows at list — no discount required.
- Meets the 1% rule at list price ($1k rent vs $85k).
- Cap rate 13.0% vs local median 3.1% in Des Moines — top-decile yield for the area; either an underpriced asset or a hidden risk that comps aren't pricing in. Stress-test before assuming the spread holds.
Location & tenants
- Location reads 81/100 on livability (#63 in IA, #1,432 nationally) — a professional / high-income tenant draw. Strengths: commute A+, cost of living A+, housing A+; Watch: employment C-, crime F.
- Des Moines Independent Community School District (urban): math 43% / reading 46% proficiency, ranked #289 of 289 in IA (top 100%) — families likely to look elsewhere, expect single-tenant / working-renter base with shorter leases; 63% free/reduced lunch — lower-income household profile, screen leases tightly.
- Zoned schools: Capitol View Elementary School (math 43% / reading 31%, grade F, #589 of 616 statewide, top 96%, 505 students, 94% FRL); Hiatt Middle School (math 31% / reading 35%, grade F, #244 of 246 statewide, top 99%, 529 students, 95% FRL); East High School (math 38% / reading 51%, grade F, #324 of 336 statewide, top 97%, 2,040 students, 79% FRL) — zoned schools average 89% FRL vs 63% district-wide (27 pts higher); higher-poverty schools than district average — tighter screening recommended.
- Market conditions: 106 active listings in the ZIP; 17 comparable units currently listed for rent nearby; rentals at typical pace (median 26d on market — plan ~3-4 weeks tenant-placement turnaround); 47% of comp listings sitting > 30 days — soft ceiling on asking rent; 2,953 units permitted in Polk County in 2024 (540 in 5+ unit buildings).
Forward outlook
- Local home prices are declining (-3.0%/yr); year-one equity from $588 of loan paydown is wiped out by about $3k of value loss. Plan a longer hold.
- Polk County population projected at +37% by 2050 — long-run rental-demand tailwind backs the buy-and-hold thesis.
- At projected returns (-3.0% appreciation + 3.0% rent growth), your $24k cash investment doubles in ~6 years — after that, you're playing with house money.
Negotiation context
- Only 12 days on market — expect competitive offers; lowballing is unlikely to land.
- 2 sale attempts since 13y ago with the ask held roughly flat each time — persistent listings suggest the price (not the market) is what's stuck; bring a comps-based counter.
Risks & watch-outs
- Watch-outs: built in 1900 — expect roof / HVAC / electrical / plumbing capex.
Questions for the listing agent
- Built in 1900 — when were the roof, HVAC, electrical panel, plumbing, and water heater last replaced?
- Is there a deadline driving the sale (1031 exchange, divorce, estate, relocation)? That informs how much negotiation room exists.
- Schools are D-rated, which usually means shorter tenancies and higher turnover. Who's the typical renter profile here, and what's been the actual vacancy rate?
- Crime grade is F in this area — have there been break-ins, vandalism, or insurance claims at this property in the last 3 years? What carrier currently insures it and at what premium?
- What's the average days-on-market for RENTAL listings here right now (not sales)? A rising rental-DOM trend means longer vacancies and softer asking-rent achievability than the comps imply.
- What's the recent tenant-quality profile in this submarket — average credit score on applications, eviction rate, late-payment / NSF rate, and stable-employment percentage? A property-management company in the area should have these aggregated.
- How much new for-sale + rental construction is in the pipeline within 1–3 miles? Heavy new supply typically softens prices + rents 12–24 months out; constrained supply supports both.
Investment metrics
- 1% rule
- 1.54% ✓
- Cap rate
- 13.05%
- Cash-on-cash
- 24.13%
- DSCR
- 2.07
- GRM
- 5.4
CMA / ARV
- ARV (on-the-fly)
- $167,090
- Comps found
- 12
Show comp detail 12 sales within ~0.75 mi
| Address | Dist | Beds/Ba | Sqft | Sold | Price | $/sf | Match |
|---|---|---|---|---|---|---|---|
| 1804 Capitol Ave | 0.34mi | 2/2.0 | 1,126 (+4%) | 4mo | $164,900 | $146 | 71 |
| 1804 Des Moines St | 0.21mi | 3/1.0 (+1) | 1,193 (+10%) | 7mo | $168,000 | $141 | 63 |
| 2069 E Grand Ave | 0.42mi | 3/2.0 (+1) | 1,125 (+4%) | 4mo | $117,500 | $104 | 61 |
| 2224 Capitol Ave | 0.58mi | 3/2.0 (+1) | 1,082 (-0%) | 3mo | $110,000 | $102 | 61 |
| 807 E 23rd Ct | 0.60mi | 3/2.0 (+1) | 1,105 (+2%) | 1mo | $250,000 | $226 | 59 |
| 1531 Stewart St | 0.57mi | 3/1.5 (+1) | 1,062 (-2%) | 6mo | $175,000 | $165 | 58 |
| 1460 E 22nd St | 0.59mi | 3/2.0 (+1) | 1,037 (-4%) | 1mo | $189,900 | $183 | 55 |
| 1429 E 17th St | 0.55mi | 3/1.0 (+1) | 957 (-12%) | 6mo | $147,000 | $154 | 45 |
| 2432 Maple St | 0.73mi | 2/2.0 | 980 (-10%) | 2mo | $209,000 | $213 | 44 |
| 2334 Des Moines St | 0.64mi | 2/1.5 | 1,242 (+14%) | 2mo | $183,000 | $147 | 43 |
| 2403 Lyon St | 0.68mi | 2/1.5 | 960 (-12%) | 7mo | $145,000 | $151 | 41 |
| 1709 E Walnut St | 0.49mi | 3/1.5 (+1) | 927 (-15%) | 6mo | $205,000 | $221 | 40 |
Match score weights: distance 35% · size 25% · config 20% · recency 20%. Top-matched comps best support the ARV.
Projected returns pro-forma
-3.0% appreciation · 3.0% rent growth · sell at horizon
- IRR
- 17.4%
- Equity multiple
- 1.70×
- Total profit
- $16,704
- Equity at exit
- $12,674
- IRR
- 25.9%
- Equity multiple
- 3.26×
- Total profit
- $53,788
- Equity at exit
- $7,349
Cash invested: $23,800 (down + closing). Projections, not guarantees.
Landlord ↔ Tenant lean methodology
- Overall (STATE)
- 83 Strongly Landlord-Friendly
- State Iowa
- 83 Strongly Landlord-Friendly · R+6
- County
- — inherits STATE
- City
- — inherits STATE
ZIP-level market 50316
- Home prices YoY
- -29.5%
- Active inventory
- 106
- Price-to-rent
- 5.4×
Monthly cashflow live
- Estimated rent
- $1,307 high interval (Pro) →
- Mortgage (P&I)
- −$446
- Tax from tax record
- −$73 /mo · $876/yr
- Insurance
- −$35
- HOA
- −$0
- Vacancy / Maint / Mgmt
- −$275
- Net cashflow
- $479
Break-even live
Sensitivity live
| Price | -10% $527 | -5% $503 | +0% $479 | +5% $454 | +10% $430 |
|---|---|---|---|---|---|
| Rent | -10% $375 | -5% $427 | +0% $479 | +5% $530 | +10% $582 |
| Rate | -1.0pp $521 | -0.5pp $500 | base $479 | +0.5pp $457 | +1.0pp $434 |
UW: 25.0% down · 7.5% · 30yr · 1.5% tax · 5.0% vac · 8.0% maint · 8.0% mgmt
Financing live
Cash to close
- Down payment
- $21,250
- Closing costs
- $2,550
- Reserves months
- —
- Total cash needed
- —
Loan-product check · same deal, 3 products live
Conventional
25% down · 7.5% · 30yr
- Down + closing
- —
- Monthly P&I
- —
- Monthly cashflow
- —
- DSCR
- —
- Eligible?
- —
Personal DTI + credit; lowest rate.
DSCR
20% down · 8.5% · 30yr
- Down + closing
- —
- Monthly P&I
- —
- Monthly cashflow
- —
- DSCR
- —
- Eligible?
- —
No personal income docs; deal must DSCR.
Hard money
10% down · 12.0% · 12mo
- Down + closing
- —
- Monthly P&I
- —
- Monthly cashflow
- —
- DSCR
- —
- Eligible?
- —
Short-term bridge; refi at stabilization.
Rent comps 17 comps
| Address | Beds | Baths | Sqft | Rent | $/sqft | DOM | Units | Dist |
|---|---|---|---|---|---|---|---|---|
| 1713 Lyon St Des Moines, IA | 3.0 | 1.0 | 834 | $1,045 | $1.25 | 23d | 1 | 0.29mi |
| 410 E 17th St Des Moines, IA | 3.0 | 1.0 | 1000 | $1,695 | $1.70 | 45d | 1 | 0.41mi |
| 2120 Capitol Ave Des Moines, IA | 3.0 | 1.0 | 973 | $1,395 | $1.43 | 45d | 1 | 0.43mi |
| 1525 Des Moines St Des Moines, IA | 3.0 | 1.0 | 928 | $1,195 | $1.29 | 45d | 1 | 0.56mi |
| 1513 Des Moines St Des Moines, IA | 3.0 | 1.0 | 900 | $995 | $1.11 | 25d | 1 | 0.58mi |
| 1364 Idaho St Des Moines, IA | 2.0 | 1.0 | 804 | $1,195 | $1.49 | 25d | 1 | 0.85mi |
| 1726 E 24th St Des Moines, IA | 3.0 | 1.0 | 850 | $1,295 | $1.52 | 45d | 1 | 0.93mi |
| 1530 E 14th St Des Moines, IA | 3.0 | 2.0 | 1428 | $1,900 | $1.33 | 16d | 1 | 1.01mi |
| 1301 E 12th St Unit 2 Des Moines, IA | 2.0 | 1.0 | 995 | $795 | $0.80 | 25d | 1 | 1.04mi |
| 922 Walker St Des Moines, IA | 3.0 | 1.0 | 864 | $1,295 | $1.50 | 25d | 1 | 1.07mi |
| 2726 Des Moines St Des Moines, IA | 2.0 | 1.0 | 975 | $1,295 | $1.33 | 45d | 1 | 1.08mi |
| 1354 E 12th St Des Moines, IA | 2.0 | 1.0 | 1300 | $925 | $0.71 | 45d | 1 | 1.10mi |
| 2121 E 23rd St Des Moines, IA | 3.0 | 1.0 | 972 | $1,395 | $1.44 | 45d | 1 | 1.14mi |
| 915 E Washington Ave Des Moines, IA | 3.0 | 1.0 | 1457 | $1,450 | $1.00 | 25d | 1 | 1.20mi |
| 2925 Maple St Des Moines, IA | 3.0 | 1.0 | 1270 | $1,500 | $1.18 | 25d | 1 | 1.30mi |
| 601 E Vine St Des Moines, IA | 2.0 | 1.0–2.0 | 730 | $1,595 | $2.18 | 21d | 19 | 1.48mi |
| 309 E 5th St #406 Des Moines, IA | 1.0 | 1.0 | 1057 | $1,700 | $1.61 | 45d | 1 | 1.49mi |
Listing history 12 events
-
2026-06-13status $85,000 Pending 12 DOM
-
2026-06-10days on market $85,000 Active 12 DOM
-
2026-06-09days on market $85,000 Active 11 DOM
-
2026-06-08days on market $85,000 Active 10 DOM
-
2026-06-07days on market $85,000 Active 9 DOM
-
2026-06-05days on market $85,000 Active 6 DOM
-
2026-06-03days on market $85,000 Active 5 DOM
-
2026-06-02days on market $85,000 Active 4 DOM
-
2026-06-01days on market $85,000 Active 3 DOM
-
2026-05-31days on market $85,000 Active 2 DOM
-
2026-05-31remarks 615-char remark
-
2026-05-31$85,000 Active 1 DOM
ⓘ Source: listings_history table (triggers on properties + properties_extension) + one-shot
backfill from property_details.listing_events for pre-trigger history.
Tax reassessment forecast IA · Partial reset (capped growth)
- Current annual tax
- $876 · $73/mo
- Projected year-2 tax
- $1,105 · $92/mo
- Expected delta
- +$229/yr (+$19/mo · 26.2%)
ⓘ Screening estimate from a state-policy table — verify with the county assessor before closing.
Climate risk First Street
- Flood 1/10 Low FEMA zone X (unshaded) · 0% chance over 30 yrs
- Wildfire 1/10 Low
- Heat 3/10 Moderate 7 d/yr ≥103°F today · 15 d/yr by 30 yrs out
- Wind 2/10 Low
- Air quality 2/10 Low 1 unhealthy d/yr today · 2 by 30 yrs out
Nearby sold comps map
Loading sold comps map…
Walkable amenities ~0.75 mi
Loading nearby amenities…
Taxation est. · year 1
- Rental income
- $15,687
- − Mortgage interest
- −$4,761
- − Property taxes
- −$876
- − Insurance
- −$425
- − Repairs & maintenance
- −$1,255
- − Management
- −$1,255
- − Depreciation
- −$2,473
- Taxable income
- $4,642
- Est. tax owed @ 24.0%
- −$1,114
- After-tax cash flow
- $4,628/yr
For passive investors: Depreciation is non-cash, so a rental often shows a tax loss while cash-flowing — sheltering income. Rental losses are passive: they offset passive income freely, and up to $25,000/yr can offset ordinary (W-2) income if you actively participate and your MAGI is under $100k (phasing out to $0 by $150k); unused losses carry forward. On sale, claimed depreciation is recaptured at up to 25%, and gains may owe capital-gains tax (a 1031 exchange can defer both). Figures are a year-1 estimate at your 24.0% rate — not tax advice; consult a CPA.
Schools (NCES district)
- District
- Des Moines Independent Community School District
- NCES district ID
- 1908970
- Math proficiency
- 43% ▼ -6.00%
- Reading proficiency
- 46% ▼ -1.00%
- Median HH income
- $45,905
- Composite
- 37.83/100
- National rank
- #4331
- State rank
- #289 of 289 in IA
Livability — Des Moines
- Score
- 81/100
- State rank
- #63
- US rank
- #1432
Category grades
Schools grade is shown separately in the Schools card above.
Census & demographics
- Census place
- Des Moines, IA
- City population
- 203,612
- Population (ZIP)
- 16,188
Population outlook (Polk County) Hauer SSP2
- Today (2025)
- 548,042 people
- By 2030
- 588,557 · +7.4%
- By 2040
- 670,629 · +22.4%
- By 2050
- 752,830 · +37.4%
- By 2075
- 955,069 · +74.3%
- By 2100
- 1,115,436 · +103.5%
Race, ethnicity, and origin ACS 2023
- Neighborhood character
- Diverse neighborhood (Simpson 0.68)
- Race & ethnicity
- White 48% Hispanic / Latino 27% Black 12% Two or more races 12% Asian 7% Native American 1%
- Hispanic origin (detail)
- Mexican 21% Puerto Rican 1%
- Common ancestry
- Portuguese 2% Slovak 1% Iranian 1%
- Foreign-born
- 16% · Canada, Vietnam, Philippines
- Languages at home
- 69% English-only · Spanish 20% Other Asian/Pacific 3% Vietnamese 2%
Political lean MEDSL · Polk
- 2024 margin
- D (+10.9) · D 54.8% · R 43.9% · Other 1.3%
- 2008→2024 swing
- -3.7pp toward R · 2008: 14.6pp · 2024: 10.9pp
- All cycles
- 2024: D+10.9 2020: D+15.2 2016: D+11.5 2012: D+14.2 2008: D+14.6
Not yet ingested
- Civics
- —
Market trends
- HPI YoY
- ▼ -121.34%
- Current HPI
- 290.3838
- Rent YoY
- —
- Metro
- —
- State GDP YoY
- ▲ 2.48%
- F500 in state
- 4
Industry mix (Fortune 500 HQ in IA)
| Industry | F500 HQs | Revenue |
|---|---|---|
| Financial Services | 1 | $16B |
|
||
| Retail / Convenience | 1 | $15B |
|
||
Price history
+70.0% since first listed3 events — show timeline
- 2026-05-29 Listed $85,000 DMMLS
- 2013-08-26 Listing Removed — DMMLS
- 2013-05-23 Listed $50,000 DMMLS
Property tax history
+10.0%/yrLatest (2025): $876 · +4.3% YoY. Source: county tax records.
Cash-flow waterfall
monthlySold comps — $/sqft
last 12 mo · ≤1 miLoading sold comps…